Internet - Taking Part Survey 2019/20
Published 16 September 2020
Applies to England

© Crown copyright 2020
This publication is licensed under the terms of the Open Government Licence v3.0 except where otherwise stated. To view this licence, visit nationalarchives.gov.uk/doc/open-government-licence/version/3 or write to the Information Policy Team, The National Archives, Kew, London TW9 4DU, or email: psi@nationalarchives.gov.uk.
Where we have identified any third party copyright information you will need to obtain permission from the copyright holders concerned.
This publication is available at https://www.gov.uk/government/statistics/taking-part-201920-internet/internet-taking-part-survey-201920
The Taking Part survey is a continuous face to face household survey of adults aged 16 and over and children aged 5 to 15 years old in England. This chapter summarise results from adults (16+) and their use of the internet from the 2019/20 survey, which ran from April 2019 to March 2020.
Differences between groups are only reported on in this publication where they are statistically significant i.e. where we can be confident that the differences seen in our sampled respondents reflect the population [footnote 1].
1. Internet Access
Over 9 in 10 respondents (93%) reported having access to the internet in their household at the time of data collection and 91% of respondents having used the internet at some point in their lives.
In the survey, respondents were asked to rate their ability to use the internet from a scale of 0 (low ability) to 10 (high ability). Just over a third of respondents (36%) gave the highest possible answer. Overall, 78% of respondents selected a value of 7 or higher.
Figure 5.1 Reported ability to use the internet, 2019/20
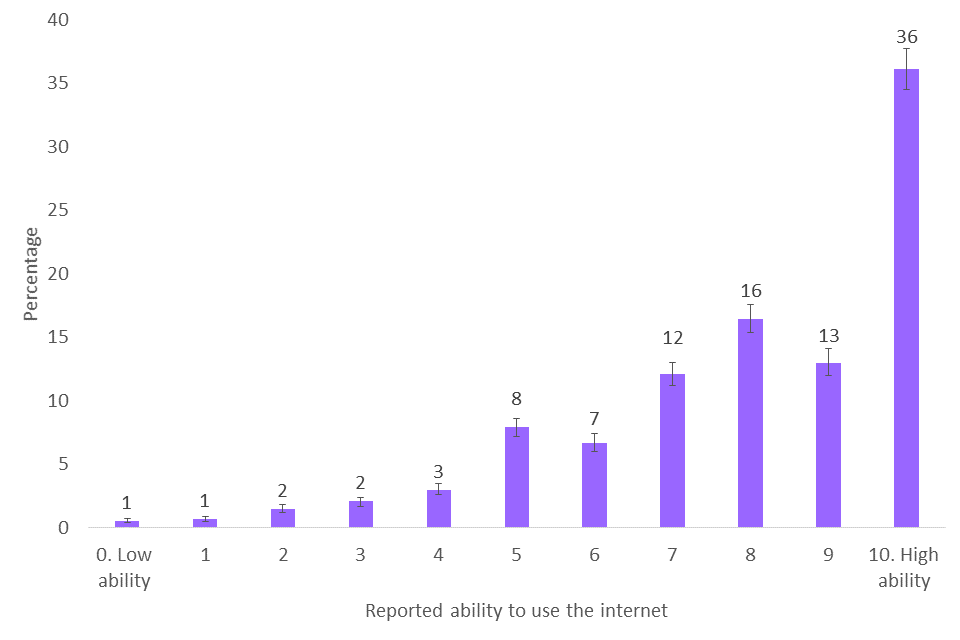
Self-reported ability to use the internet, from 0 – Low ability to 10 – High ability, 2019/20
Respondents were asked the reasons why they had gone online in the last 12 months, picking as many options as applicable from a given list. The most popular options from the list were comparing products and prices (76%), using a bank’s online services (75%) and paying bills (68%).
Figure 5.2 Reasons reported for going online, 2019/20
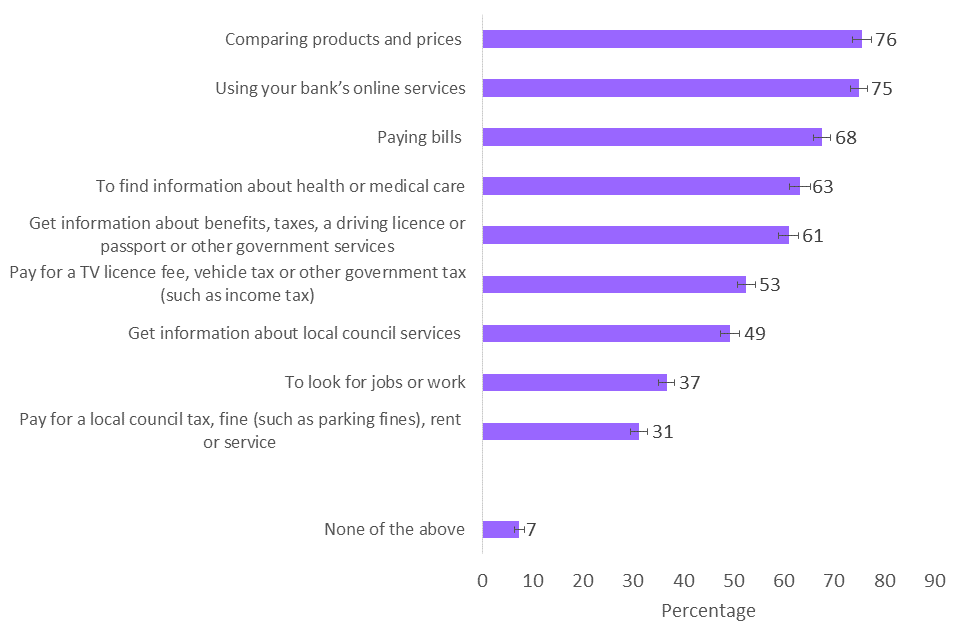
Popularity of given options from list of reasons why a respondent may have gone online, 2019/20
Respondents were also asked about their trust in both the government and private companies in using their personal data online. The sum of ‘completely trust them’, ‘trust them a great deal’ and ‘tend to trust them’ was created to show general trust for private and government companies. 63% of respondents reported having general trust about the government, whilst 45% reported general trust in private companies. Complete trust was reported by 6% of respondents about the government and 1% of respondents about private companies. No trust about the government was reported by 9%, significantly lower than 12% who reported they had no trust about private companies.
Figure 5.3 Trust in government and private sector with personal data, 2019/20
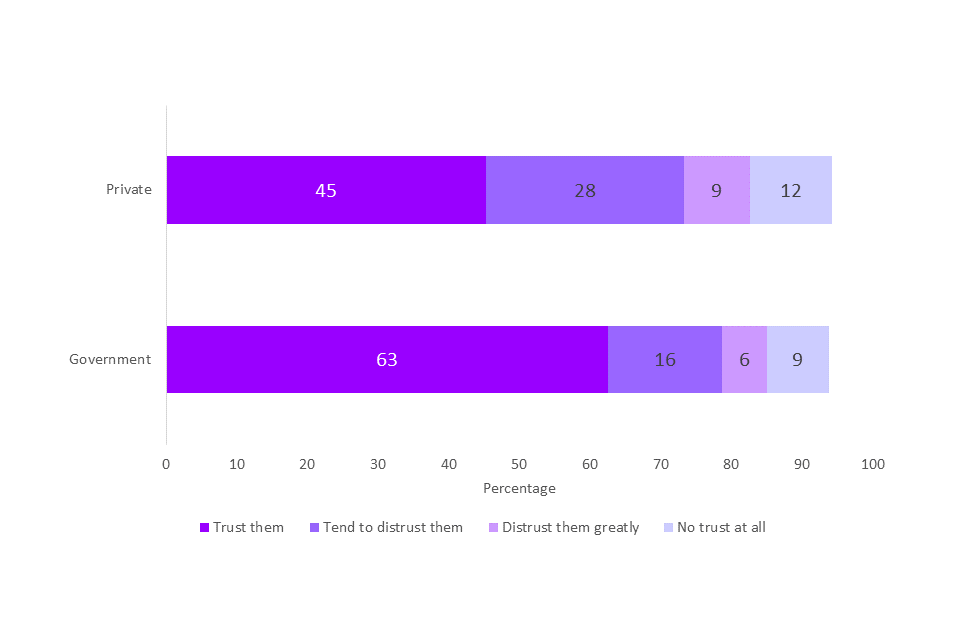
Reported trust in government and private companies in using respondent’s personal data online, 2019/20
Use of particular emerging technologies (see figure 5.4) by respondents was also captured, indicating that 20% of respondents had used a virtual reality headset in the last 12 months. However, most respondents (65%) had used none of the technologies listed.
Figure 5.4 Use of emerging technologies, 2019/20
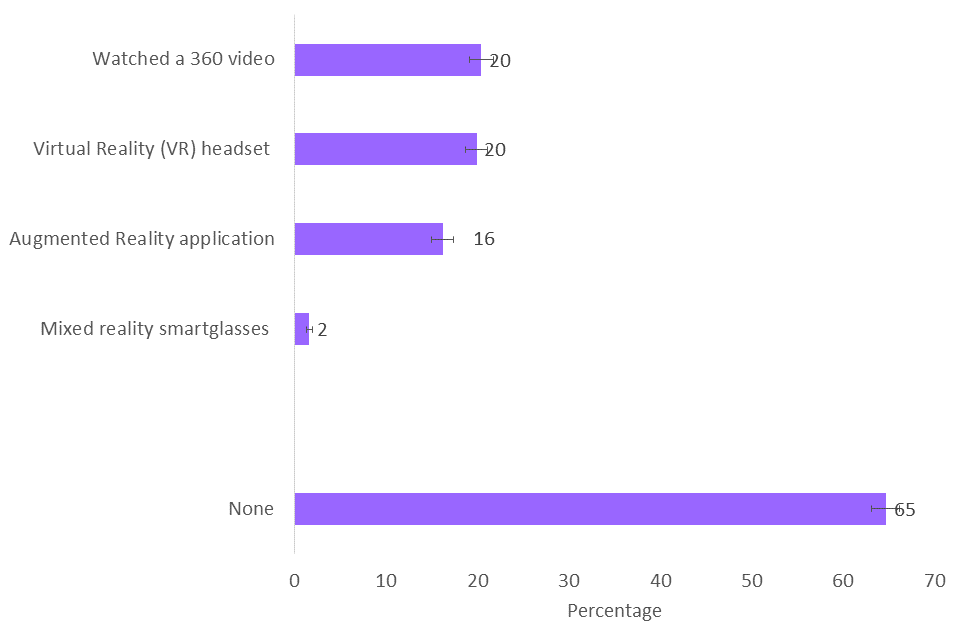
Whether respondent has used any of a list of emerging technologies in the last 12 months, 2019/20
2. Who reports a high ability to use the internet?
As age increased, the proportion of respondents who reported a high ability to use the internet steadily decreased, with 95% of 16-24 year olds and 33% of those aged over 75 reporting ’7+ (high ability)’.
Figure 5.5 Percentage of respondents who reported a high (7+) ability to use the internet by age, 2019/20
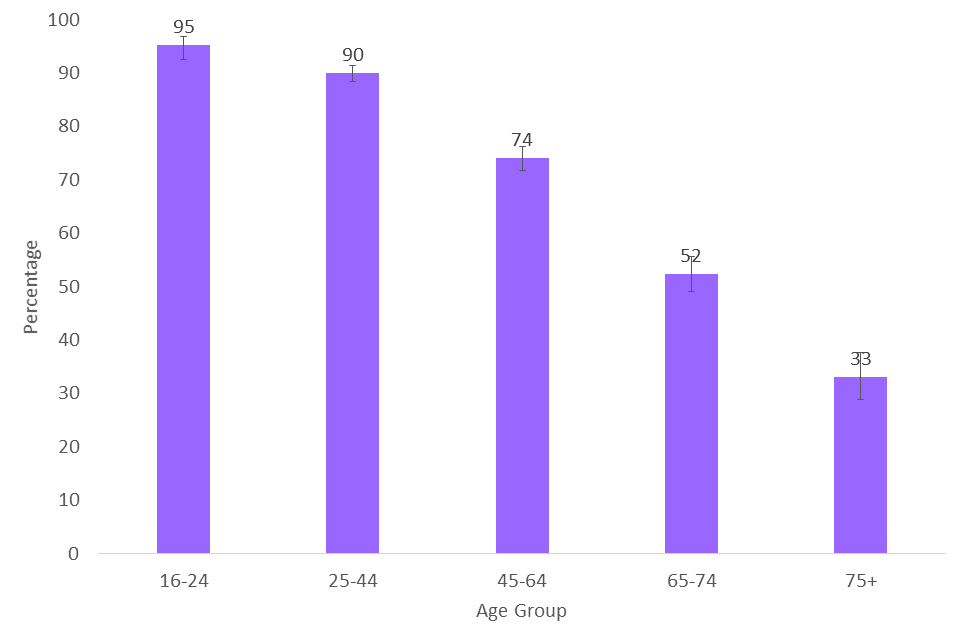
Whether a respondent has a self-reported high ability to use the internet (7+) by age, 2019/20
A higher proportion of men reported a high ability to use the internet (80%) compared to women (76%).
Less respondents with a long-term limiting illness or disability reported a high ability to use the internet (67%) than those without (82%).
When looking at socio-economic background [footnote 2], respondents with higher managerial, administrative and professional occupations were more likely to report a high ability (84%) compared to respondents with intermediate occupations (75%) and those with routine and manual occupations (67%).
2.1 Further demographic data
- Those in the private rented sector (86%) were more likely to report a higher ability than homeowners (77%) or those in the social rented sector (71%).
- A greater proportion of respondents who were working reported a high ability to use the internet (85%) compared to those not working (64%).
- No significant variability was seen for the categories of index of multiple deprivation [footnote 3], ethnicity, region, or urban/rural status
-
The 95% confidence intervals are indicated by error bars on the charts. They show the range that we are 95% confident the true value for the population falls between. When there is no overlap between the error bars for two or more groups, we can be more confident that the differences between groups represent true differences between these groups in the population ↩
-
Using National Statistics Socio-economic classification (NS-SEC), respondents were categorised as being in one of three groups – Higher managerial, administrative and professional occupations; Intermediate occupations; Routine occupations. The NS-SEC classifies people depending on their employment. For more information see Annex B. ↩
-
The Index of Multiple Deprivation, commonly known as the IMD, is the official measure of relative deprivation for small areas in England. It is calculated using several measures such as income deprivation, crime and living environment deprivation. The Index of Multiple Deprivation ranks every small area in England from 1 (most deprived area) to 32,844 (least deprived area), which we have sorted into deciles for this publication. ↩