State Pension age Review 2023
Published 30 March 2023

© Crown copyright 2023
This publication is licensed under the terms of the Open Government Licence v3.0 except where otherwise stated. To view this licence, visit nationalarchives.gov.uk/doc/open-government-licence/version/3 or write to the Information Policy Team, The National Archives, Kew, London TW9 4DU, or email: psi@nationalarchives.gov.uk.
Where we have identified any third party copyright information you will need to obtain permission from the copyright holders concerned.
This publication is available at https://www.gov.uk/government/publications/state-pension-age-review-2023-government-report/state-pension-age-review-2023
Presented to Parliament pursuant to section 27(6) of the Pensions Act 2014
March 2023
Any enquiries regarding this publication should be sent to us at londoncaxtonhouse.statepensionenquiries@dwp.gov.uk
ISBN 978-1-5286-3730-5
ID E02808976 03/23
Executive Summary
Introduction
This is the second Review of State Pension age by the Secretary of State for Work and Pensions. The Secretary of State is required, under section 27 of the Pensions Act 2014, to report on this issue periodically.
As a society we should celebrate improvements in life expectancy:
-
life expectancy has increased over time and is projected to continue to do so. Life expectancy has increased by 10 years for male and females as of 2020 compared to 1951.[footnote 1]
-
by 2070, life expectancy at birth of males and females is projected to reach 92.5 and 94.6 respectively, reflecting improvements of more than 4 years compared to 2020.
However, since the 2017 State Pension age Review was undertaken, the rate of increase in life expectancy has slowed. For example, in the 2014-based projections that informed the 2017 Review, life expectancy at age 65 was projected to reach 27.3 years by 2060, whereas in the latest 2020-based projections it is projected to reach 24.4 years.[footnote 2] For most people and communities this does not represent falling life expectancy, as life expectancy at age 65 is 20.9 as of 2020, but a slower rate of future improvement. Nevertheless, the government is aware of growing inequalities in life expectancy outcomes and is taking action to tackle this.
Alongside changes in life expectancy, the number of children people have on average is lower than seen historically and is also lower than at the time of the 2017 State Pension age Review[footnote 3]. As a result of changes in total fertility rates and continued life expectancy improvements, there are projected to be 5 million more pensioners in the population by 2070 and just 1 million more of working-age.[footnote 4]
The differences in the growth of the pensioner population and that of the working-age population has a demographic impact. There were 280 pensioners for every 1000 people of working age as of 2020. This will increase rapidly from the 2030s and will reach levels never seen before by 2070, where the ratio is projected to be 393 pensioners per 1,000 people of working age4.
The Office for Budget Responsibility[footnote 5] in their 2022 fiscal risks and sustainability report estimate that the costs of State Pension will increase from 4.8% of Gross Domestic Product (GDP) in 2021-22 to 8.1% of GDP in 2071/72. That needs to be seen in the light of the significant change in the UK economy in recent times and the impact on the public finances of heightened global volatility. This has changed the medium-term context which will affect the long-run outlook of the public finances.
It is important that the State Pension remains the foundation of income in retirement for future generations and that it is sustainable and fair.
Over the next 50 years there will be a continued increase in the pension age population. The government will, in light of this, consider how to most effectively maintain an affordable system that is sustainable in the long-term.
We must have the best evidence available in order to make decisions about the future course of State Pension age. In this report we describe the recent slowing in the rate of changes to life expectancy, how State Pension spending will increase in the years to come and the impact on people of working-age. We will also describe why decisions on when State Pension age should increase to age 68 need to be deferred until we have the best possible information.
Evidence presented to the Secretary of State
The Pensions Act 2014 requires the government to commission two independent reports to inform the periodic State Pension age Review:
-
the Government Actuary is required to analyse future possible State Pension age timetables, calculated from the latest life expectancy projections and based on specified proportions of adult life that individuals in the future could expect to spend in receipt of State Pension:
-
a report on wider factors relevant to setting State Pension age. Baroness Neville-Rolfe reported on factors specified by the Secretary of State.
The two reports are published alongside this report. The government is grateful for the work of the Government Actuary and Baroness Neville-Rolfe.
Report of the Government Actuary
The Government Actuary was asked to include a commentary on trends in life expectancy data. He was asked to assess how long a person can expect to spend in retirement under the current legislative timings for the rise to 67 and 68 and the proposed 2017 State Pension age Review change to bring forward the rise to 68 to 2037-39. The Government Actuary was asked to consider the scenarios of 32% of adult life in retirement, the recommended long-term aim from the 2017 Review, as well as 31% and 30% to show the impacts of a lower proportion of adult life spent in retirement.
The independent report on other specified factors
Baroness Neville-Rolfe was commissioned to explore metrics that the government could use when considering how to set State Pension age, including whether it was right to continue using the proportion of adult life spent in retirement in determining the State Pension age timetable. The key recommendations made by Baroness Neville-Rolfe are:
-
it remains right for there to be a fixed proportion of adult life people should expect to spend, on average, in receipt of State Pension;
-
this proportion should be set at ‘up to 31%’ of adult life;
-
the government should set a limit on State Pension-related expenditure of up to 6% of GDP.
Baroness Neville-Rolfe’s recommendation on 31% keeps to the spirit of the findings of the 2017 State Pension age Review where 32% of adult life receiving State Pension was the average experience of pensioners from 1996-2016 reaching age 65. Using the latest life expectancy projections and reflecting changes to State Pension age means this proportion is now closer to 31%. Baroness Neville Rolfe found that the State Pension age increase to age 67 in 2026-2028 was consistent with the 31% metric, but this was not the case with the age 68 increase timetable as set out in the 2017 Review and, as a result, recommended that the timetable should be pushed back to 2041-43.
It should be noted that the Government Actuary provided a sensitivity analysis to his findings. He notes that timelines predicted in the report will change with future life expectancy projections and that “relatively minor changes in the mortality assumptions can result in fairly large changes to the calculated SPa timetable”. The analysis shows changing the long-term mortality improvement rate (currently 1.2%) by 0.2% per annum in either direction could move a rise in State Pension age by up to 10 years under the 32% scenario.
Conclusions of the 2023 State Pension age Review
The government wants to ensure that State Pension remains the foundation of income in retirement for future generations and that it is sustainable and fair.
It has considered the evidence submitted by the Government Actuary and the Independent Review and noted the response to the Call for Evidence made by Baroness Neville Rolfe.
The government welcomes the findings from the Independent Report. Baroness Neville-Rolfe has highlighted key challenges in respect of life expectancy and fiscal sustainability of the State Pension and has sought to balance these considerations alongside government’s longstanding ambition of delivering intergenerational fairness.
The government agrees with the Independent Report conclusion that the increase to State Pension age from 66 to 67 is appropriate. This rise will therefore take place between 2026-2028.
The government notes the Independent Report’s recommendations on the rise from 67 to 68. However, Baroness Neville-Rolfe was not able to take into account the long-term impact of recent significant external challenges, including the COVID-19 pandemic and recent global inflationary pressures. This brings a level of uncertainty in relation to the data on life expectancy, labour markets and the public finances. The government is mindful that a different decision might be more appropriate once this is clearer. Given the wide-ranging impacts, it is important to take the time to get this right.
We plan to have a further review within two years of the next Parliament to consider age 68. This will ensure that the government is able to consider the latest information which was not available to the independent reviewer at the time. This includes 2021 Census data, the current economic position, the impact on the labour market of our package of measures to tackle inactivity and any other relevant factors. The current rules for the rise from 67 to 68 therefore remain appropriate and the government does not intend to change the existing legislation prior to the conclusion of the next review. All options for the rise to the State Pension age from 67 to 68 that meet the 10 years notice period will be in scope at the next review.
The government remains committed to the principle of 10 years notice of changes to State Pension age and will ensure that any legislation can be brought forward in a timely manner.
Chapter 1: Introduction
Under the Pensions Act 2014, the Secretary of State for Work and Pensions is required to regularly review State Pension age to assess whether the rules remain appropriate. This chapter provides an overview of recent State Pension changes, what the 2023 Review has considered and concluded, and the next steps for determining future policy on the rise to 68.
1.1 Introduction to the State Pension system
The State Pension has been a key pillar of the UK’s welfare system for the last 120 years. The National Insurance Act 1946 introduced a policy where flat rate National Insurance contributions build entitlement to a flat-rate basic State Pension.
The State Earnings Related Pension scheme was introduced in 1978 with the aim of providing occupational pensions for those whose employers did not provide one. However, affordability issues led to a system where many more pensioners needed to be supported by the means-test and private saving had significantly reduced.
The Pensions Commission[footnote 6], which reported in 2005, achieved a new national consensus around a core pensions strategy for the UK where the state provides a contributory minimum amount on top of which people save privately to achieve the provision that is right for them in later life. The Pensions Act 2007 legislated to achieve this by reforming both the basic and additional State Pension from April 2010.
The 2013 White Paper ‘The single-tier pension: a simple foundation for saving’[footnote 7] subsequently introduced the new State Pension, a single-tier pension that significantly simplified the system and provided a foundation to support people saving for retirement. The Pensions Act 2014 legislated to introduce this from April 2016.
1.2 Changes to State Pension age
1.2.1 Legislated State Pension age rises
From 1948 until 2010, the State Pension age was 60 for women and 65 for men. The Pensions Act 1995 introduced the equalisation of State Pension age for men and women, with women’s pensionable age set to increase to 65 between 2010 and 2020.
In 2005 the Pensions Commission recommended increasing State Pension age in line with increasing life expectancy projections, setting out a principle for “each generation to enjoy the same proportion of life contributing to and receiving state pensions.”
As a result of the Pensions Commission’s recommendations, the Pensions Act 2007 legislated to increase State Pension age for both men and women to age 66 between 2024 and 2026, age 67 between 2034 and 2036 and age 68 between 2044 and 2046.
The Pensions Act 2011 accelerated the timetable for equalising State Pension age at 65, so that it was completed in November 2018, and brought forward the increase in State Pension age to 66 to between 2018 and 2020. The Pensions Act 2014 brought forward the increase to 67 to between 2026 and 2028.
The current legislated pathway is for the State Pension age to rise to 67 between 2026 and 2028 and 68 between 2044 and 2046. The legislation stipulates that this Review must consider whether this pathway is appropriate.
1.2.2 Periodic review of State Pension age
The Pensions Act 2014 legislated for a periodic State Pension age Review to assess ‘whether the rules about pensionable age are appropriate, having regard to life expectancy and other factors that the Secretary of State considers relevant’. It must be informed by findings from two independent reports.
The first is from the Government Actuary to determine:
-
whether the rules about pensionable age mean that, on average, a person who reaches pensionable age within a specified period can be expected to spend a specified proportion of his or her adult life in retirement; and
-
if not, ways in which the rules might be changed with a view to achieving that result.
The second is a report from an independent person appointed by the Secretary of State to consider specified factors relevant to the Review.
The first Review of State Pension age reported in 2017. The government accepted the recommendation of the Independent Review, undertaken by John Cridland, that State Pension age should rise to age 68 over the period 2037-2039. The government outlined that this would be subject to a further Review, to enable consideration of the latest life expectancy projections. The government also concluded that it would aim for ‘up to 32%’ in the long run as the right proportion of adult life to spend in receipt of State Pension.
1.3. Scope of the 2023 Review
This report delivers the requirement under the Pensions Act 2014 to regularly review State Pension age.
Chapters 2 and 3 set out a summary of the life expectancy, demographic, fiscal, economic, labour market and other evidence that the government has considered over the course of the Review.
Chapter 4 sets out a summary of the evidence produced by:
-
The Government Actuary, who reported on the age of entitlement in legislation by analysing the latest life expectancy projections; and
-
Baroness Neville-Rolfe, who reported on recent trends in life expectancy and the metrics available for setting State Pension age. The relevant factors which she was invited to consider are set out in Section 4.2.
A summary of an evaluation of the recent State Pension age rise from 65 to 66 is included in the Annex.
State Pensions policy is reserved in Great Britain so any changes will also apply in Scotland and Wales. Policy on State Pension is transferred to Northern Ireland, although the Executive generally mirrors changes in Great Britain to maintain parity. The UK Government agreed during the passage of the Pensions Act 2014 that the State Pension age Review would consider evidence from across the UK. The Review has therefore, considered differences across countries and regions, including Northern Ireland. Equalities analysis has been undertaken throughout the Review, considering the effects on people with protected characteristics.
1.4. Conclusions of the 2023 Review
The government wants to ensure that State Pension remains the foundation of income in retirement for future generations and that it is sustainable and fair.
The government has considered a wide range of evidence over the course of the Review. The government welcomes the findings from the Government Actuary and Baroness Neville-Rolfe and is particularly grateful for the range of responses to the Call for Evidence that informed Baroness Neville-Rolfe’s Independent Report.
In her Independent Report, Baroness Neville-Rolfe has highlighted key challenges in respect of life expectancy and fiscal sustainability of the State Pension and has sought to balance these considerations alongside government’s longstanding commitment to intergenerational fairness.
Having had regard to the relevant factors, the government agrees with the Independent Report conclusion that the increase to State Pension age from 66 to 67 is appropriate. This rise will take place between 2026-2028. This rise has been planned since 2014 and will give certainty to those closest to retirement. The Government Actuary’s report sets out that this rise is currently in line with a 31% Adult Life in Retirement (ALiR) metric. Baroness Neville-Rolfe noted that 31% ALiR is consistent with the average experience of those reaching the male State Pension age between 1996-2020.
The government notes the Independent Report’s recommendations on the rise from 67 to 68. However, Baroness Neville-Rolfe was not able to take into account the long-term impact of recent changes in the economy, the outlook for the labour market and the path for public finances. The UK economy has been hit by a series of significant shocks, including the COVID-19 pandemic and global energy crisis. These may lead to significant structural changes in the economy, particularly in the labour market, but comprehensive evidence on the long-term impacts of these shocks was not available by the time Baroness Neville-Rolfe completed her report. The Government Actuary also noted the challenges of assessing long-term mortality trends, particularly in the context of the COVID-19 pandemic.
This brings a level of uncertainty in relation to the longer-term data on life expectancy, labour markets and the public finances, which are key factors relevant to a consideration of the appropriateness of the rules on the State Pension age rise to 68 at this time. These factors are expanded on in Chapters 2, 3 and 4 of this report.
Given the wide-ranging impacts, it is important to take the time to get this right. The current rules for the rise to 68 therefore remain appropriate and the government does not intend to change the existing legislation prior to the conclusion of the next review. All options for the rise from 67 to 68 that meet the principle of 10 years notice will be in scope at the next review.
1.5 The next review
We plan to have a further review within two years of the next Parliament to consider age 68.
This will ensure that the government is able to consider the latest information which was not available to the independent reviewer and other relevant evidence. This is expected to include life expectancy and population projections updated with 2021 Census data, the latest demographic trends, the economic position, the impact on the labour market of our recently announced package of measures to tackle inactivity and any other relevant factors.
The government remains committed to the principle of 10 years notice of changes to State Pension age and will ensure that any legislation can be brought forward in a timely manner.
Chapter 2: Life expectancy and demographic evidence
This chapter covers trends in life expectancy, healthy life expectancy and the variation in life expectancy between and within regions across the UK.
2.1 Life expectancy
Life expectancy has risen rapidly over the past century. Breakthroughs in medical treatments and generally healthier lifestyles – through de-industrialisation, improved diets and decreasing prevalence of smoking – has helped accelerate life expectancy improvements[footnote 8]. Life expectancy at birth in the UK in 1951 was 76.1 for males and 80.7 for females. By 2020, this had risen to 87.3 for males and 90.2 for females[footnote 9].
The ONS 2020-based cohort life expectancy projections that inform this Review project that life expectancy will increase over time[footnote 10][footnote 11]. However, Chart 1 illustrates that the rate of improvement in life expectancy has slowed compared to previous projections, as projected improvements in mortality have not been fully realised. The 2014-based data that informed the 2017 Review projected that life expectancy at age 65 would reach 23.1 by 2020. The 2020-based data shows that life expectancy at age 65 was 20.9 by this point, 2.2 years lower than had been projected.
Chart 1: Unisex cohort life expectancy at age 65

Source: Office for National Statistics, UK cohort life expectancy data for males and females, weighted using ONS National population projections
Life expectancy projections are a main consideration in the Government Actuary report. The findings are detailed in section 4.1. The Government Actuary notes that “Predicting life expectancy trends in the future is even more difficult as there are unknown factors that could affect life expectancy in either direction with unknown magnitude.” The timetables for State Pension age rises that the Government Actuary produced are sensitive to changes in life expectancy projections.
Making a decision on the future of State Pension age early in the next Parliament will have the benefit of drawing from the latest UK-wide life expectancy data. Updated ONS cohort life expectancy projections, which will include updated 2021 Census information and an updated assessment of mortality trends since 2020, are provisionally due to be released in December 2023.
2.2 Healthy life expectancy
Healthy life expectancy predicts the average number of years that an individual is expected to live in a state of self-assessed good or very good health. It can show the general health of the population and how this has changed over time.
Healthy life expectancy at birth has seen little change over the past decade for both males and females[footnote 12]. However, healthy life expectancy at age 65 has increased for both males and females. Female healthy life expectancy has increased from 10.6 years to 11.2 years over the 2009-11 to 2018-20 period[footnote 13]. This improvement has outpaced the gains in overall life expectancy seen for this age group.
Chart 2 illustrates that females at age 65 can now expect to spend almost 54% of their remaining life in a good state of health, increasing from 51% in 2009-11. Males at age 65 have seen similar improvements, increasing from 54% to 56% over the same period. This trend is prevalent in each of the UK constituent countries[footnote 12].
ONS data releases in 2023 will provide more evidence on health trends and healthy lifespans. It will be important to keep this under review and monitor any emerging trends following the effects of COVID-19 and its aftermath.
Chart 2: Proportion of remaining life at age 65 spent in a good state of health, UK
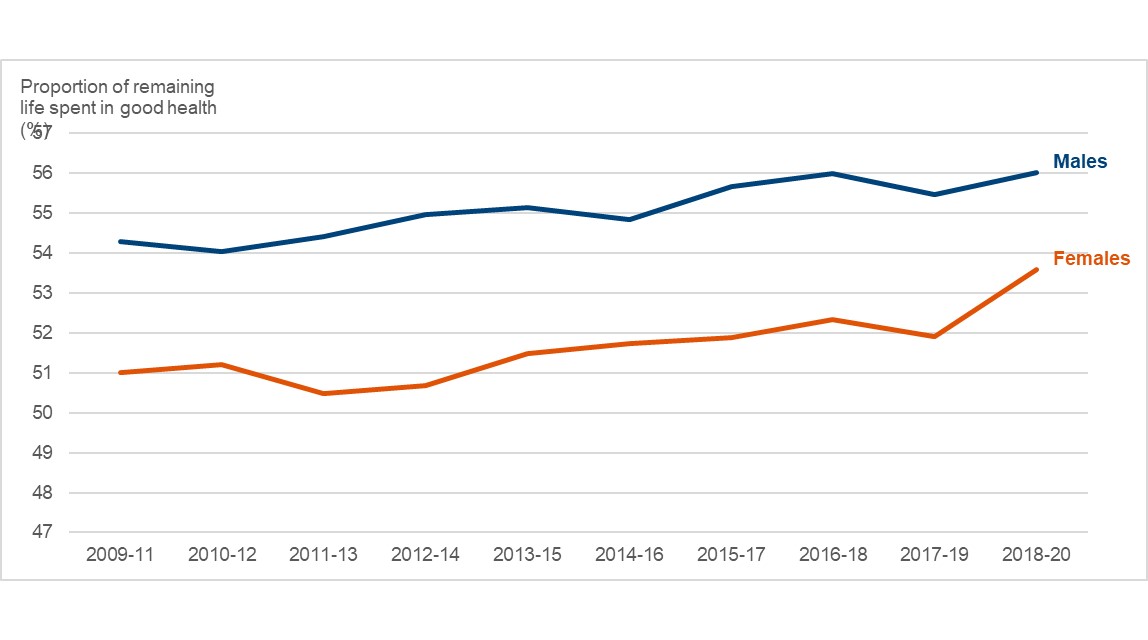
Source: Office for National Statistics, Healthy Life Expectancy data
2.3 Inequalities in life expectancy
Inequalities across the constituent countries
There is variation in life expectancy both between and within regions of the UK. Table 1 illustrates that males and females at birth can expect to live approximately 2 years longer in England than in Scotland, and over 1 year longer at age 65.
Table 1: Cohort life expectancy at birth and at age 65 for males and females in the UK and its constituent countries
| Country | Males at birth | Males at age 65 | Females at birth | Females at age 65 |
|---|---|---|---|---|
| England | 87.5 | 19.9 | 90.4 | 22.2 |
| Scotland | 85.5 | 18.6 | 88.5 | 20.7 |
| Wales | 86.5 | 19.2 | 89.6 | 21.6 |
| Northern Ireland | 86.7 | 19.4 | 89.8 | 21.7 |
| UK | 87.3 | 19.7 | 90.2 | 22.0 |
Source: Office for National Statistics, 2020-based cohort life expectancy by constituent country
Inequalities across regions
Life expectancy inequalities on a more localised scale use period life expectancy data[footnote 14]. Figure 1 shows that there remains an inter-regional variation in life expectancy across the UK and its regions[footnote 15]. Females at age 65 living in London can expect to live over 1 year longer than the UK average. Those in Scotland at age 65 can expect to live 1.2 years less than the UK average. The variation in life expectancy between regions has been relatively flat over time.
Figure 1: Female life expectancy at age 65, presented as difference from the UK average

Source: DWP’s calculations using ONS 2018-20 regional female period life expectancy data at age 65, presenting Scotland, Wales and Northern Ireland as regions
Inequalities across regions and local areas
Variations widen when considering the most extreme local area differences in the UK. There is over an 11-year gap between the local area with the highest (Westminster) and the lowest (Glasgow City) male life expectancy at birth. When considering healthy life expectancy, the gap is over 20 years for both males and females – each of these inequalities have widened by over a year since 2015-17[footnote 16].
Inequalities within regions and local areas
Life expectancy also varies between local areas within regions. Between local areas in Scotland, there is almost a 4-year gap in female life expectancy at age 65. Between local areas in the North-West of England there is over a 4-year gap in this measure.
Even more localised data from the Office for Health Improvement Disparities shows how areas within the same local authority can have vastly different life expectancies. The range in male life expectancy at birth across Blackpool, whose life expectancy as a local area is among the lowest in UK, is 13 years, with some areas in Blackpool having a life expectancy close to or above the England average[footnote 17].
Inequalities by deprivation
A key explanation for inter-regional and intra-regional life expectancy inequality is deprivation. Those in the least deprived areas have a life expectancy that is almost a decade longer than those in the most deprived areas. The additional years those in the least deprived areas can expect to live compared to those in the most deprived areas rises to over 16 years, when considering the extent to which their lives are healthy and free from disability.[footnote 18]
Updated ONS life expectancy releases expected over the course of 2023 will present a more up-to-date picture of how inequalities in life expectancy between and within regions are changing.
2.4 Population and the Old-Age Dependency Ratio
Life expectancy improvements mean that the pensioner population is projected to increase by over 5 million, rising from over 12 million today to over 17 million by 2070. The working-age population is projected to increase by just over 1 million over this same period, rising from 43 million today to 44 million by 2070.
Chart 3: Projected increase in working-age and pension-age population compared to 2022 levels
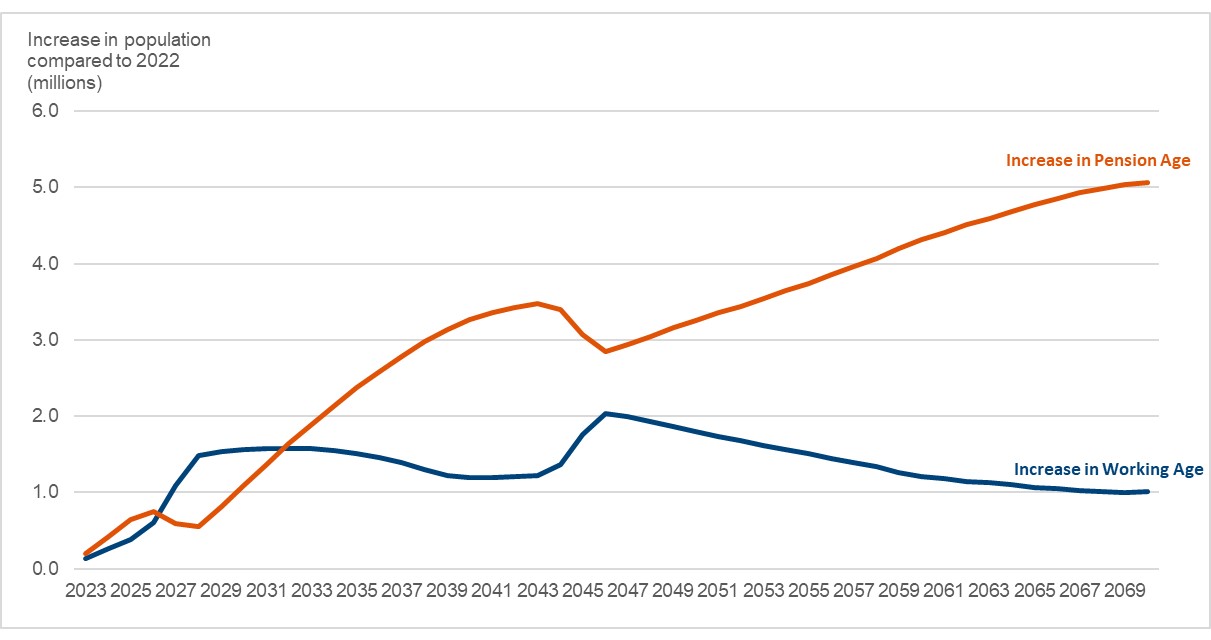
Source: DWP’s calculations using ONS 2020-based interim population projections, assuming the currently legislated pathway for State Pension age rises to 67 and 68.
The relative balance between the number of those who are working-age and those over State Pension age is commonly assessed using the old-age dependency ratio - the number of pensioners per 1,000 persons of working-age[footnote 19]. The old-age dependency ratio is an important metric in assessing the sustainability of the State Pension, which is expanded on in Chapter 3.
The combination of the working-age and old-age population trends in Chart 3 reflects an ageing population. This corresponds with a rising old-age dependency ratio, as shown in Chart 4. The old-age dependency ratio is currently estimated to be 280 as of 2020 and is projected to rise to 393 by 2070 under 2020-based projections reflecting past and continued improvements in life expectancy.
Chart 4: Projected old-age dependency ratio (OADR)
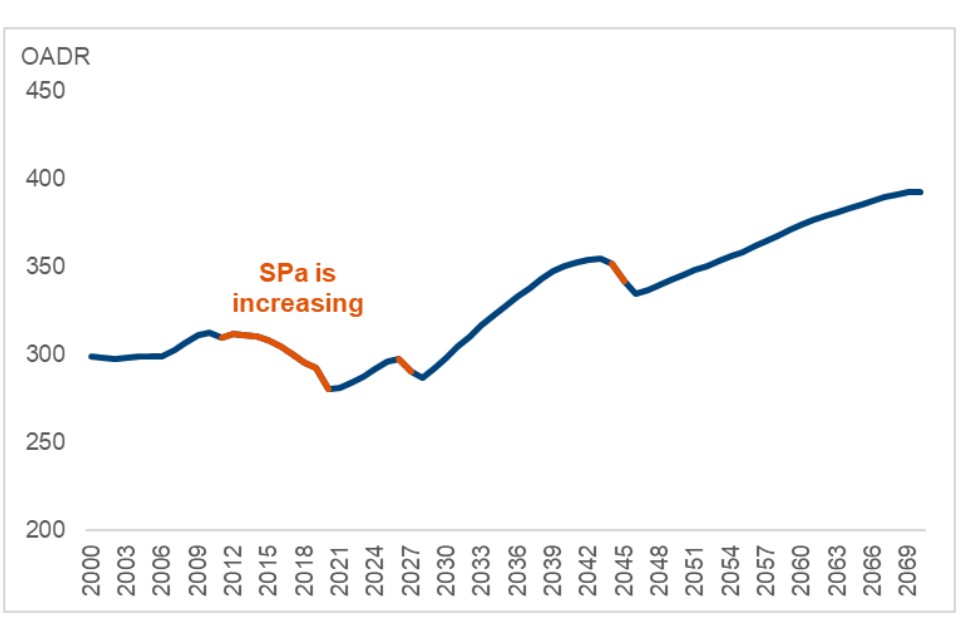
Source: DWP’s calculations using ONS 2020-based interim national population projections, assuming the currently legislated State Pension age rises to 67 and 68
The old-age dependency ratio is sensitive to the projections used in its inputs. It is predominantly driven by life expectancy, fertility rates and migration patterns.
The slowdowns in projected life expectancy improvements outlined in Chart 1 places downward pressure on the old-age dependency ratio. Compared to the 2014-based population projections, which informed the 2017 State Pension age Review, there are projected to be 1.9 million fewer pensioners by 2070.
Fertility rates have also decreased since the 2017 Review and are below replacement rate[footnote 20]. This places upwards pressure on the old-age dependency ratio. Compared to the 2014-based projections, there are projected to be 5.3 million fewer people of working-age by 2070.
Given the range of factors that impact the old-age dependency ratio, and the sensitivity of each as projections are updated, it is important to keep the drivers of the old-age dependency ratio under review. For example, the ONS have released updated 2020-based population projections based on migration trends observed between 2020 and 2022, resulting in an upward revision in net migration projections by almost 50,000 extra per year in the long term. This results in a lower old-age dependency ratio than the original 2020-based projections as the working-age population is now projected to be larger.[footnote 21] This demonstrates the sensitivities in projections and how drivers can change by large amounts in short periods of time.
Updated national population projections later in 2023 will allow for an updated assessment of demographic trends based on new Census data and updated mortality, fertility rate and migration assumptions.
2.5 The next review
Making decisions on the State Pension age based on factors such as life expectancy and demographic data is inherently sensitive to the projections used. This chapter has illustrated that long-term projections can change significantly in a relatively short period of time, and there is considerable variation across the UK. It has also shown how changes in life expectancy are not always mirrored by changes in healthy life expectancy, and the ratio of pensioners to the working-age population changes over time. It is important to consider the full range of life expectancy and demography data in making decisions on State Pension age and ensuring the latest data is used where possible so that the right decision can be made.
The upcoming release of updated ONS cohort life expectancy projections, which will include updated 2021 Census information and an updated assessment of mortality trends since 2020, could change life expectancy projections significantly. This will include an updated assessment of the long-term mortality impact of COVID-19 as well as wider effects trends. This could alter the projections for the old-age dependency ratio, which is an important metric of State Pension sustainability. Other ONS releases in 2023 will provide more evidence on local area life expectancy inequalities and demographic trends.
Making a decision on the future of State Pension age early in the next Parliament will have the benefit of drawing from the latest UK-wide life expectancy data and the latest projections of the old-age dependency ratio.
Chapter 3: Fiscal, economic and the labour market evidence
This chapter sets out the long-term projections of State Pension-related expenditure and the National Insurance Fund. This is set against the UK economic and labour market landscape.
3.1 Long term expenditure projections
The government is projected to spend around £117 billion on State Pension-related expenditure in 2022-23, supporting over 12 million pensioners[footnote 22]. This supports a crucial aim to provide the population with a financial foundation for a secure retirement.
3.1.1. OBR projections of State Pension-related expenditure
Several factors are projected to drive increases to State Pension-related expenditure over time. Demographic factors, such as the growing pensioner population, are outlined in Chapter 2. The design of the State Pension system, including the number of qualifying years required to build the full rate of the new State Pension, means that by 2040, over 80% of people reaching State Pension age will be entitled to the full amount.[footnote 23] The Office for Budget Responsibility (OBR) also assume that over the long-term, the value of the State Pension will rise faster than earnings.[footnote 24]
Table 2 shows that State Pension-related expenditure is projected to rise from 4.8% of GDP in 2021-22 to 8.1% of GDP by 2071-72. This is based on the assumption that the State Pension age rises to 67 between 2026 and 2028, to 68 between 2037 and 2039, and to 69 between 2071 and 2073.
Table 2: State Pension-related expenditure as a % of GDP, UK
| % of GDP | 2021-22 | 2031-32 | 2041-42 | 2051-52 | 2061-62 | 2071-72 |
|---|---|---|---|---|---|---|
| State Pension-related expenditure | 4.8 | 4.9 | 5.5 | 6.2 | 7.3 | 8.1 |
Source: OBR, Fiscal risks and sustainability report, July 2022,[footnote 25]
An ageing population has wider implications for the long-term outlook for the public finances. Table 3 illustrates that Health, Adult Social Care and State Pension spending as a share of GDP is projected to grow by over 10 percentage points over the 50- year projection period, with State Pension being the second largest age-related spending pressure.
Table 3: Health, Adult Social Care and State Pension expenditure as a % of GDP
| As a % of GDP | 2021-22 | 2031-32 | 2041-42 | 2051-52 | 2061-62 | 2071-72 |
|---|---|---|---|---|---|---|
| Health | 9.1 | 8.7 | 10.1 | 11.7 | 13.3 | 15 |
| Adult social care | 1.2 | 1.5 | 1.8 | 2 | 2.3 | 2.5 |
| State Pension-related expenditure | 4.8 | 4.9 | 5.5 | 6.2 | 7.3 | 8.1 |
| Total | 15.1 | 15.1 | 17.4 | 19.9 | 22.9 | 25.6 |
Source: OBR, Fiscal risks and sustainability report, July 2022
3.1.2. Quinquennial Review of the National Insurance Fund
Chapter 2 set out that the increasing pensioner population is one of the factors driving increases to the old-age dependency ratio projections. This trend is taking place internationally, with the Organisation for Economic Co-operation and Development (OECD) noting that all G20 countries are showing rises in the demographic old-age to working-age ratio projections[footnote 26] in the coming decades.[footnote 27]
The old-age dependency ratio is an important indicator of State Pension sustainability. The State Pension is funded on a ‘pay-as-you-go’ basis, which means that the working-age population must meet the cost of the State Pension in any given year. All else equal, a higher old-age dependency ratio means that a higher number of pensioners will be supported by a proportionally smaller working-age population.
The National Insurance Fund (NIF) holds National Insurance contributions (NICs), paid by employees, employers, and the self-employed, as well as voluntary contributions. As of 2021-22, around 80% of NICs receipts are paid into the NIF, and 20% are paid into the NHS. Receipts paid into the NIF are kept separate from all other revenue raised by national taxes and are used to pay contributory benefits, including the State Pension.
The Government Actuary’s Department (GAD) produce a report on a 5-yearly basis (“The Quinquennial Review”) on the status of the NIF and its future capacity to fund benefit payments. In its 2020 review[footnote 28], GAD forecast that the combination of the increasing value of the State Pensions and changing demographics in the UK would result in the NIF balance peaking in 2032-33, before decreasing steadily and exhausting in 2043-44.
The projection of the NIF is very sensitive to the assumptions used. The Quinquennial Review also includes variant scenarios for demographic, economic, labour market and policy assumptions. These estimated a range in NIF exhaustion dates ranging from 2036 to 2058, depending on the variant scenario.
GAD also produce a yearly up-rating report, which assesses the current balance of the NIF and projects a balance over the next 5 years. The most recent report[footnote 29] projected a peak in 2023-24 and decline thereafter.
Given the fluctuation seen between recent projections, and the sensitivity of the analysis to relatively small changes in assumptions, it will be important to keep this under review.
3.2 UK public finances
The Review has taken place against a backdrop of heightened global economic volatility.
The COVID-19 pandemic resulted in a contraction in output of 11.0% in 2020, the largest fall for 300 years. Global events, such as the war in Ukraine and supply chain pressures pushed consumer price index (CPI) inflation to 40-year highs as energy prices rose to record levels. Energy prices remain volatile, so the extent of the permanent impact remains uncertain.
In the near term, the economy and public finances have proved more resilient than expected in the Office for Budget Responsibility’s (OBR) November 2022 forecast. The OBR’s March 2023 forecast expects inflation to more than halve this year as utilities prices fall. The economy is forecast to avoid a recession in 2023. GDP will fall by 0.2% on an annual basis over 2023 but has been revised up by 1.2 percentage points compared to the OBR’s November forecast, the largest upward revision the OBR has made to growth between forecasts outside the pandemic period. The forecast for public sector net borrowing in 2022-23 is £24.7 billion lower, with both headline and underlying debt lower in every year of the forecast, relative to the OBR’s November 2022 projections.[footnote 30]
Without the decisions the government took at Autumn Statement 2022 on tax and spending, underlying debt would have been on an upward trajectory. In the OBR’s March forecast, headline debt is now expected to reach 100.6% of GDP in 2022-23, which is 1.2 percentage points lower than the OBR’s November 2022 forecast but remains 21.6 percentage points higher than the OBR forecast in November 2017, at the time of the last State Pension age Review.
In this context, it is important that the government continues to deliver on its priority to get debt falling. The government’s fiscal rules require underlying debt to fall by the fifth year of the rolling forecast period, and the deficit to be below 3% of GDP by the same year. The OBR forecast that the government is on track to meet both of these rules, with underlying debt falling in the target year (2027-28)[footnote 31]. The OBR highlight the ‘considerable uncertainty’ around their forecast.
Reducing the debt burden is central to making sure that the public finances are on a sustainable footing for future generations. The OBR’s 2022 fiscal risks and sustainability report projected public debt to reach 267% of GDP by 2071-72, absent further policy action. This is largely driven by the fiscal pressures resulting from an ageing population, with State Pension spending projected to be the second largest age-related spending pressure in the long run, as outlined in detail in Section 3.1.
Recent developments and uncertainty have significant consequences for the long-run outlook for the public finances. Decisions on the State Pension age should be made taking account of wider pressures and uncertainties around the fiscal outlook. A change in the State Pension age has direct implications for the level of State Pension spending and can have wider consequences on the public finances through changes to tax receipts, arising from impacts on the labour force, and debt interest spending (due to changes in the level of debt).
The State Pension age is therefore an important lever in ensuring the sustainability of the State Pension system and the public finances.
3.3 UK labour market
3.3.1 Labour market trends
It is important that people of all ages are encouraged to stay in and return to the labour market, as the period of working life increases.
The latest evidence suggests the employment rate begins to fall when people reach their mid-50s and then drops significantly after the age of 60. Around 70% of people aged 55-59 are in employment and this falls to under 60% of people by the age of 61. By the age of 65, just over 44% of men and around 35% of women are in work, despite not being entitled to claim their State Pension until the age of 66.
The government has evaluated the impact of the increase of State Pension age from 65 to 66, which took place between 2018 and 2020. In terms of employment, the evaluation shows that there was an increase in employment levels, with approximately 55,000 more 65-year-olds in work as people responded to the increase in working life. However, there were increases in the number of people experiencing poverty. The reduction to average household income resulted in the absolute income poverty rate increasing by approximately 13 percentage points compared to if the State Pension age had remained at age 65. Further detail is included in the Annex.
3.3.2 Older workers
While unemployment is at a near 50-year low, since the COVID-19 pandemic there has been a significant increase in the number of working-age people neither in or looking for work: economic inactivity has risen by 490,000 since the start of the COVID-19 pandemic. This has been concentrated among workers aged 50-64, whose economic inactivity rate has increased by 2 percentage points and account for 65% in the rise in working-age inactivity at 320,000[footnote 32].
The government believes that workers of all ages have a vital role to play in their place of work and the wider economy. Through the policies set out in the Spring Budget 2023[footnote 33], the government wants to encourage individuals to start, stay in and return to work, including for older workers. The government is introducing a new returnerships offer targeted at the over-50s and improving the Mid-life MOT offer through an enhanced digital tool.
The government is taking forward legislation that will give all employees the right to request flexible working from their first day of employment, alongside other changes to make flexible working more accessible[footnote 34], and introducing a new leave right specifically for unpaid carers.[footnote 35]
The government is also taking action to improve people’s lives by challenging health inequalities and by ensuring opportunity is spread more equally across the UK through levelling up communities. As part of the levelling up agenda, the government is providing billions of pounds of local growth funding to help ensure the benefits of economic growth are felt everywhere, not just in London and the South-East.
3.4 The next review
The government wants to ensure that the State Pension is sustainable, so that it remains the foundation of income in retirement for future generations.
The COVID-19 pandemic led to significant structural changes in the economy, most notably in the labour market. Comprehensive evidence on the impacts of structural changes was not available at the time of the Independent Report. To deal with the significant economic challenge of inactivity, the Spring Budget 2023 announced a comprehensive employment package, which includes measures that will help those over 50 to start or continue to participate in the labour market. The OBR note that measures at Spring Budget 2023, including those in the labour market, are forecast to raise potential output. However, there remains uncertainty.
The government is committed to monitoring delivery and evaluating the effectiveness of these interventions, to ensure efforts are focused on what works. To continue to build the evidence base on what works to improve labour market outcomes, the government is providing £37.5 million additional funding for pilots and evaluations over 2023-24 and 2024-25.
An early understanding of this evidence base will be important for the next review, both in terms of the number of active workers in the economy and what works to connect older people to the labour market.
Chapter 4: Other evidence
As required by the Pensions Act 2014, the Secretary of State must commission two independent reports to contribute to the evidence base: a report from the Government Actuary, and a report on other factors that the Secretary of State considers are relevant to the Review. This chapter summarises the evidence submitted by the two reports.
4.1 The Government Actuary report
The government commissioned the Government Actuary to produce a report that examined the latest life expectancy data and provide advice on:
-
Whether the rules about pensionable age mean that, on average, a person who reaches pensionable age within a specified period can be expected to spend a proportion of his or her adult life in retirement; and
-
If not, ways in which the rules might be changed with a view to achieving that result
The government commissioned the Government Actuary to consider the following specified proportions of adult life:
-
32% - to reflect the recommended long-term aim of up to 32% contained in the previous review of State Pension age;
-
31% - to show the impacts of a lower proportion of adult life spent in retirement; and
-
30% - to model a lower proportion of adult life spent in retirement.
The Government Actuary produced the following timetables in relation to the specified proportions of adult life:
Table 4: Summary State Pension age timetables under specified parameters and assumptions
| State Pension age Changes | Current legislation | 2017 Review Recommendation | 32% proportion of adult life in retirement | 31% proportion of adult life in retirement | 30% proportion of adult life in retirement |
|---|---|---|---|---|---|
| 66 to 67 | 2026-28 | 2026-28 | 2037-39 | 2026-28 | 2023-25** |
| 67 to 68 | 2044-46 | 2037-39 | 2053-55 | 2041-43 | 2030-32 |
| 68 to 69 | - | - | N/A* | 2058-60 | 2046-48 |
| 69 to 70 | - | - | N/A* | N/A* | 2062-64 |
* Increases would take place after the end of the specified projection period in 2070
** This increase was calculated to be required immediately, because the proportion is already over 30%. For the purposes of the Government Actuary’s report, it was assumed that the earliest it could take place in theory was from April 2023.
Box 4.1 GAD Report, 2022, Section 4 Life Expectancy Assumptions
“Predicting life expectancy trends in the future is even more difficult as there are unknown factors that could affect life expectancy in either direction with unknown magnitude. Furthermore, life expectancy between individuals and groups of the population with similar characteristics vary enormously due to a variety of reasons.
This is made all the more difficult at present as we emerge from the COVID-19 pandemic, which makes projecting future trends even more uncertain. It is important that this inherent uncertainty in future mortality rates is acknowledged when setting an SPa timetable with regard to life expectancy.”
In the sensitivity analysis, the Government Actuary noted that if the long-term mortality improvement rate assumed by ONS, which is currently 1.2% per annum at most ages, was changed by 0.2% per annum in either direction, the calculated State Pension age timetable for the increase from 67 to 68 on a 32% proportion could move by up to 10 years.
The Government Actuary outlined other considerations to allow for when considering State Pension age rises. This includes wider issues around the State Pension system such as sustainability, long-term affordability and fairness. He notes the illustrative timetables could control costs to some extent, but the long-term affordability of the State Pension is determined by other factors that should also be considered.
4.2 The Independent Report on other relevant factors
The government commissioned independent reviewer Baroness Neville-Rolfe to explore what metrics the government should take into account when considering how to set State Pension age. The government specified this report should consider:
-
Recent life expectancy trends
-
Whether it remains appropriate that people should expect to spend a fixed proportion of adult life in retirement
-
What metrics could take into account both the costs of the State Pension, and how these could be shared fairly between generations
-
What additional metrics might be appropriate
The terms of reference specified that the report should have regard to State Pension’s long-term sustainability and affordability, and the views of organisations, individuals, and other interested parties. As part of her review, Baroness Neville-Rolfe undertook a Call for Evidence, which received 228 responses in total. Baroness Neville-Rolfe also commissioned research into international approaches to setting State Pension age.
4.2.1 Metrics
The Independent Report included recommendations around metrics that could be used for setting State Pension age, and what this would mean for future State Pension age rules. This included suggesting that one single metric could not balance all the considerations needed to ensure fairness while addressing the challenges around an ageing society.
Box 4.2 Independent Report, 2022, recommendations on metrics
-
That it remains right for there to be a fixed proportion of adult life people should expect to spend, on average, in receipt of State Pension and that the proportion of adult life metric is still fit for purpose
-
Reflecting the average experience of those reaching the male State Pension age between 1996-2020, that this proportion should be set at up to 31% of adult life
-
That the government sets a limit on State Pension-related expenditure of up to 6% of GDP (this could be met through changes to State Pension age, eligibility rules or uprating).
Box 4.3 Independent Report, 2022, conclusions on the timetable
-
The legislated rise in State Pension age to 67 should continue as planned between 2026 and 2028
-
The State Pension age should rise to age 68 between 2041 and 2043
The Independent Report highlighted that current expenditure projections suggest that the State Pension age should rise to 69 between 2046 and 2048, assuming the government accepted the ‘up to 6 per cent of GDP’ recommendation and met this requirement via State Pension age rises. The Independent Report stated that this should be reassessed at the next State Pension age Review.
The Independent Report noted some of the key strengths of these metrics. Linking State Pension age to adult life in retirement promotes fairness, by ensuring individuals’ experience in retirement is consistent across generations. Setting a limit on the percentage of GDP spent on State Pension ensures a consistent share of economic output is directed to this spending. This metric therefore considers overall cost in a way that is not reflected by the percentage of adult life in retirement metric.
However, the report also set out some key limitations of these metrics. Chapter 2 illustrates that life expectancy data is subject to revision and Box 4.1 notes the uncertainty around the pandemic’s long-term impact on mortality data. The Independent Report noted the sensitivity of life expectancy data as a key limitation of the adult life in retirement metric.
Regarding the ‘up to 6 per cent of GDP’ recommendation, the Independent Report flagged the uncertainty around forecasts of both the overall economy’s size, and the cost of State Pension spending, over the long term. Chapter 3 outlines why these assumptions may be particularly uncertain at the current time, given recent global economic and fiscal shocks. The report also noted such a cap, if met through State Pension age rises, could lead to a number of fast rises in State Pension age, disproportionately impacting those with lower life expectancies. These impacts should be considered more fully.
4.2.2 Other areas
The Independent Report also explored other areas, such as support for older workers, early access to State Pension and improving awareness and communications.
Box 4.4 Independent Report, 2022, recommendation on support for older workers
- That the government trial a scheme where businesses, large and small, are accredited as displaying best practice with a public commitment to supporting and respecting older workers and ensuring access to workplace adjustments and training and development opportunities
Box 4.5 Independent Report, 2022, recommendation on early access to State Pension
- That the government explores the possibility of an early access scheme whereby workers who meet certain qualifying criteria can access their State Pension early at an actuarially reduced rate. This could include individuals aged, say, 65 and above and with 45 years of National Insurance contributions or equivalent and should aim to help those who have performed physically demanding roles over many years
Box 4.6 Independent Report, 2022, recommendations on improving awareness and communications
-
That the government should communicate their State Pension age at least 10 years in advance of them reaching this age. This should be by letter, or another method to be agreed with individuals
-
For those already within 10 years of their State Pension age, issue such notifications as soon as is practicable
-
Monitor State Pension age and financial awareness regularly, a minimum of every two years, particularly amongst vulnerable groups and young people to support improvements and feed into ongoing communications and education activity
The government sees the merit in an accreditation scheme and will monitor progress of the recently launched “Inclusive Employer Pledge” which encourages age inclusion.
It is also mindful that a universal State Pension age has many benefits including giving a clear signal to those planning for retirement, and many (including Baroness Neville-Rolfe and the previous independent reviewer John Cridland) have set out the difficulty of an alternative to this. We will continue to keep the position of those unable to work as they approach State Pension age under review.
The government agrees that clear information around State Pension age is important and is committed to communicating planned and future changes effectively. There has been extensive activity on this already, including multi-channel campaigns raising awareness of State Pension age alongside other pension reforms, and sending letters to all those who will reach State Pension age between 2026 and 2028.
4.3. The next review
The government welcomes the findings from the Government Actuary and Baroness Neville-Rolfe’s Independent Report.
The Government Actuary has produced comprehensive analysis, demonstrating the challenges of assessing long-term mortality trends, particularly in the context of the COVID-19 pandemic.
Baroness Neville-Rolfe has highlighted key challenges in respect of life expectancy and fiscal sustainability of the State Pension and has sought to balance these considerations alongside government’s longstanding ambition of delivering intergenerational fairness.
The government is grateful to Baroness Neville-Rolfe for undertaking her report, and for producing thoughtful and well-evidenced recommendations on metrics, which has supported considerations in this Review. The recommendations seek to ensure that the State Pension remains fair and sustainable, and the government recognises that as well as life expectancy, there is a critical need to consider other factors such as the fiscal impact and intergenerational fairness when making future decisions on State Pension age. Due to the uncertainty in different factors outlined over this report, the government will not be adopting the report’s recommendations at this time but will ensure it takes them into account ahead of making a decision on future State Pension age policy. This will ensure that the government is able to consider the latest information which was not available to the Independent Report.
Annex: Evaluation of the increase in State Pension age to age 66
In 2017, the government committed to assess the impacts of the rise in State Pension age from 65 to 66 to inform this Review. This Annex summarises the findings of this evaluation.
Methodology
The State Pension age for both males and females increased from 65 to 66 between December 2018 and October 2020. Over this period, an increasing number of 65-year-olds became under, rather than over, the State Pension age. This evaluation considers how this impacted the employment rates, household incomes and income poverty levels of those who became of working-age following the reform[footnote 36].
The evaluation uses a methodology consistent with established State Pension age research. The approach quantifies how different outcomes (employment, household income and poverty) changed for people due to the increase in their State Pension age[footnote 37].
Headline findings
The evaluation found that increasing State Pension age to age 66 directly increased the employment rate of 65-year-olds by 8.0 percentage points for females and by 6.8 percentage points for males. This resulted in approximately 55,000 more 65-year-olds in employment than if State Pension age did not change. These findings show that this was mostly driven by people remaining in full-time work.
-
These are average effects across all 65-year-olds. Single females, those who were renting their own home and those with low/no formal qualifications were most likely to remain in employment as their State Pension age rose to age 66.
-
This contrasts with degree holders, members of a couple and those who owned their home outright who were less likely to remain in work as their State Pension age rose. Many of these people were already outside the labour market by this point. Of those who were still working at age 65, many are estimated to have worked beyond State Pension age anyway.
The evaluation also found that increasing State Pension age to age 66 resulted in an average reduction in net weekly household income of £83 for 65-year-olds compared to what it would have been if the State Pension age had not risen[footnote 38]. This net income figure comes from a £120 average reduction in weekly benefit income, including the State Pension, as well as the corresponding increase in working-age benefit income for those who claimed working-age benefits as their State Pension age increased. Incomes were also decreased further by approximately £15 per week as many of those who remained in work also delayed receipt of occupational pension income.
An average increase of £52 per week in employment income offset these income losses to some degree as 65-year-olds in employment, who otherwise wouldn’t have been, replaced the State Pension income they would otherwise have received[footnote 39]. As average additional employment income was less than the average reduction in benefit, occupational pension and investment income, the net effect of State Pension age 66 was an income loss at the household level compared to what levels would have been had the State Pension age not increased.
The reduction to average household income resulted in the absolute income poverty rate increasing by approximately 13 percentage points compared to if the State Pension age had remained at age 65[footnote 40][footnote 41].
-
This is an average impact across all impacted households. Some groups were impacted more than others. For example, single people, those with low/no qualifications and renters all experienced greater than average increases of between 17-25 percentage points compared to the average of 13 percentage points.
-
In contrast, those owning their home outright and those with higher levels of education experienced lower than average effects, with an impact of between 9-12 percentage points.
-
Increases in income poverty among certain sub-groups are also driven by wider factors beyond State Pension age directly such as single people being unable to benefit from shared housing costs and renters still facing high housing costs.[footnote 42] Single people, renters and those with low/no qualifications were also likely poorer to begin with making any income losses more pronounced compared to the counterfactual where eligibility to the State Pension was maintained.
-
Evaluations of previous State Pension age rises have suggested that some of the gains in employment were longer lasting and that the impacts on income poverty were mostly temporary as affected people were lifted out of poverty once their new State Pension age was reached[footnote 43]. A review early in the next Parliament will allow further analysis into whether impacts were temporary or longer lasting as the State Pension age rose to age 66.
-
Life tables, principal projection, UK - Office for National Statistics (ons.gov.uk) ↩
-
DWP’s calculations to make unisex life expectancy using ONS cohort life expectancy and national interim population projections data. ↩
-
Births in England and Wales - Office for National Statistics (ons.gov.uk) ↩
-
DWP’s calculations using ONS national 2020-based interim population projections ↩
-
Fiscal risks and sustainability – CP 702 (obr.uk) ↩
-
The Pensions Commission (2005) A New Pension Settlement for the Twenty-First Century: The Second Report of the Pensions Commission. Available at: http://webarchive.nationalarchives.gov.uk/+/http:/www.dwp.gov.uk/publications/dwp/2005/pensions commreport/main-report.pdf ↩
-
Command 8528 (January 2013) ↩
-
How has life expectancy changed over time? - Office for National Statistics (ons.gov.uk) ↩
-
Life tables, principal projection, UK - Office for National Statistics (ons.gov.uk) ↩
-
Past and projected period and cohort life tables - Office for National Statistics (ons.gov.uk) ↩
-
This chapter makes reference to both cohort and period life expectancy. State Pension age timetables are set using cohort life expectancy. This measure uses projections which assume mortality rates will improve in the future. Period life expectancy uses observed mortality rates from a single year (or group of years) and assume that those rates apply throughout the remainder of a person’s life. This means that any future changes to mortality rates are not considered. This is less plausible, but period life expectancy is useful for comparisons in life expectancy and mortality rates across areas and characteristics. ↩
-
Health state life expectancies, UK - Office for National Statistics (ons.gov.uk) ↩ ↩2
-
2018-20 health state life expectancy data include mortality and health state prevalence data collected in 2020 during the coronavirus (COVID-19) pandemic. ↩
-
National life tables – life expectancy in the UK – Office for National Statistics (ons.gov.uk) ↩
-
Wales, Scotland and Northern Ireland are presented on a period life expectancy basis as regions for the purposes of the analysis informing Figure 1. ↩
-
2015-17 selected as this is the latest non-overlapping time period to which the 2018-20 data can be compared. ↩
-
Local Authority Health Profiles - Data - OHID (phe.org.uk) ↩
-
Health state life expectancies by national deprivation deciles, England - Office for National Statistics (ons.gov.uk) ↩
-
Subnational ageing tool - Office for National Statistics (ons.gov.uk) ↩
-
Births in England and Wales - Office for National Statistics (ons.gov.uk) ↩
-
2020-based interim national population projections: year ending June 2022 estimated international migration variant - Office for National Statistics ↩
-
State Pension-related expenditure includes many items in addition to the basic and new State Pension and single-tier pension, such as pension credit, winter fuel payments and the Christmas bonus. It does not include pensioner housing benefit or pensioner disability benefits. ↩
-
New State Pension: impact on an individual’s pension entitlement – longer term effects - GOV.UK (www.gov.uk) ↩
-
The Triple Lock is a manifesto commitment which lasts until the end of this Parliament. The legislative requirement for uprating the basic and new State Pensions is at least an annual rise in line with average earnings growth. However, OBR forecasts include future uprating in line with the Triple Lock. ↩
-
The OBR’s fiscal risks and sustainability report 2022 used different ‘bespoke’ population projections. These projections assumed a lower net migration level in the long term which implied slower population growth and a higher old-age dependency ratio. ↩
-
The OECD define the demographic old-age to working-age ratio as the number of individuals aged 65 and over per 100 people of working age defined as those at ages 20 to 64. This is slightly different to Old Age Dependency Ratio (OADR) as used throughout this document, which is number of individuals over any given UK State Pension age per 1,000 individuals under. ↩
-
Demography - Old-age dependency ratio - OECD Data ↩
-
Government Actuary’s Quinquennial Review of the National Insurance Fund as at April 2020 - GOV.UK (www.gov.uk) ↩
-
Report to Parliament on the 2023 re-rating and up-rating orders - GOV.UK (www.gov.uk) ↩
-
‘Headline debt’ refers to public sector net debt. ‘Underlying debt’ refers to public sector net debt excluding the Bank of England. ↩
-
Office for Budget Responsibility, Economic and Fiscal Outlook, March 2023 ↩
-
Calculations based on LFS summary of labour market statistics. ↩
-
Print_Budget_2023.pdf (publishing.service.gov.uk) ↩
-
The evaluation looking at employment responses uses data from the Labour Force Survey. The evaluation looking at household incomes and income poverty levels uses data from the Family Resources Survey and the Households Below Average Income dataset. ↩
-
The evaluation adopts a ‘difference-in-differences’ regression methodology which allows for a comparison between the increasing number of 65-year-olds who became under, rather than over, the State Pension age (the treatment group, affected by the State Pension age change) with 66- and 67-year-olds who were always over the State Pension age (the control group, unaffected by the State Pension age change). The model controls for age and time as well as characteristics such as education, partner status, tenure status, ethnicity and relationship status. ↩
-
All £ figures presented in 20-21 prices. Figures in this evaluation are expressed in unequivalised terms. ↩
-
The additional employment income of £52 per week at the household level is an average of all 65-year-olds affected, including those whose employment earnings are zero. As less than 10% of 65-year-olds responded to the increase in State Pension age to age 66 by working longer whereas over 95% lost out on State Pension income they would otherwise have received, the net effect is an income loss compared to the counterfactual. This means that many of those earning positive employment income would have been likely to see income gains rather than income losses as the State Pension age rose to 66 as average employment earnings exceed the average State Pension amount. ↩
-
The evaluation uses the absolute income poverty definition of having a household income that is 60% below the 2010/11 median UK household level after accounting for inflation. ↩
-
Presented on an after-housing costs basis as this is the most relevant measure when analysing 65-year-olds given the high rates of home-ownership and owner occupiers. ↩
-
R211-How-did-increasing-the-state-pension-age-affect-household-incomes.pdf (ifs.org.uk) ↩
-
https://ifs.org.uk/sites/default/files/output_url_files/WP201710.pdf ↩