Chapter 6: A changing job mix over time: census insights
Published 29 October 2026

© Crown copyright 2026
This publication is licensed under the terms of the Open Government Licence v3.0 except where otherwise stated. To view this licence, visit nationalarchives.gov.uk/doc/open-government-licence/version/3 or write to the Information Policy Team, The National Archives, Kew, London TW9 4DU, or email: psi@nationalarchives.gov.uk.
Where we have identified any third party copyright information you will need to obtain permission from the copyright holders concerned.
This publication is available at https://www.gov.uk/government/publications/state-of-the-nation-2026-whos-getting-ahead/chapter-6-a-changing-job-mix-over-time-census-insights
Highlights
The results of the 2021 to 2022 Censuses have allowed us to track shifts in occupation types across the UK with better accuracy, using data from the 2001, 2011 and 2021 to 2022 Censuses.[footnote 1] This improves on our previous approach of using data from the Labour Force Survey (LFS), because the census provides a longer time series, larger sample size and better comparability across nations, including Northern Ireland.
Over the last 20 years, the UK has seen a big rise in higher professional jobs and a drop in higher working-class jobs. However, these new professional opportunities are very unevenly spread across the country.
While the list of places with the most and least professional jobs has not changed much since 2001, the gap between them is stark. For instance, Leeds has roughly one professional job for every working-class resident. In Hull, there is only half a professional job for every working-class resident.
There have been some changes over time within England. For example, Leeds and Bristol enjoyed notable increases in their professional classes, whereas cities like Birmingham, Middlesbrough and Kingston upon Hull saw minimal growth.
The Greater London Authority stood out, as the growth of its higher professional class was fully matched by a decline in its lower professional class.
These shifts in occupational class size will probably impact local social mobility and a region’s ability to attract migrants. So upward mobility chances are expected to be better than average in cities like Leeds and Bristol, making them attractive destinations for people relocating from other parts of the country. But moving for work may be less of a choice and more of a necessity for those born in certain areas who wish to be upwardly mobile.
In Northern Ireland, Scotland and Wales, local authority (LA) trends were largely stable. For example, Cardiff and Blaenau Gwent kept their positions as areas with the largest professional and working classes in Wales.
Finally, between the 2001 and 2021 to 2022 Censuses, England, Scotland and Wales shared common occupational shifts: the higher professional class grew substantially, while the higher working class saw an even larger decline.[footnote 2] Meanwhile, the lower professional class shrank slightly, alongside small increases in the intermediate and lower working classes. Northern Ireland was the exception, experiencing the largest increase in its higher professional class and a unique decline in its lower working class. By 2021, Northern Ireland had largely caught up with the class profile for Wales.
Introduction
In last year’s State of the Nation report, we used the LFS data to show how labour market opportunities vary between LAs in Great Britain (while Northern Ireland had to be treated as a single unit).[footnote 3][footnote 4] Because of the small sample sizes for some LAs, we constructed composite indices using multiple indicators. These composite indices were relative measures because they showed how favourable or unfavourable each LA’s position was compared with the others.
However, with the release of the 2021 to 2022 Census results, we have much more precise data. It is now possible to measure occupational structures directly across the entire UK, including Northern Ireland, without relying on composite indices. This allows for a detailed analysis of changes over time by comparing the 2001 and 2011 Censuses with the 2021 to 2022 Census data.
The national data from the LFS in previous State of the Nation reports showed that there have been long-term changes in the mix of job types, with the professional and managerial classes expanding and the working classes declining in size. In figure 6.1, we repeat this analysis, showing the trends separately for England, Wales, Scotland and Northern Ireland.
Using the census instead of survey data
Until this year, our annual reports have relied mainly on the Labour Force Survey (LFS), which is the UK’s official survey of its labour market, and on other surveys. The LFS allowed us to look at changes in the drivers, or enablers, of mobility over a long period, going back to the year 2000.
The LFS gives us very good estimates of things like occupational class for the UK as a whole, because it has a large sample size and is designed to be comparable over time. However, if we divide the UK up into small geographical areas, the sample size for each area is too small to generate reliable estimates. This creates a risk that differences between areas for a specific measure are a result of random sampling errors (differences that happen by chance as part of the sampling process).
To reduce this risk, we summarised findings across multiple indicators that seem to be related, creating composite indices (see chapter 1). When they all give a similar picture, we can confidently say that there are real differences between the areas. But this is a composite picture, not a comparison of areas on one specific indicator of interest.
Now that the 2021 to 2022 Census results are available, we have much larger numbers in each area, so there is no need to look at a composite picture. We can look at individual indicators, like youth employment, and compare them across areas of the UK with much more confidence.
Throughout, we assign people to areas based on their place of residence, not their place of work. However, this can give rise to misleading results when a large number of people travel across LA boundaries to work.
One important thing to note is that the Office for National Statistics (ONS) revises its occupational categories at each census to reflect emerging occupations, such as those in the tech sector. As a result, some overall changes may stem from these structural revisions rather than real shifts in the economy. However, this should not affect comparisons between LAs, because the classifications apply equally across all parts of the country.
UK-wide results
For this analysis, we use our standard 5-class grouping of occupational classes based on the National Statistics Socio-economic Classification (NS-SEC): higher professional class, lower professional class, intermediate classes, higher working class and lower working class. The long-term unemployed and those who have never worked are intentionally excluded from the lower working class due to inconsistencies in publicly available data over time.[footnote 5] The way we group occupations into classes is explained in chapter 1. Occupational class is based on employment relations and conditions of occupations, not on salary. Sometimes, people in lower occupational classes earn more than those in higher occupational classes. For example, a plumber may earn more than a speech therapist.
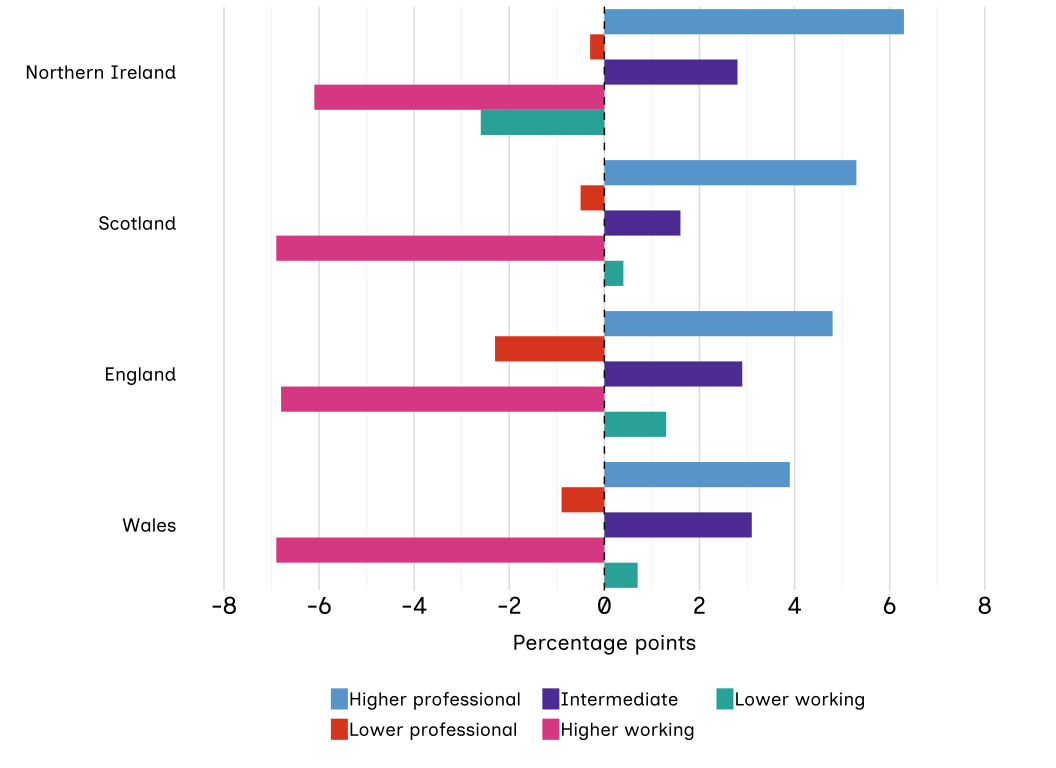
Figure 6.1: England, Scotland, Wales and Northern Ireland have all seen the higher professional class grow and the higher working class shrink.
Change in size of the occupational classes (in percentage points) between 2001 and the 2021 to 2022 Census years across England, Wales, Scotland and Northern Ireland (population aged 25 to 64 years).
Source: Office for National Statistics (ONS), National Records of Scotland (NRS), and Northern Ireland Statistics and Research Agency (NISRA), Census 2001, 2011, and 2021 to 2022.
Note: Data covers the population aged 25 to 64 years. The most recent census wave was conducted in 2022 in Scotland and in 2021 in England, Wales, and Northern Ireland. Figures reflect a harmonised 5-group NS-SEC classification; the long-term unemployed and those who have never worked are intentionally excluded to ensure consistency over time.
Over the 2 decades, England, Scotland, and Wales exhibited common evolutionary patterns: the higher professional class grew substantially, while the higher working class experienced an even larger percentage-point decline. In these 3 nations, there was also a small decline in the size of the lower professional class, a slight increase in the lower-working class, and a somewhat larger increase in the intermediate class. These shifts represent a continuation of the long-term decline of manufacturing in the UK, mirroring many western European nations, and the corresponding rise of a post-industrial, knowledge-intensive economy.
Northern Ireland was exceptional in that it showed the largest percentage-point increase in the size of the higher professional class, and the smallest decline in the higher working class. As a result, Northern Ireland had largely caught up with Wales by 2021 in its class profile.[footnote 6] The explanation for the exceptional progress since 2001 in Northern Ireland might well be related to the end of the troubles and the implementation of the Good Friday Agreement.[footnote 7]
Across the 2001, 2011, and 2021 to 2022 Censuses, England consistently had the largest higher professional and lower professional classes, alongside the smallest higher and lower working classes. By contrast, Northern Ireland historically had the smallest professional classes and the largest lower working class.[footnote 8]
Local patterns of employment across the UK
We can think about patterns of employment opportunity across UK LAs in 2 ways. Firstly, where is there the greatest number of higher professional jobs? And secondly, how has this changed over time and are there any LAs that have outperformed expectations?
The first map, figure 6.2, answers the first question. Here, we see that higher professional jobs tend to gather around large cities and urban areas across the country such as London, Edinburgh, Oxford, Cambridge and Bristol. In contrast, many rural areas and coastal towns such as Blackpool, Stoke-on-Trent, Kingston upon Hull and Blaenau Gwent appear to have lower numbers of these roles. This pattern suggests that the local economic structure shapes opportunities, rather than a simple north-south divide.
Figure 6.2: Professional jobs tend to gather in cities and large urban areas.
Percentage of higher professional jobs in each local authority (LA) in the UK, measured as the percentage of its population in higher professional employment as of the 2021 to 2022 Census (population aged 25 to 64 years).

Source: ONS, Census 2021.
Note: Data covers the population aged 25 to 64 years. The most recent Census wave was conducted in 2022 in Scotland and in 2021 in England, Wales and Northern Ireland.
The map shows a snapshot of which LAs have the greatest amount of higher professional employment. But we would also like to know where opportunity has been improving the most. Figure 6.1 shows the national trend of increasing higher professional employment over the last 20 years, but are there any LAs that have increased more than expected, given their starting point? Figure 6.3 answers this. It shows each LA’s starting point in the 2001 Census and highlights those that have increased their share of higher professional employment more – or less – than average.[footnote 9] We refer to this difference from the national trend as a ‘residual’.
Figure 6.3: Higher professional jobs have grown faster than expected in the west and north but slowed in traditional southern hubs.
The difference from the national trend, or ‘residual’, in higher professional employment for each LA in the 2021 to 2022 census, given its starting point in 2001.

Source: ONS, NRS, and NISRA, Census 2001 and 2021 to 2022.
Note: Data covers the population aged 25 to 64 years. The most recent census wave was conducted in 2022 in Scotland and in 2021 in England, Wales and Northern Ireland.
The map shows a clear geographic split, different from that in figure 6.2. Many rural and coastal regions in the west and north of the UK grew faster than anticipated, while several major cities and traditionally affluent areas in the south and east fell behind. This higher-than-expected growth is particularly widespread in Northern Ireland, where every local district ranks in the top 20% of performers. Other outlying areas also beat expectations, including Cornwall, Cumbria, the Scottish Highlands and the Western Isles. In contrast, growth fell short in major urban hubs like Birmingham and the surrounding West Midlands, as well as Aberdeen City, which underperformed compared to its neighbouring areas. Large parts of the South East and the Home Counties, such as Hampshire and West Sussex, also saw slower growth than predicted. Finally, a sharp contrast is visible within the capital, where east and south-east London significantly beat growth expectations, while west and north-west London fell behind them.
In figures 6.4 to 6.7, we look in more detail at changes within the 4 nations, comparing a range of LAs. As well as changes in the sizes of the occupational classes over time, we also show how far each LA change differs from the national trend.
Northern Ireland
We start with Northern Ireland. Here, local government consists of 11 single-tier districts known as local government districts.[footnote 10] Councils do not have the same range of functions as those in the rest of the UK. For example, they do not have direct responsibility for education or housing. Their main functions are planning, waste and recycling services, leisure and community services, building control and local economic and cultural development.
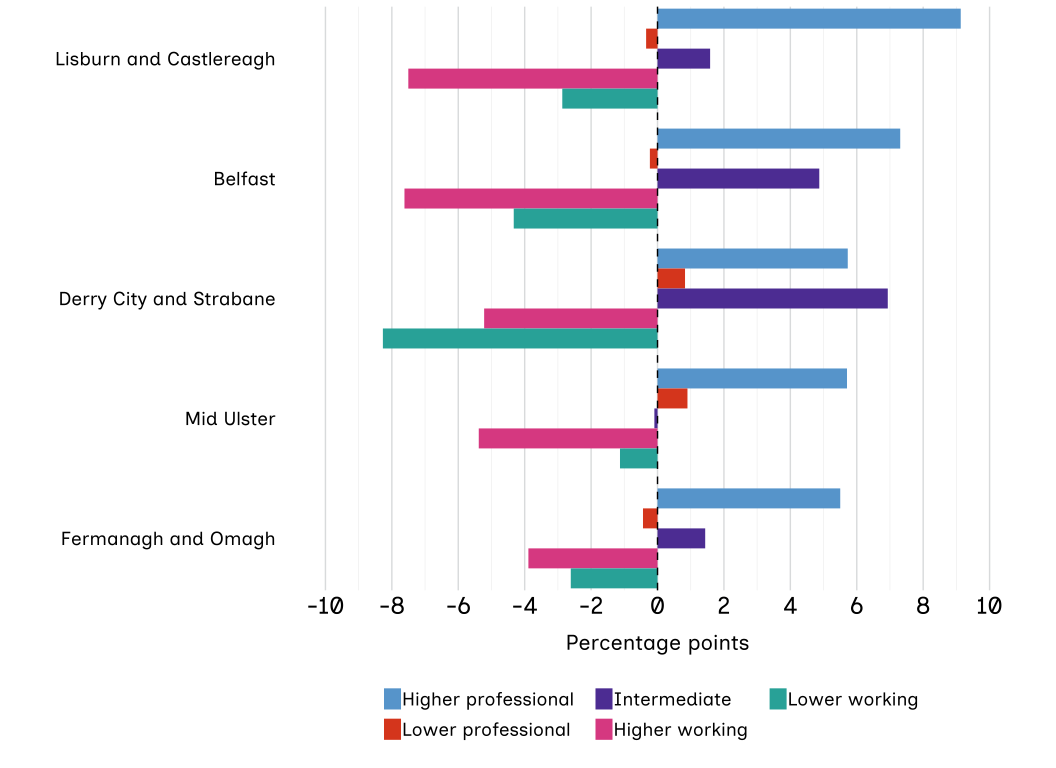
Across these districts, there was a shared pattern of greater-than-expected increases in the higher professional class. For example, in Lisburn & Castlereagh, the share of residents in the higher professional class grew by 9.1 percentage points, while in Belfast, the capital, it increased by 7.4 points. At the same time, the lower working class declined across the board, including an 8.3-point fall in Derry City and Strabane.
Figure 6.4: Districts in Northern Ireland share a pattern of larger increases in the size of the higher professional class than in the UK as a whole.
Percentage point change from 2001 to 2021 in the size of the 5 social classes, selected districts in Northern Ireland, census data.
Source: NISRA, Census 2001, 2011, and 2021.
Note: Data covers the population aged 25 to 64 years. Figures reflect a harmonised 5-group NS-SEC classification; the long-term unemployed and those who have never worked are intentionally excluded to ensure consistency over time.
The pattern of large positive residuals for the higher professional class and large negative residuals for the lower working classes was very similar for the other district councils, suggesting that these changes were broadly shared. If this interpretation is correct, we should find that the Northern Irish districts have improved their percentile – their relative positions – within the UK too.
Scotland
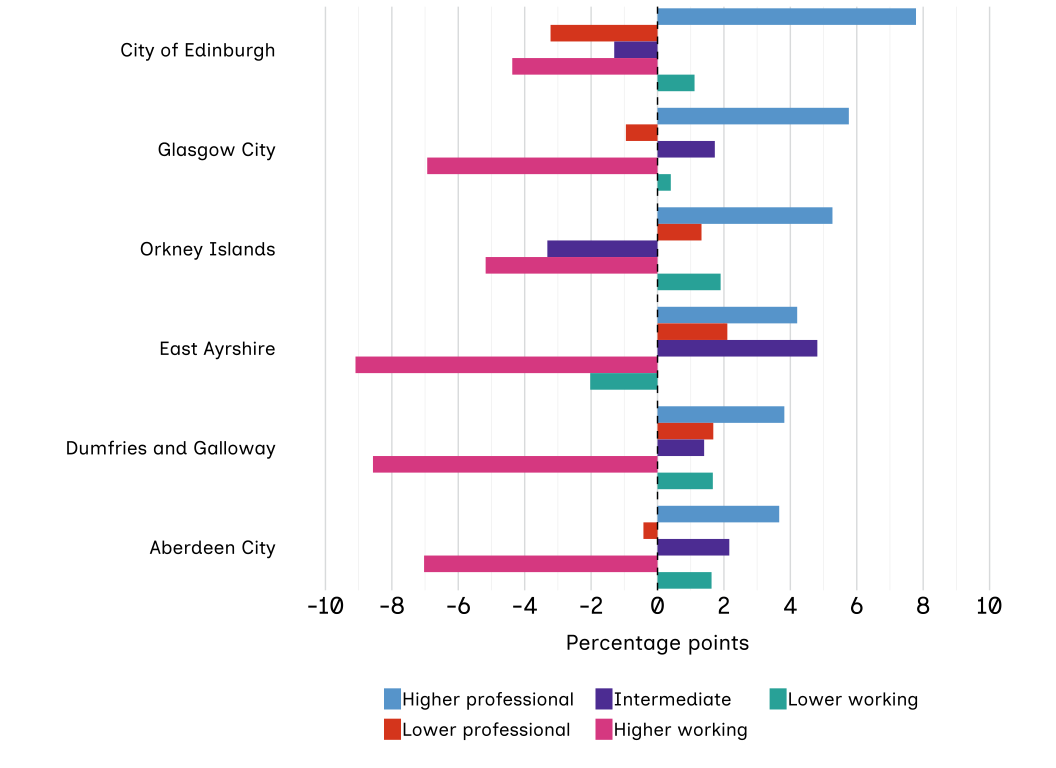
In Scotland, the capital city of Edinburgh had a substantially larger proportion of professional jobs and a smaller proportion of working-class jobs than Glasgow in 2001. By 2022, Edinburgh saw its higher professional-class residents grow by an impressive 7.8 percentage points, while its higher working class declined by 4.4 points. Glasgow’s occupational structure closely tracked overall Scottish trends, reflecting its relatively large size, with its higher professional class growing by 5.8 points and its higher working class declining by 6.9 points.
There was a general tendency across Scottish council areas for the higher professional class to grow slightly more than expected based on UK-wide trends. However, Aberdeen City was a notable exception to this growth pattern. Despite starting with a relatively large higher-professional class in 2001, likely due to its status as the UK base for the North Sea oil industry, its growth of 3.7 percentage points was smaller than anticipated. This slower pace of growth may reflect the declining economic importance of the North Sea oil sector over this period.
Interestingly, rural and formerly industrial districts like East Ayrshire, the Orkney Islands and Dumfries & Galloway go against the national trend by experiencing growth in both their higher and lower-professional classes. This suggests that their occupational structures might be converging with the broader average rather than falling further behind.
Figure 6.5: Trends have been similar across Scottish council areas but the overall increase in the size of the professional classes (higher and lower) was smallest in Aberdeen City and largest in the Orkney Islands.
Percentage point change from 2001 to 2022 in the size of the occupational classes, selected council areas in Scotland, census data.
Source: NRS, Census 2001, 2011 and 2022.
Note: Data covers the population aged 25 to 64 years. The most recent census wave was conducted in 2022 in Scotland. Figures reflect a harmonised 5-group NS-SEC classification; the long-term unemployed and those who have never worked are intentionally excluded to ensure consistency over time.
Wales
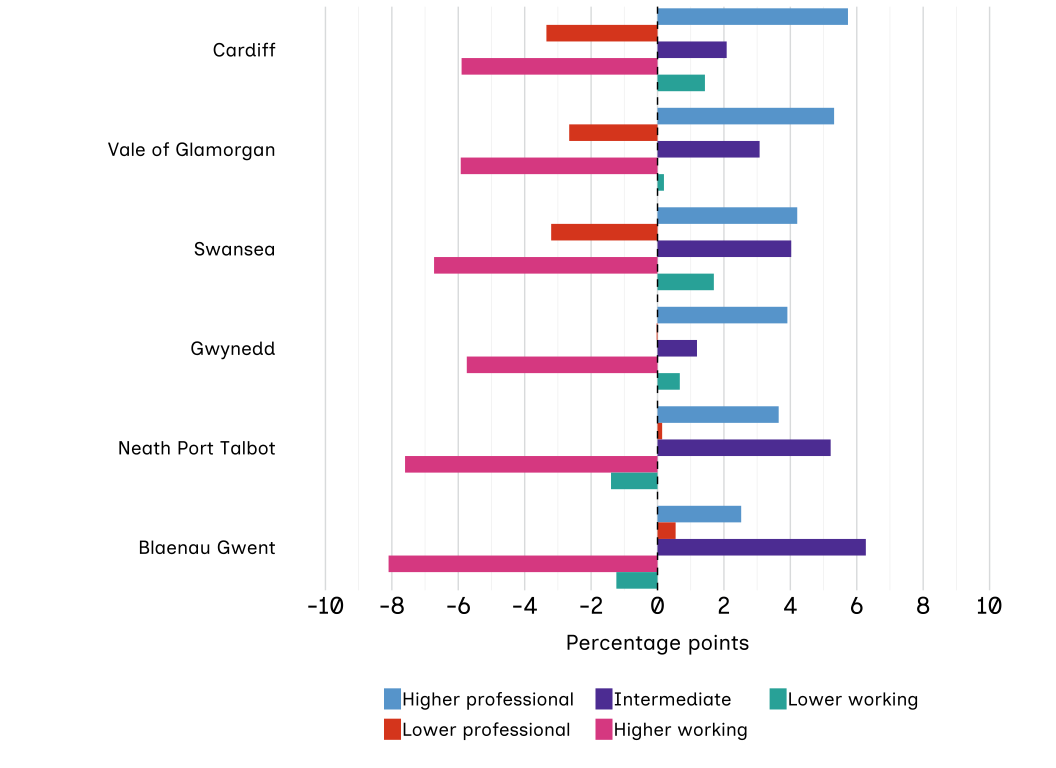
Changes in Welsh councils broadly aligned with the national trends: expanding higher professional and intermediate classes paired with a substantial decline in the higher working class. The regional rankings remained largely unchanged from 2001 to 2021. Cardiff retained the largest proportion of higher professional class residents (growing by 5.7 percentage points), while the former industrial area of Blaenau Gwent consistently had the smallest professional class and the largest lower working class in the entire UK.
While the percentage-point changes in former industrial areas like Blaenau Gwent and Neath Port Talbot were quite small, these were largely expected based on national trends. Because of ‘floor’ and ‘ceiling’ effects – starting from such low baselines – massive absolute changes are statistically unlikely over a 20-year period.[footnote 11] The data suggests these slow shifts should not be viewed negatively; as in Scotland, there may have been a slight convergence towards the national average.
Figure 6.6: Changes over time in Welsh councils have been broadly in line with national trends. Cardiff remained the council with the largest professional class and Blaenau Gwent the one with the largest working class.
Percentage point change 2001 to 2021 in the size of the 5 social classes, selected LAs in Wales, census data.
Source: ONS, Census 2001, 2011 and 2021.
Note: Data covers the population aged 25 to 64 years. Figures reflect a harmonised 5-group NS-SEC classification; the long-term unemployed and those who have never worked are intentionally excluded to ensure consistency over time.
England
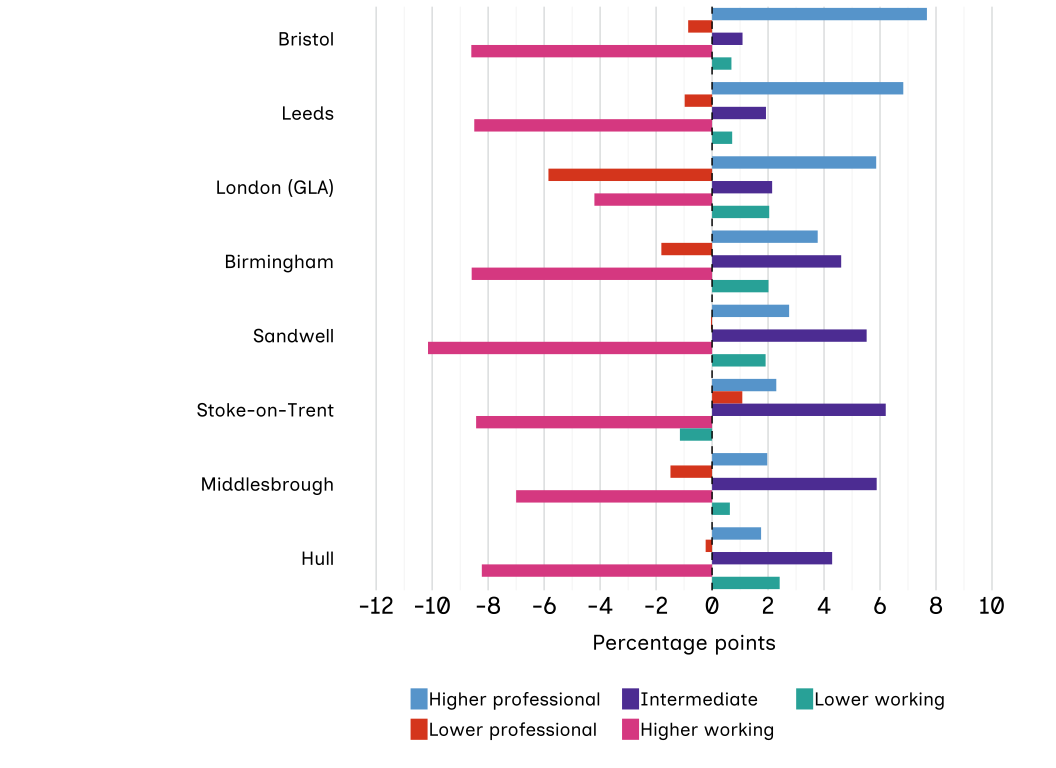
Unlike the relative consistency seen in Scotland and Wales, English LAs showed starkly different patterns of change over the 2 decades, even among areas with the same starting points in 2001. Cities such as Leeds and Bristol saw significant increases in their professional residents, with the higher professional class growing by 6.8 and 7.7 percentage points. In contrast, disadvantaged areas like Birmingham, Sandwell, Middlesbrough, Stoke-on-Trent and Kingston upon Hull experienced some of the smallest increases in professional classes. Birmingham’s struggles align with findings from a Resolution Foundation report, which noted that despite being better off than the North in the mid-1990s, the West Midlands has experienced 3 decades of relative economic decline and now lags far behind the South.[footnote 12] In places like Sandwell, Birmingham, Leeds, Bristol, Stoke-on-Trent and Kingston upon Hull, the decline of the higher working class was particularly severe – dropping by 8 to 10 percentage points. This reflects the long-lasting aftershocks of the sweeping deindustrialisation of the 70s and 80s.[footnote 13]
The Greater London Authority (GLA) also presented a highly exceptional case. In 2001, London and Edinburgh each had professional classes making up 50.3% of their populations. By 2021 to 2022, Edinburgh had moved clearly ahead, as London’s 5.9-point rise in its higher professional class was offset by a matching 5.9-point fall in its lower professional class. This pattern might be caused by high housing costs pushing lower-income residents out into the surrounding Home Counties (Essex, Hertfordshire, Berkshire, Buckinghamshire, Kent and Surrey). Within London itself, highly varied patterns emerged, often driven by gentrification and localised housing affordability.[footnote 14] Boroughs like Hackney, Greenwich and Newham saw greater-than-expected professional growth, while others like Brent, Barnet and Ealing did not.
Figure 6.7: The percentage point increase in the size of the professional classes was smallest in disadvantaged areas such as Kingston upon Hull and Stoke-on-Trent, and largest in Leeds and Bristol.
Percentage points change from 2001 to 2021 in the size of the occupational classes, selected LAs in England, census data.
Source: ONS, Census 2001, 2011 and 2021.
Note: Data covers the population aged 25 to 64 years. Figures reflect a harmonised 5-group NS-SEC classification; the long-term unemployed and those who have never worked are intentionally excluded to ensure consistency over time.
Relative changes among local authorities
As well as looking at how selected LAs have changed and how they differ from the national trend, we can also see how their rankings have changed over time. We do this by ordering LAs by the share of residents working in higher or lower professional jobs.
For example, Wokingham LA had 57% of its residents working in professional jobs in 2001 and around 59% in 2021 to 2022. In both cases, this was the highest percentage in the UK. Trafford LA had around 47% of its residents working in professional jobs in 2001 and 54% in 2021 to 2022. This moved Trafford up from 15th to 6th position.
There was considerable stability over time in the relative sizes of professional classes across LAs. In table 6.1, LAs such as Wokingham, Windsor and Maidenhead and Surrey stayed at the top of the rankings over the 2 decades. At the other end, areas like Blaenau Gwent, Stoke-on-Trent and Kingston upon Hull remained near the bottom. Major transformations in occupational structures are rare over a 20-year span, so the overarching hierarchy of regional occupational opportunity remains deeply entrenched.
Table 6.1: There was considerable stability over time in the relative sizes of the professional classes in different LAs.
| % in the prof classes 2001 | Rank in 2001 | % in the prof classes 2021/22 | Rank in 2021/22 | Percentage point change in the size of the prof classes 2001–2021/22 | |
|---|---|---|---|---|---|
| Wokingham | 57.0 | 1 | 59.2 | 1 | +2.2 |
| Windsor and Maidenhead | 55.2 | 2 | 56.8 | 3 | +1.7 |
| Surrey | 52.5 | 3 | 54.0 | 6= | +1.5 |
| East Renfrewshire | 51.9 | 4 | 57.5 | 2 | +5.6 |
| Buckinghamshire | 50.7 | 5 | 51.6 | 9 | +0.9 |
| GLA | 50.3 | 6 | 50.3 | 11 | 0 |
| City of Edinburgh | 50.3 | 7 | 54.9 | 4 | +4.6 |
| East Dunbartonshire | 50.2 | 8 | 54.8 | 5 | +4.6 |
| Bracknell Forest | 49.7 | 9 | 49.6 | 15= | -0.1 |
| Hertfordshire | 48.2 | 10 | 50.0 | 13 | +1.8 |
| Brighton and Hove City | 48.2 | 11 | 52.8 | 8 | +4.6 |
| Oxfordshire | 47.9 | 12 | 50.2 | 12 | +2.3 |
| Trafford | 46.7 | 15 | 54.0 | 6= | +7.3 |
| Orkney Islands | 28.3 | 172 | 35.0 | 168 | +6.7 |
| Derry City and Strabane | 28.2 | 173 | 34.7 | 169 | +6.5 |
| Causeway Coast and Glens | 28.1 | 174 | 32.9 | 173 | +4.8 |
| Fermanagh and Omagh | 28.0 | 175 | 33.1 | 171 | +5.1 |
| Barnsley | 27.9 | 176 | 32.0 | 177 | +4.1 |
| Blackpool City | 27.5 | 177 | 29.4 | 178 | +1.9 |
| North East Lincolnshire | 27.0 | 178 | 28.9 | 179 | +1.9 |
| Dumfries and Galloway | 26.9 | 179 | 32.3 | 176 | +5.4 |
| Mid Ulster | 26.0 | 180 | 32.6 | 174 | +6.6 |
| Sandwell | 25.9 | 181 | 28.6 | 181 | +2.7 |
| Kingston upon Hull City | 25.1 | 182 | 26.7 | 184 | +1.6 |
| Stoke-on-Trent City | 24.2 | 183 | 27.6 | 182 | +3.4 |
| Blaenau Gwent | 24.0 | 184 | 27.1 | 183 | +3.1 |
Source: ONS, NRS, and NISRA, Census 2001, 2011, and 2021 to 2022.
Note: Data covers the population aged 25 to 64 years to represent working age. The most recent census wave was conducted in 2022 in Scotland and in 2021 in England, Wales and Northern Ireland. Figures reflect a harmonised 5-group NS-SEC classification; the long-term unemployed and those who have never worked are intentionally excluded to ensure consistency over time.
In-depth analysis is needed to understand why these unusually large and small changes have occurred. In the case of Northern Ireland, it seems likely that the Good Friday Agreement and the measures introduced as part of it have played a role. On the other hand, the experience of Birmingham, Middlesbrough and Kingston upon Hull may be due to the continuing shadow of deindustrialisation of the 70s and 80s – although there is still the question about why other deindustrialised cities have managed differently.[footnote 15] The case of London is particularly intriguing. One possibility is that high house prices have encouraged some people with lower incomes to move out to surrounding areas of the Home Counties (Essex, Hertfordshire, Berkshire, Buckinghamshire, Kent and Surrey) that lie within the Greater London travel-to-work area. This means people can still benefit from the higher wages and greater job opportunities that the capital offers.
The implications for social mobility
Local changes in the sizes of professional classes have important implications for social mobility and internal migration. In areas where the percentage of working-class jobs has been persistently high and the percentage of professional jobs persistently low, there are simply not enough professional opportunities available for those from working-class origins.
Social mobility and geography
In Kingston upon Hull in 2001, 57.5% of residents were in working-class jobs. By 2021, 26.7% were in the professional class. In a hypothetical world where no one moved area between 2001 and 2021, we might estimate that 57.5% of today’s residents have working-class origins, because their parents had working-class jobs in 2001. Yet today, only 26.7% of residents are in professional jobs. The ratio 26.7 to 57.5 is equal to 0.49, meaning there has been only half a professional opportunity for every person of working-class origin.
In stark contrast, Leeds had 38.7% of residents in working-class jobs in 2001 and 44.6% in the professional class by 2021, yielding a much more favourable ratio of 1.15. Therefore, there is at least one professional opportunity for every working-class resident in Leeds, making upward mobility chances much better there than in Kingston upon Hull.
In reality, people can and do move to different parts of the UK to find work. But this hypothetical example shows that people moving for work may be less of a choice and more of a necessity for those born in certain areas who wish to increase their opportunities (be upwardly mobile).
If professional job opportunities do not increase in some areas of the UK, then young people growing up there may increasingly face a choice between geographical mobility and occupational mobility. Unfortunately, the evidence suggests that many former industrial areas have not yet generated professional labour markets at sufficient scale.
Also, housing affordability may increasingly shape access to opportunity-rich labour markets. If moving up the ladder requires moving to a prosperous city, but housing in that city is out of reach for the majority of young people, the implications for social mobility could be severe.
Case studies
Andrew Graham, age 60, Hull, Yorkshire

I grew up on an estate and it could be rough at times. When I left school, I was put on a government Youth Opportunity Scheme, earning £25 a week. The scheme involved gaining work experience in different placements for 6 months. I ended up working with electricians and really enjoyed it. At the end of the 6 months they wanted to keep me on, but there wasn’t an apprenticeship available, so I was placed on a different scheme at the same factory, but this time in the laboratory. I hated it. It was boring and tedious, and I missed working with the electricians.
One day, I saw a man in a suit walking across the yard. I thought he was a sales rep, but he seemed a bit lost, so I had a quick chat with him and showed him to the offices. He asked what I worked on and I told him I had just been moved to working in the lab but honestly that I preferred my previous role with the electricians.
Later, he walked into the lab surrounded by managers. It turned out he was the owner of the factories. He came up to me, greeted me by name and said I’d been polite and helpful. That act of politeness, my honesty and some luck got me an apprenticeship. I was about 17 years old at the time and I stayed there for the next 43 years.
It was a flour mill originally dating back to the 1800s. In the 1970s it was converted into a snack food mill, producing ingredients for the food industry. When I started there were about 72 employees, but by the time I left, there were only 26. The reduction in head count was mainly due to cost-cutting and automation. We brought in high-speed packing lines and jobs that used to be done manually disappeared.
I took pride in my work. Over the years I saved spare parts and kept things running when they could have broken down. I always felt like I was helping keep the factory going and people in jobs.
Things changed when new managers came in. They didn’t understand the old machinery or how the place worked. Within a few years, the place shut down. Most of the mills that are still going are part of a bigger group. They’re easier to clean because they’re modern and open. I think we were the very last mill in Hull – and now we’re gone.
Around the same time, things were difficult in my personal life. My partner had passed away. My dog passed away. After all of this, I then started looking for work. I had got some redundancy money but I realised it wasn’t going to last very long due to the cost of living. I found the benefits system unhelpful. They couldn’t find me work and I didn’t like the way they spoke to me.
I became depressed and went to the doctor. I was referred to Talking Therapies and they were the ones who pointed me towards Giroscope.[footnote 16][footnote 17] They helped me rebuild my working life, including helping me write a proper CV and guiding me through applications.
My fingers are engineer’s fingers. I didn’t have a laptop, only a phone and I’m not good at typing. When I was invited to an online Teams interview, I didn’t know what that was and almost attended the interview in person. Giroscope helped me throughout the process. I didn’t want engineering work anymore, so they helped tailor my CV to reflect my caring experience, like looking after my parents.
I had a taste of being at home and it felt lonely and boring without my partner and my dog. I’m about to start my new chapter as a support worker, helping people with disabilities and mental health needs in a residential home. When I went to the interview, one of the residents took my hand and gave me a guided tour of the place. It was a lovely moment and I thought – this is what I want.
Frances Fulton, age 58, Dungannon, Northern Ireland

My dad was a labourer and my mum stayed at home. I hated school with a passion. I came from a working-class home and the teachers clearly didn’t like it, I wasn’t fancy enough.
But I’m the type of person who always knew I wanted to get a degree so I could get a half-decent job. It’s something my mother always instilled in me: be independent, because she regretted not being. I was always good at maths but English was a struggle. When I was doing my A levels, I was still trying to pass my English O level at the same time because I needed a pass to get into university. It took me 8 attempts.
I succeeded in getting to university and halfway through studying computer science I discovered I was dyslexic. It was sort of an ‘Oh, that explains a lot’ moment. In the first year, everything was practical and I was top of the class, but in the second year, when it changed to more written work, I failed.
After university, I got a temporary job working on the millennium bug. Then I did a series of jobs in computer science. I ended up working at Belfast Metropolitan College for around 17 years, but then they made the entire in-house programming team redundant. I was 55 years old when I was made redundant. I started getting a payout from my pension, but it wasn’t enough to cover my bills.
I was applying for jobs left, right and centre, but this got even harder when my father ended up in hospital and I took on a caring role for him. It became clear that I wasn’t going to get a job within the IT sector that was rapidly changing because of AI, something I did not have experience in. I found the endless job applications extremely time-consuming with my dyslexia and I was also struggling with health issues, having been diagnosed with type 2 diabetes. When job applications asked about any illnesses, I felt they might not want me because of the time off I would need to attend clinics.
I decided to go to a job fair, where an employment support programme connected me with a pet food business. I wanted a night-shift job so that I could continue to care for my dad during the day. Alongside support from the employment support programme, I did 2 interviews and secured the job!
I’m now doing night shifts as a machine operator. The job has allowed me to grow my skillset as I have to train in various roles, so if something happens, I can take over and do the job for someone else. I’ve just mastered the conveyor belts. Everyone says night shifts are really difficult, but actually I don’t mind it as it allows me to work and still care for my father.
-
We collated UK-level figures from the Office for National Statistics (ONS) (England and Wales), Northern Ireland Statistics and Research Agency and National Records of Scotland for the 2001, 2011 and 2021 Censuses (2022 for Scotland). Variations in question wording across census years affected specific sub-categories, particularly ‘never worked’ and long-term unemployment figures between 2011 and 2021. The long-term unemployed and those who have never worked are intentionally excluded from our analysis due to such inconsistencies. ↩
-
Higher working-class occupations include: lower supervisory, technical and semi-routine roles, such as foremen, mechanics, electricians and train drivers, as well as printers, shop assistants, traffic wardens, housekeepers and farmworkers. ↩
-
The Labour Force Survey (LFS) did not enable us to distinguish local authorities (LAs) in Northern Ireland. ↩
-
Social Mobility Commission, ‘State of the Nation 2025: the evolving story of social mobility in the UK’, 2025. Published on GOV.UK. ↩
-
In this analysis ‘long-term unemployment’ is defined as being unemployed for 12 months or more. ‘Never worked’ means people who say in the census that they have never done any paid work. ↩
-
The index of dissimilarity between Wales and Northern Ireland fell from 4.9 in 2001 to 1.8 in 2021. This index measures the percentage of people who would need to change their class in order to make the 2 distributions the same. ↩
-
The Good Friday Agreement is a peace deal that helped end decades of conflict in Northern Ireland in 1998. ↩
-
Full data of the occupational classes over time can be found on the Social Mobility Commission’s Data Explorer Tool. Published on SOCIAL-MOBILITY.DATA.GOV.UK. ↩
-
We show the residuals from a loglinear model that fits all the two-way interactions between time period, LA size, and LA occupational-class composition. These residuals show how much the current occupational-class composition of the LA differs from what we would have expected based on the LA’s starting composition, the change over time in its population size, and the change over time in national class composition. The size of the residual shows how strongly that LA moves away from the national trend in its class composition. For example, if the size of the higher professional class has increased by 10% nationally, we might expect a similar increase in every LA, but of course some LAs will have seen higher (or lower) increases. Further details can be seen in the technical annex. ↩
-
In some areas of England, local government is divided between a county council (upper-tier LA) and a district council (lower-tier LA), which are responsible for different services. In other areas of England, and in Scotland, Wales and Northern Ireland there is a single-tier (or ‘unitary’) LA instead. ↩
-
A floor effect happens when data clusters at the bottom of a scale – people are at the lowest possible level, so they cannot go any lower. Similarly, a ceiling effect happens when data clusters at the top of a scale. ↩
-
Resolution Foundation, ‘Unsung Britain: a portrait of the country’s poorer half’, 2026. Published on RESOLUTIONFOUNDATION.ORG. ↩
-
Patricia Rice and Anthony Venables, ‘The persistent consequences of adverse shocks’, 2021. Published on ORA.OX.AC.UK. ↩
-
Often within capital cities and larger towns, gentrification is the process by which historically poor areas become wealthier as middle-class people with higher incomes move in. Trust for London reports that around 53 neighbourhoods in London have been gentrified since 2001 alone. ↩
-
Patricia Rice and Anthony Venables, ‘The persistent consequences of adverse shocks’, 2021. Published on ORA.OX.AC.UK. ↩
-
Talking Therapies is the NHS national programme for treating common mental health difficulties, such as anxiety, depression, panic, trauma‑related symptoms and long‑term condition-related distress. ↩
-
Giroscope (Hull) helps unemployed individuals transition into work through tailored goal planning, short courses and voluntary work experience in construction, recycling and cooking. ↩