Chapter 4: Tracking drivers: important national trends
Published 29 October 2026

© Crown copyright 2026
This publication is licensed under the terms of the Open Government Licence v3.0 except where otherwise stated. To view this licence, visit nationalarchives.gov.uk/doc/open-government-licence/version/3 or write to the Information Policy Team, The National Archives, Kew, London TW9 4DU, or email: psi@nationalarchives.gov.uk.
Where we have identified any third party copyright information you will need to obtain permission from the copyright holders concerned.
This publication is available at https://www.gov.uk/government/publications/state-of-the-nation-2026-whos-getting-ahead/chapter-4-tracking-drivers-important-national-trends
Highlights
Parental education and professional employment continue their long-term rise. Of adults living in a household with children, 45% had a degree or higher qualification and 48% were in professional roles in 2025. However, the momentum of these gains has slowed since the pandemic.
Average parental hourly income rose sharply to £23.89 in 2025, up from £22.29 in 2024, marking the largest year-on-year increase recorded since the 2019 to 2020 period.
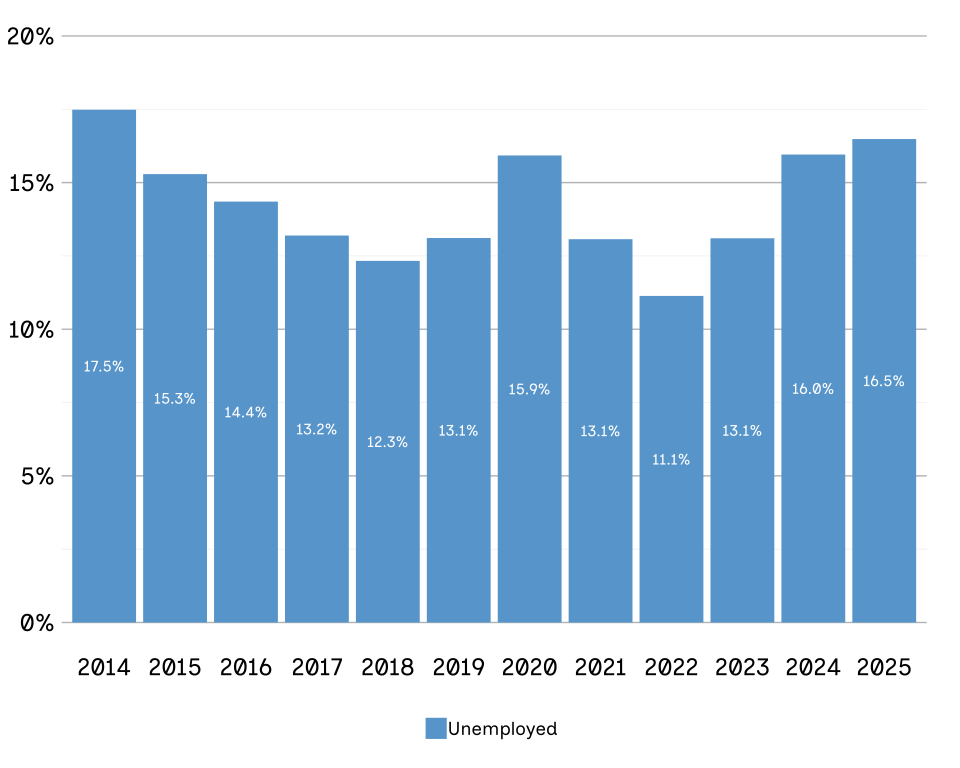
The immediate outlook for young people remains challenging, with rates of young people not in education, employment or training (NEET) reaching a high of 9% in 2024 (the highest since 2012), and youth unemployment for those aged 16 to 24 years returning to 2014 levels at around 16% in 2025.
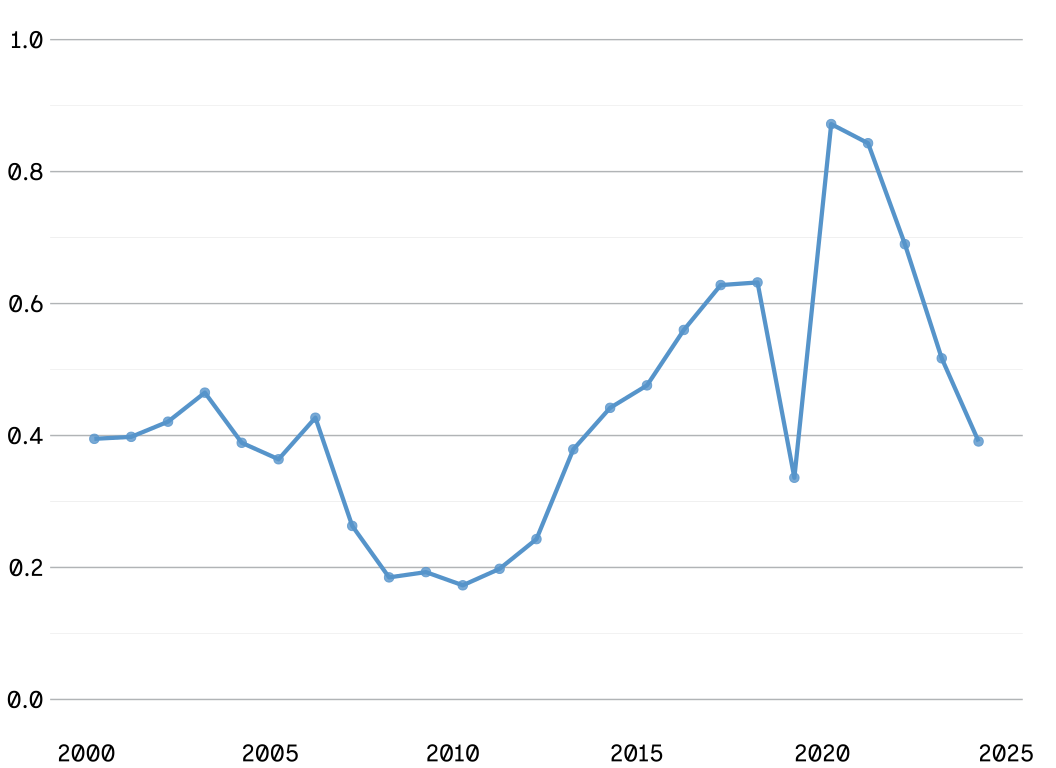
The wider labour market is tightening, with the vacancy-to-jobseeker ratio continuing its downward path from the historic peak in 2021, dropping from 0.7 in 2023 to 0.4 in 2025.
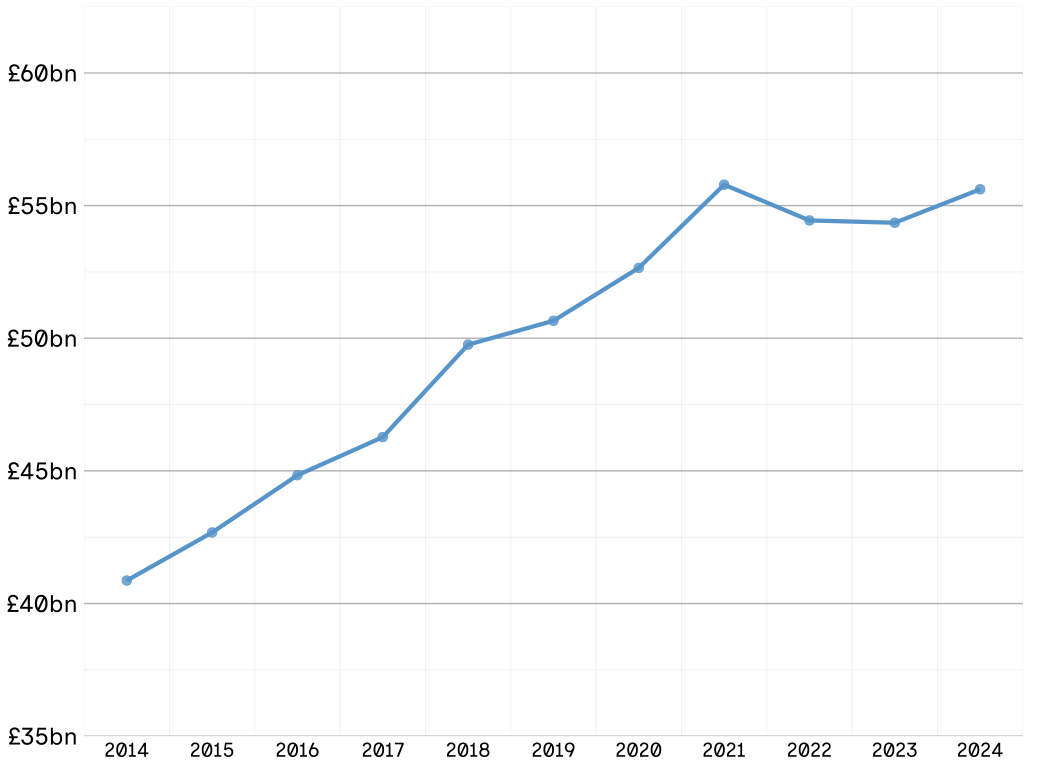
Business investment in research and development (R&D) has nearly returned to its highest point of £55.8 billion in 2021, following a 2-year decline. This suggests an improving foundation for future high-skilled job opportunities.
These national figures hide major differences, as opportunity is not shared equally across the UK.
Introduction
This chapter explores the drivers, which are the social and economic factors that help or hinder mobility. For example, a strong public education system will help those who might not otherwise have a chance to succeed.
Our Social Mobility Index concentrates on 4 types of drivers: conditions of childhood, educational opportunities and quality of schooling, young people’s opportunities in the labour market, and the role of social capital (the value of networks) and connections. There is a large body of theory and empirical research showing that these 4 groupings of drivers are likely to have causal impacts on rates of absolute and relative mobility.[footnote 1] This means that drivers tell us whether rates of social mobility in the future are likely to improve.
The full suite of indicators that cover all drivers of mobility is available on our online Data Explorer Tool.[footnote 2] All the figures in this report and the interactive tool use the latest data available.
National trends in drivers
Summary
The latest data shows a mixed picture across the drivers. Beginning with parental outcomes, which serve as the baseline for the future prospects of their children, parental education and professional employment continue to rise, but the momentum of these gains is slowing. Meanwhile, average parental hourly income has recently increased markedly, after years of very slow growth.
However, NEET rates have reached their highest point since 2012 and youth unemployment has returned to levels last seen in 2014. These shifts have occurred alongside a tightening labour market, reflected in a fall in the number of vacancies per jobseeker. So the immediate outlook for young people remains challenging.
The third area centres on high-skilled job creation and offers a more positive direction. Business investment in R&D has nearly returned to its historical peak following a two-year decline. This recovery suggests an improving foundation for future opportunities, even though the current outlook for those entering the labour market is tough.
The following sections provide a detailed analysis of these trends, identifying potential opportunities and challenges.
Parental education, occupation and income
A person’s future chances are closely linked to their parents’ resources. These resources are not just economic; a parent’s education and occupational level are also important in helping children to succeed academically and secure good jobs. For example, parents who attended university are often better equipped to help their children reach higher education (HE). Our analysis shows clear improvements in parental education, professional employment and earnings over the past 12 years. However, this has slowed notably since the pandemic.
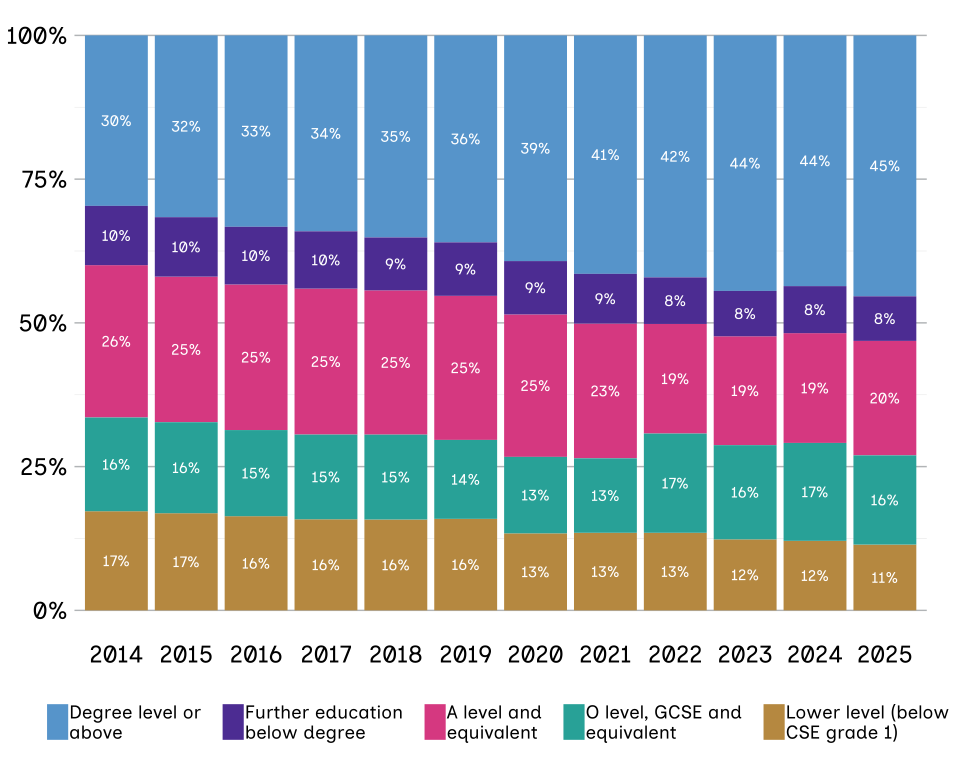
These trends are first apparent in the shifting educational levels of parents. Figure 4.1 shows that the qualifications of young people’s parents have improved over time. Since 2014, the education profile of UK parents has shifted towards higher qualifications: 45% of adults in families with children held a first degree or above in 2025, a significant increase from 30% in 2014. However, this is only 1 percentage point increase from the previous year, suggesting a slowing rate of increase. While the percentage of families whose highest qualification is a GCSE or below is declining, it is still 27% in 2025.
Figure 4.1: There has been a continuing increase in the proportion of households where the adults have higher-level qualifications.
Percentage of adults with different levels of education in households with dependent children in the UK, from 2014 to 2025.
Source: Office for National Statistics (ONS), Labour Force Survey (LFS) from 2014 to 2025.
Notes: Due to rounding errors, in some instances the totals may not add up to 100%. The sample consists of respondents with dependent children in their household (defined as those aged 0 to 15 years and 16 to 18 years who are in full-time education). Respondents aged under 21 years are excluded. The median age of respondents is 40 years. Most respondents are likely to be the parents or carers of the dependent children. However, the dataset could include some adults who are living at home with parents who have dependent children. A formal trend analysis was conducted to verify changes in parental educational attainment over time. The data used is weighted using the LFS person weights.
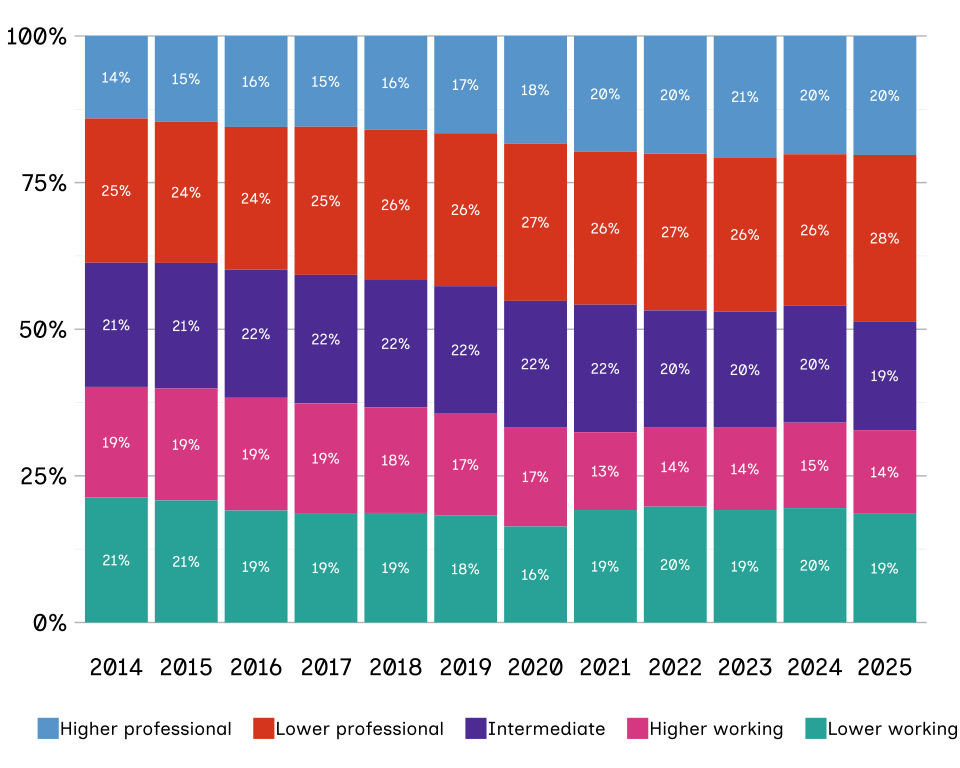
Alongside this shift in education profiles, the labour market has seen a gradual increase in parents holding professional roles. Figure 4.2 shows the distribution of parental occupation from 2014 to 2025. The percentage of adults in families with dependent children in both higher and lower professional occupations has increased from 39% in 2014 to 48% in 2025, although this trend has slowed over the last 5 years.
Figure 4.2: There has been a continuing increase in the proportion of families in which the adults have professional and managerial occupations.
Percentages of adults with different levels of occupation in families with dependent children in the UK, from 2014 to 2025.
Source: ONS, LFS from 2014 to 2025.
Notes: Due to rounding errors, in some instances the totals may not add up to 100%. The sample consists of respondents with dependent children in their household (defined as those aged 0 to 15 years and 16 to 18 years who are in full-time education). Respondents aged under 21 years are excluded. The median age of respondents is 40 years. Most respondents are likely to be the parents or carers of the dependent children. However, the dataset could include some adults who are living at home with parents who have dependent children. A formal trend analysis was conducted to verify changes in parental occupation over time. The data used is weighted using the LFS person weights.
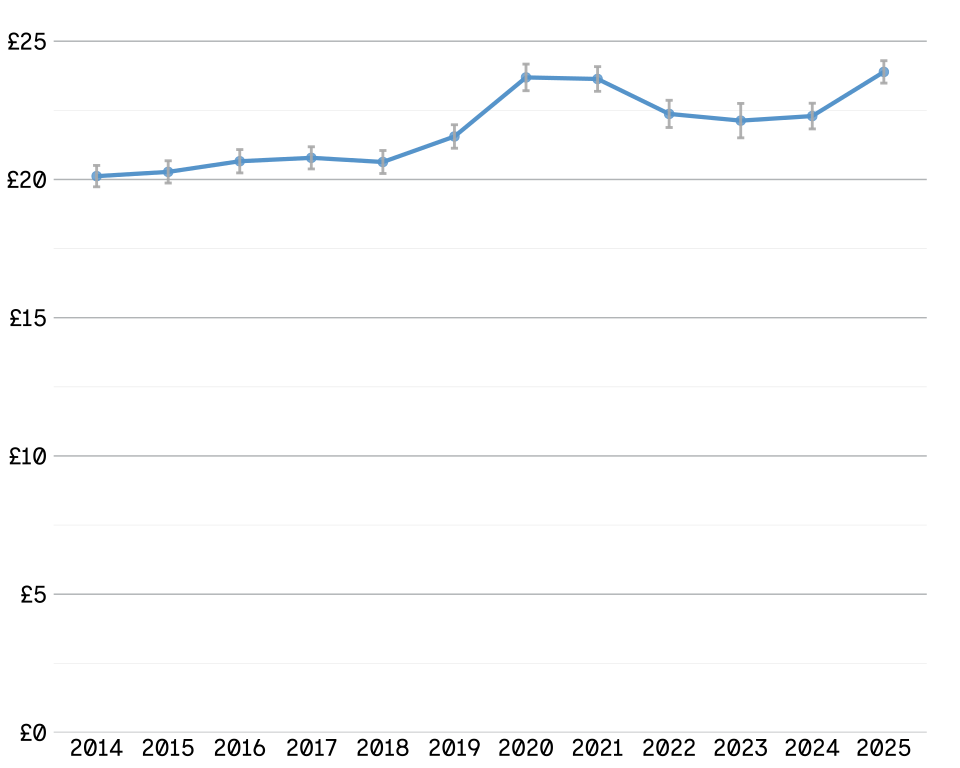
Data on the average (mean) income of people with dependent children was part of our Conditions of Childhood composite index in our 2025 report, but has not been discussed as a standalone driver previously.[footnote 3] Figure 4.3 shows that the average hourly income for individuals with dependent children rose to £23.89 in 2025, up from £22.29 in 2024, around the highest level recorded since tracking began. The observed year-on-year increase of £1.60 in 2025 is the largest recorded in the series since the 2019 to 2020 period.
Figure 4.3: Average hourly income for parents rose to £23.89 in 2025, around its highest level since 2014.
Average hourly earnings, adjusted for inflation, of people with dependent children (UK, 2014 to 2025).
Source: ONS, LFS from 2014 to 2025.
Notes: Average hourly earnings is strictly a measure of employment earnings (pay) and excludes non-wage benefits or other sources of income. For this measure, we report the average parental income to maintain methodological consistency with the other indicators used to calculate the composite indices. Please note that earnings data is typically ‘right-skewed’, so the average may be pulled upward by a small number of very high earners and may sit higher than the income of the ‘typical’ household (the median). The sample consists of respondents with dependent children in their household (defined as those aged 0 to 15 years and 16 to 18 years in full-time education). Respondents aged less than 21 years are excluded. The median age of respondents is 40 years. Most respondents are likely to be the parents or carers of the dependent children. However, the dataset could include some adults who are living at home with parents who have dependent children. The data is weighted using the LFS person weights. Earnings have been adjusted for inflation using 2025 as the base year. A formal trend analysis assessed changes in parental income over time.
Further education and training opportunities of young people
What happens after compulsory education is critical for a person’s long-term development. Success during these formative years shapes mobility prospects, yet current data suggests that this transition is becoming increasingly difficult for the next generation. A rise in NEET rates and limited work opportunities now present a clear barrier to progress across the country.
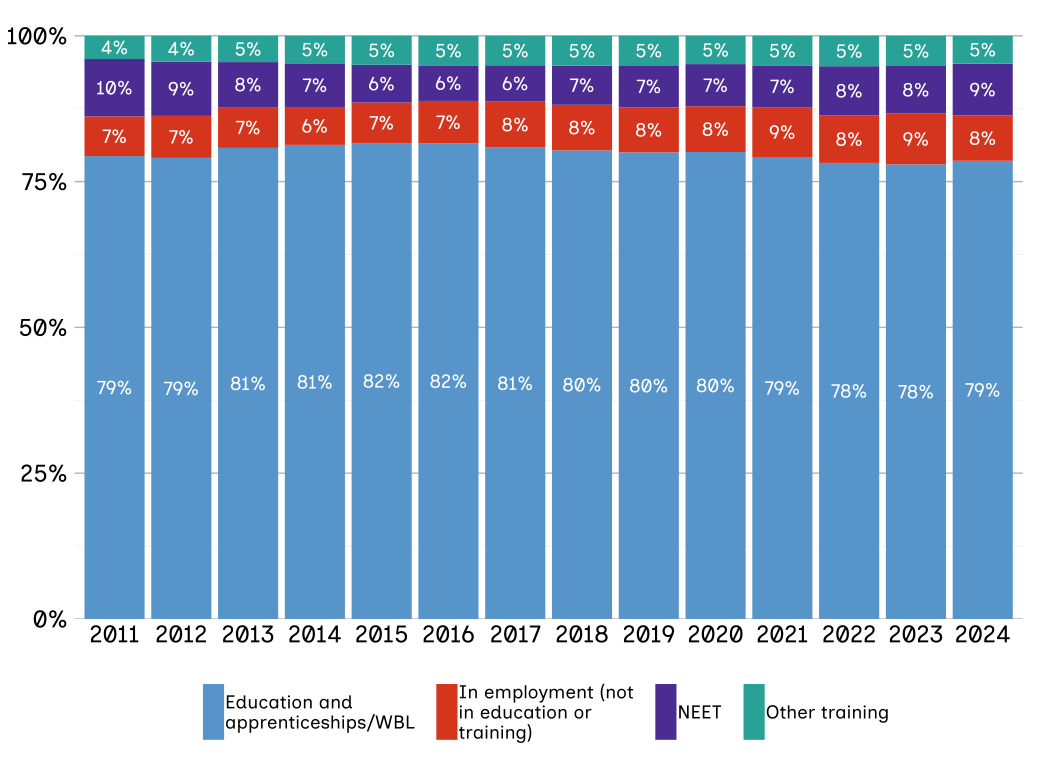
The scale of this challenge is reflected in the shifting participation and employment data for those aged 16 to 18 years, whose participation in education has stayed relatively stable since 2011. However, the proportion of young people who are NEET climbed to 9% in 2024. This is the highest level recorded since 2012. Also, Office for National Statistics (ONS) estimates from 2025 show that 13.5% of all young people aged 16 to 24 years in the UK were NEET, with the employment rate falling to a 10-year low.[footnote 4][footnote 5]
Looking at figure 4.4, there was a time of steady improvement between 2011 and 2015, when the percentage of those aged 16 to 18 years who were NEET dropped from 10% to 6%. However, these rates have been rising since the pandemic. Likewise, ONS estimates have seen a steady increase since 2021. Meanwhile, the proportion of young people aged 16 to 18 years in employment has remained relatively stable, at 8 to 9% since 2020. Figure 4.4 also shows a slight increase in participation in education and apprenticeships or work-based learning (WBL), from 78% in 2023 to 79% in 2024, and these rates have stayed relatively stable since 2011.
Figure 4.4: NEET rates in 2024 were at the highest levels since 2012.
Percentage of young people aged 16 to 18 years participating in education, employment and training in England, from 2011 to 2024.
Source: Department for Education (DfE), participation in education, training and employment, 2011 to 2024.
Notes: Due to rounding errors, in some instances the totals may not add up to 100%. Revisions to the ONS’s population estimates have had an effect on previously published rates of young people in education, employment and training for the period 2021 to 2023. This means that increases in the population estimates have led to slight falls in participation rates and slight increases in NEET estimates for that period.[footnote 6] NEETs include anybody who is not in any form of education, training or employment. This means that a person identified as NEET is either unemployed or economically inactive.[footnote 7] Historically, there have been very small overlaps of students studying in further education, HE and WBL at the same time. The total number of young people in training is calculated by excluding these overlaps. Since 2013, young people aged 16 to 17 years have been legally required to remain in education and training in England (at least part-time) but not in Wales, Scotland or Northern Ireland.
To gain a deeper insight into these trends, the Commission has conducted qualitative research (aiming to understand behaviours and experiences) into why young people become NEET. This work concentrates on identifying the unique challenges they face to provide a clear basis for policy recommendations that support youth transitions (moving from childhood to adulthood) and improve social mobility.
Youth unemployment
Alongside these increasing rates of young people who are NEET, youth unemployment has also been increasing since 2022. Figure 4.5 shows that around 16% of economically active 16 to 24 year olds were unemployed in 2025, up from 11% in 2022. This marks a return to levels not seen since the 2014 peak of around 17%. ONS data also shows something similar; that between November 2025 and January 2026, 732,000 young people aged 16 to 24 years were unemployed, up 99,000 from the previous year. The unemployment rate for young people was 16%.[footnote 8][footnote 9] The Institute of Employment Studies’ analysis found that the youth unemployment rate is the highest in more than 10 years.[footnote 10]
Figure 4.5: Youth unemployment reached the highest rate since 2014.
Percentage of young people aged 16 to 24 years in the UK, from 2014 to 2025, who were unemployed.
Source: ONS, LFS, from 2014 to 2025, weighted data, economically active respondents aged 16 to 24 years.
Notes: The LFS follows the internationally agreed definition for unemployment recommended by the International Labour Organisation – a UN agency. Unemployed people are those without a job, who have actively sought work in the last 4 weeks and are available to start work in the next 2 weeks; or are out of work, have found a job and are waiting to start it in the next 2 weeks. Those who are economically inactive are excluded from the calculations (for example in full-time education, looking after the home or permanently sick or disabled). A formal test was conducted of whether there are differences in youth unemployment over time. The data is weighted using the LFS person weights.
Job vacancy rate
The wider job market may be contributing to these unemployment and NEET rates. Figure 4.6 shows the number of vacancies per jobseeker over time. This ratio serves as an indicator of job opportunities. A higher ratio means that there are more vacancies per jobseeker and therefore greater job opportunities. This ratio provides estimates of the overall state of the labour market, but not of the opportunities specifically for young people entering the market.
Figure 4.6 shows that the estimated number of vacancies for every jobseeker went down from 0.7 in 2023 to 0.4 in 2025, extending the downward trend from its 2021 historic peak (nearly 0.9 vacancies for every unemployed person). The job vacancy rate was at its lowest between 2009 and 2012, at around 0.2 vacancies for every unemployed person. The Institute of Employment Studies highlights that young people are particularly affected by this reduction in hiring. Nearly 40% of unemployed young people aged 18 to 24 years have been unemployed for more than 6 months.[footnote 11]
Figure 4.6: Vacancy-to-jobseeker ratio continues its downward trend from the 2021 historic peak.
Number of vacancies per unemployed person in the UK (seasonally adjusted), quarter 4 from 2001 to 2025.
Source: ONS, Vacancy Survey and LFS (respondents aged 16 to 64 years), 2000 to 2025.
Notes: A proxy for job opportunities is calculated by ONS as the ratio of the number of unemployed (as estimated from the LFS) relative to the number of vacancies (as estimated in the Vacancy Survey) and published here as the reciprocal. Ratios were calculated using quarter 4 (October to December) from 2001 to 2025. A higher value indicates greater opportunities for jobseekers.
Business spending on research and development
The difficult outlook for young people reflects a labour market that faces huge challenges, particularly the stability of entry-level. One way to increase these opportunities is through the availability of high-skilled jobs that offer a clear path for improvement. The growth of such roles is often linked to wider economic innovation. For that reason, the Index tracks business spending on R&D because it signals where high-value, future-proof jobs are likely to be created.
From 2014 to 2024, spending on R&D by UK businesses rose from £41 billion to £55.6 billion. Investment was highest in 2021 at £55.8 billion. The recent £1.3 billion increase between 2023 and 2024 returned the UK to near-peak levels of spending. However, this was a modest increase in the context of the general trend from 2014 to 2021. This upward trend aligns with a growing proportion of professional roles in the UK. However,the limited growth in investment over the past 3 years could start to constrain this progress.
Figure 4.7: Business spending on research and development (R&D) has sharply increased since 2015.
Business spending on R&D, adjusted for inflation, UK, 2014 to 2024.
Source: Business expenditure on R&D, ONS. Nomis population estimates, ONS. 2014 to 2024.
Notes: Figures are presented in constant 2024 prices to account for inflation (when prices go up and money devalues). Following ONS methodology introduced in November 2025, this series now uses the specific R&D deflator rather than the general gross domestic product deflator.[footnote 12] To maintain a consistent trend, data from 2014 to 2017 has been re-indexed to the 2024 baseline using a link-year method (anchored in 2018). This preserves historical growth rates while ensuring alignment with the latest ONS R&D price indices and sampling improvements.
Investment is an important priority for the Commission. Our publication, ‘Innovation, investment and inclusion: a framework for regional renewal’, highlighted that innovative growth is a vital component of social mobility.[footnote 13] It set out a plan for inclusive growth through a series of recommendations designed to attract private capital into ‘left-behind’ regions, support entrepreneurship and adult skills, and increase opportunities in regions outside London and the South East.
Conclusions
Monitoring drivers such as parental education, occupation and income, youth employment and wider labour market conditions offers a long-term view of the country’s opportunities for social mobility. By tracking a person’s starting point, we can anticipate future problems and offer early solutions that improve options for the next generation.
In assessing these patterns, we see an upward trend in parental education and occupational level. This continues the long-term, slow shift we have been tracking for several years. Parental income also saw a sharp rise. Yet, alongside these shifts, there are higher rates of youth unemployment and those who are NEET. Tracking change on innovation and growth remains important to find solutions.
However, these national figures hide major differences. Opportunity is not shared equally across the UK. Our previous reports have consistently shown that where a person grows up strongly affects their life chances. Chapters 5 and 6 will explore these variations in detail. This geographical breakdown will show exactly where the barriers and opportunities are most concentrated.
Case study
Martin Levermore, age 64, Walsall, West Midlands

I was born in Birmingham but my parents came from Jamaica. My mother was a nurse and my father was a trained mechanic. I’m one of 5. I have an older brother and 3 younger sisters.
Growing up in the UK in the 70s, I never really saw people of my own background excelling. My parents felt the educational system for people of an ethnic background wasn’t as well-formed in the UK as in the West Indies, so we returned to Jamaica for our formative education. In the West Indies it was inspiring seeing people from different backgrounds and colours moving up the social ladder.
But with the political disturbances in Jamaica during the late 70s, we returned to the UK for safety. I took my O and A levels, and went on to study a degree in political economics in London. Many migrant parents of that generation wanted their children to go off to university and I was the first in my family to do that.
Degree in hand, I felt the world was my oyster. I decided to join the armed forces as a bomb disposal officer. After 4 and a half years I was bought out by an international bank and decided to return to civilian life and apply myself in another direction.
By luck rather than design, I found good mentors in the bank, from the board of directors to senior managers. I worked in the international trade finance department and was able to travel the world. But then in the mid-90s we had the secondary banking crisis, which meant I lost my job. Even with all my experience I couldn’t find another job. I had to find a way to stabilise, survive and keep my family together – this pushed me to create my own company.
I set up a Black internship programme, which is one of the leading success programmes for minority individuals to access careers in science.
I now have one daughter, aged 32 years, and a stepdaughter aged 19 years. I’ve always tried to encourage them to look beyond narrow boundaries and not feel limited in what they can aspire to do. I don’t want them to be confined within their own community, but to go out, learn about others and form diverse friendships that encourage creative thinking. I’ve seen this has helped build their confidence. My daughter went on to study a degree in Manchester and has pursued a variety of different careers – not just staying in one area but utilising her transferable skills – and my stepdaughter is currently planning to pursue a degree in forensic medicine.
My view is, if your parents were no longer here, would you be able to survive and thrive? It’s about giving them the tools to see the world as something they can actively participate in, not just observe.
We always encouraged our children, nieces and friends to engage, not just academically, but also in extra-curricular activities outside the classroom, like Duke of Edinburgh and sports, because that builds discipline and focus, which then supports academic work.
I believe the most important thing in being successful is value-based. Whether working in academia, healthcare or any industry, it’s about understanding why you’re doing something. It can’t just be about financial return, it’s about impact and creating lasting change.
I would say the most important thing my parents instilled in me is that regardless of the problems you face, your family is crucial in always being there to support you, dust you off, and push you forward. Never stop trying, that’s the key.
-
Empirical research is based on direct observation or measurement in real-world scenarios, rather than theory or opinion. It involves gathering evidence and analysing it. ↩
-
Social Mobility Commission, ‘State of the Nation: data about social mobility in the UK’, Published on SOCIAL-MOBILITY.DATA.GOV.UK. ↩
-
The Conditions of Childhood index aims to measure the socio-economic situation of parents with dependent children. ↩
-
ONS, ‘Young people not in education, employment or training (NEET), UK: May 2026’. Published on ONS.GOV.UK. ↩
-
Institute of Employment Studies, ‘Labour market statistics, February’, 2026. Published on EMPLOYMENT-STUDIES.CO.UK. ↩
-
Department for Education, ‘Participation in education, training and employment age 16 to 18’, Published on EXPLORE-EDUCATION-STATISTICS.SERVICE.GOV.UK. ↩
-
“Unemployed” means out of work but actively looking, and “economically inactive” means not working and not looking for work. ↩
-
House of Commons Library, ‘Youth unemployment statistics’, 2026. Published on COMMONSLIBRARY.PARLIAMENT.UK. ↩
-
ONS, ‘LFS: unemployment rate: UK: all: aged 16-24: %: SA’, 2026. Published on ONS.GOV.UK. ↩
-
Institute of Employment Studies, ‘Labour market statistics, February’, 2026. Published on EMPLOYMENT-STUDIES.CO.UK. ↩
-
Institute of Employment Studies, ‘Labour market statistics, February’, 2026. Published on EMPLOYMENT-STUDIES.CO.UK. ↩
-
A deflator is an economic tool used to remove the effects of inflation when numbers are compared over time. ↩
-
Social Mobility Commission, ‘Innovation, investment and inclusion: a framework for regional renewal’, 2025. Published on SOCIALMOBILITY.INDEPENDENT-COMMISSION.UK. ↩