Chapter 3: Intermediate outcomes
Published 29 October 2026

© Crown copyright 2026
This publication is licensed under the terms of the Open Government Licence v3.0 except where otherwise stated. To view this licence, visit nationalarchives.gov.uk/doc/open-government-licence/version/3 or write to the Information Policy Team, The National Archives, Kew, London TW9 4DU, or email: psi@nationalarchives.gov.uk.
Where we have identified any third party copyright information you will need to obtain permission from the copyright holders concerned.
This publication is available at https://www.gov.uk/government/publications/state-of-the-nation-2026-whos-getting-ahead/chapter-3-intermediate-outcomes
Highlights
This year, the Social Mobility Commission (SMC) examines intermediate outcomes across 3 areas: sex, ethnicity and disability. For the first time, we track trends over time for both sex and disability to look at shifting barriers to social mobility.
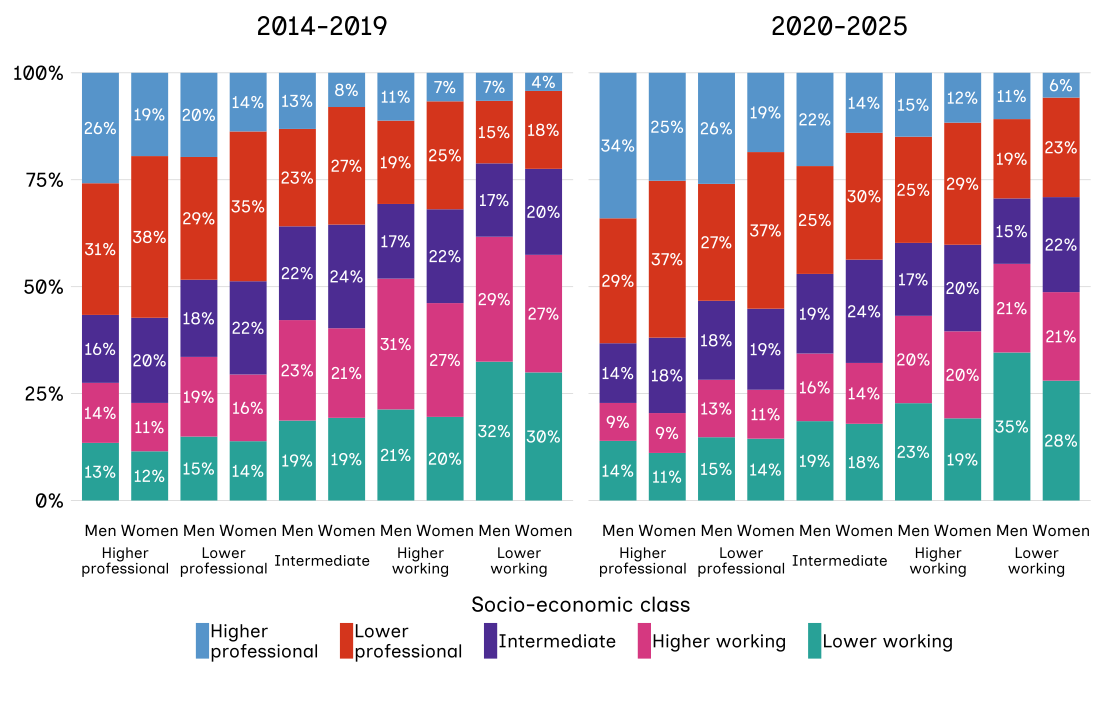
Girls outperform boys from age 5 years through to university. However, women aged 25 to 29 years are still less likely than men to be in top professional jobs. For example, from 2020 to 2025, 34% of men from the most advantaged backgrounds were in higher professional roles compared to 25% of women from the same socio-economic background (SEB).
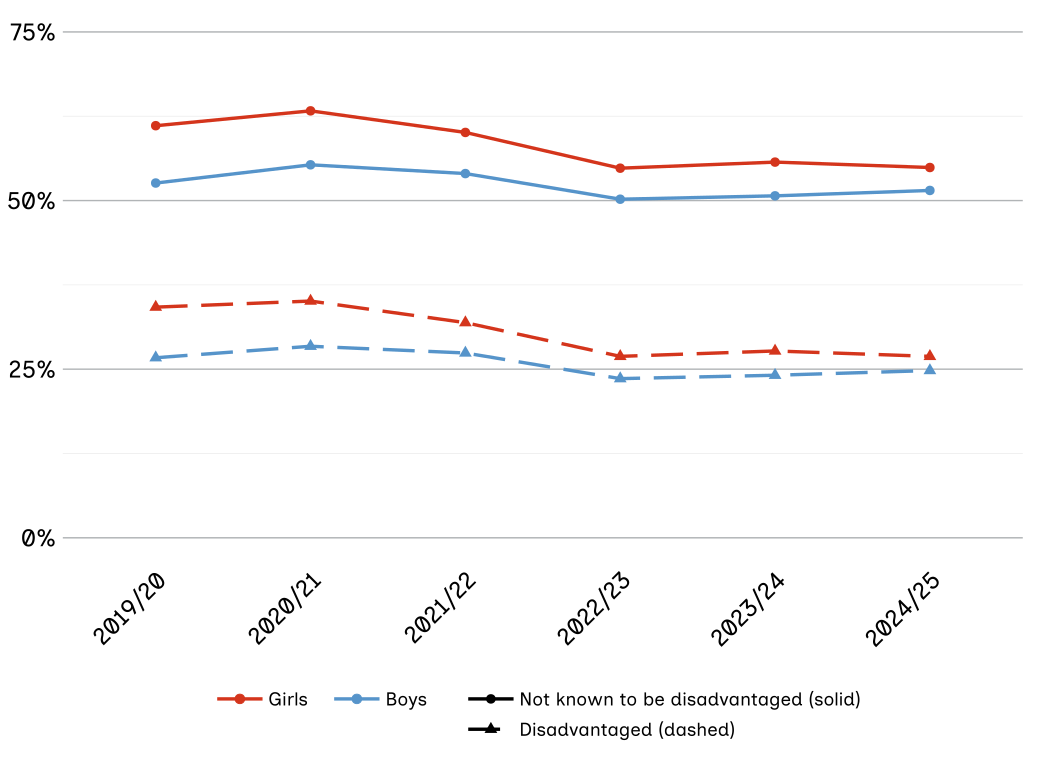
Since the pandemic, GCSE results for girls have fallen faster than for boys. Between 2020 and 2025, the share of non-disadvantaged girls achieving a grade-5 pass fell from 61% to 55% and disadvantaged girls saw a drop from 34% to 27%. For disadvantaged and non-disadvantaged boys, results were steadier, dropping by 1 or 2 percentage points.
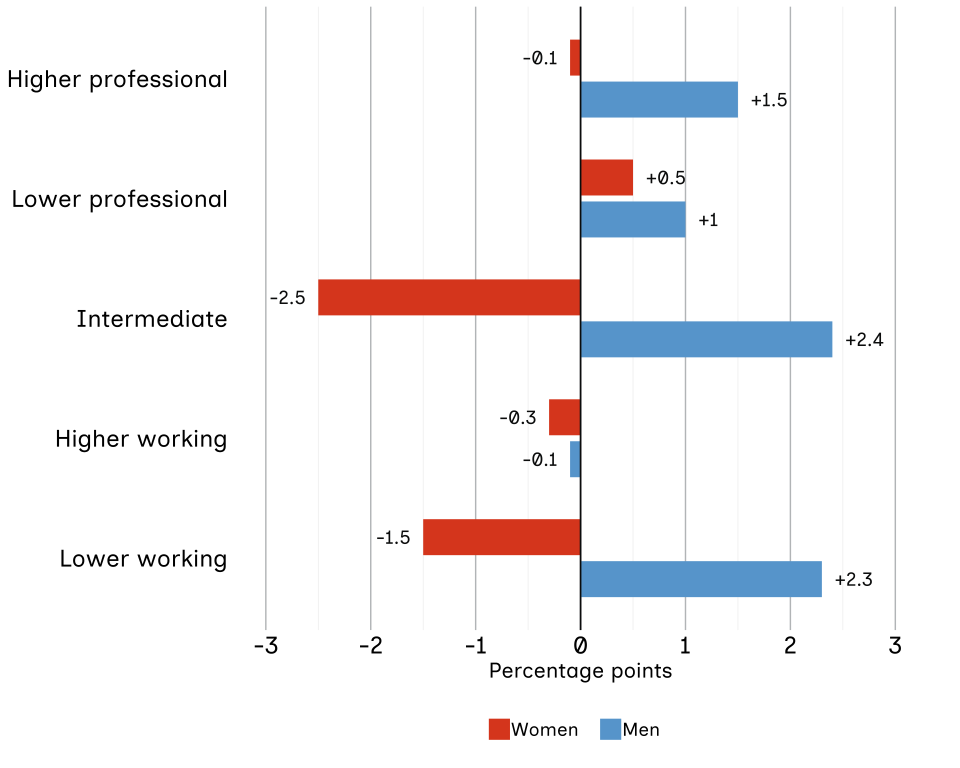
The number of young men (aged 16 to 24 years) not in education, employment or training (NEET) rose faster than the number of young women across the 2 periods: 2014 to 2019 and 2020 to 2025. Both men and women from lower working-class backgrounds are the most likely to be NEET.
Men tend to occupy the 2 extremes of the job market. They are more likely to be in higher professional roles, but also more likely to be in lower working-class roles.
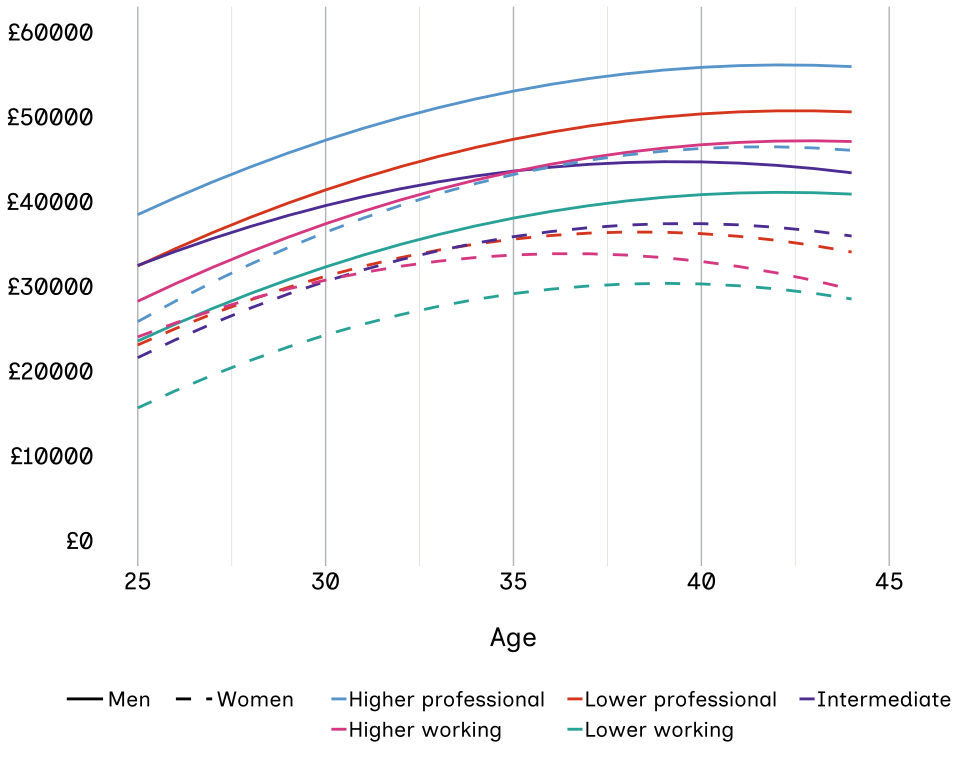
The pay gap between men and women remains a barrier because men’s earnings increase into their 40s while women’s pay flattens out much earlier. Accounting for social class, the pay gap nearly doubles between the late 20s and late 30s.
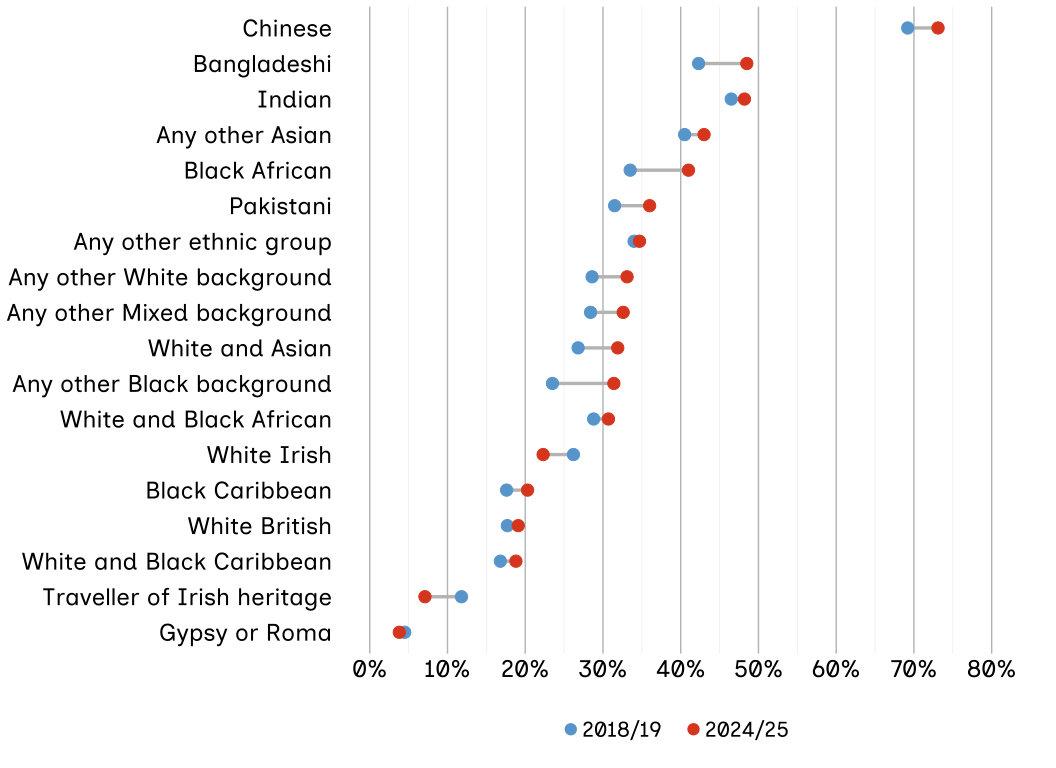
Disadvantaged pupils from Chinese, Indian and Bangladeshi backgrounds tend to get better grades than any other group. By age 16 years, nearly 73% of pupils eligible for free school meals (FSM) from the Chinese ethnic group meet the expected standard of a grade 5 or above in both GCSE English and maths, compared with just 4% of Gypsy or Roma pupils.
Young people from lower working-class homes who are Black Caribbean or White British face the highest risk of becoming NEET and degree attainment for both groups is just 19%.
People of Black African, Chinese, Indian, Other and White Other ethnic backgrounds are all significantly less likely to be NEET between age 16 and 24 years than White British people of the same SEB.
Academic success does not always lead to the same rewards at work. Young people from Bangladeshi and Pakistani backgrounds experience poorer outcomes in employment despite their classroom achievements.
Black Caribbean and Pakistani young people face a significantly higher risk of being unemployed than their White peers.
Disabled young people from disadvantaged backgrounds continue to be much more likely to be NEET and much less likely to be employed than their non-disabled peers.
The disability gap in economic activity for the lower working-class group remained large at 32 percentage points across the 2 periods (2014 to 2019 and 2020 to 2025). Non-disabled peers from lower working-class backgrounds are more than twice as likely to reach a higher professional job as their disabled peers, at 10% compared to just 4%.
Disabled people face persistent barriers to progression, with non‑disabled peers more likely to reach higher‑level jobs across all SEBs. Even when holding the same level of qualification such as a degree, disabled young people earn 8% less than their non-disabled peers.
Introduction
This chapter looks at intermediate outcomes to understand how different factors shape a person’s life chances. Intermediate outcomes measure the development a person makes from their starting point to an earlier endpoint, such as employment in their 20s or educational attainment at age 16 years, broken down by SEB. This serves as an early indicator of how their later life will turn out. By looking at these steps, we can see exactly where young people encounter barriers before they establish their main careers. To provide a deeper analysis, we also break down these metrics by 3 protected characteristics: sex, ethnicity and disability. This focus helps uncover how specific characteristics interact with socio-economic backgrounds to influence early success.
For the first time, this year’s report tracks trends over time for both sex and disability. This new approach allows us to see whether gaps are widening or narrowing across different groups. While the report also provides a detailed breakdown by ethnicity, tracking changes over time was not possible. Breaking down data into distinct ethnic groups creates a major statistical challenge: the resulting sample sizes become too small to produce reliable or meaningful estimates. Despite these data limitations, comparing the static findings across all 3 characteristics provides an essential baseline for social mobility policy.
Differences between men and women
Summary
School results do not always lead to later career success. Girls outperform boys from age 5 through to university. However, these results do not always lead to the best-paid jobs.
By their late 20s, women are more likely to hold degrees than men from the same backgrounds. Yet they often stay in lower-professional roles, such as teacher or nurse. Men tend to occupy the 2 extremes of the job market. They are more likely to reach higher-professional roles, but they are also more likely to be in routine manual roles.
The pay gap between women and men also remains a documented challenge. Men’s earnings continue to climb into their 40s, while women’s pay tends to flatten out much earlier. Education seems to protect women from unemployment, but it has not yet opened the door to the very top professional roles.
Compulsory school age attainment
At age 5 years, 79% of girls not eligible for FSM reach a ‘good level of development’. This is 7 points higher than the figure for boys in the same group. The lowest scores are for boys eligible for FSM: less than half (44%) reach the expected level.
By age 11 years, girls still lead by 6 or 7 points in reading, writing and maths. This gap has stayed roughly the same for 10 years. However, being disadvantaged has a much bigger impact than sex: there is a 20-point attainment gap between children eligible for FSM and those who are not.
By age 16 years, the gap between boys and girls is smaller. But since the pandemic, GCSE results for girls have generally fallen faster than for boys:
- for non-disadvantaged girls: results fell from 61% to 55% between 2020 and 2025
- for disadvantaged girls: results dropped from 34% to 27%
- for both disadvantaged and non-disadvantaged boys: results were steadier, only dropping by 1 or 2 percentage points
There is a 28-point attainment gap between disadvantaged girls and their non-disadvantaged peers. For boys, that gap is 27 points. As the gap between sexes closes, SEB remains an important factor associated with school success.
Figure 3.1: In the 2024 to 2025 school year, girls were more likely than boys to achieve a grade-5 pass in both GCSE English and maths regardless of their disadvantaged status.
Percentage of pupils achieving a pass (grade 5 or above) in both GCSE English and maths by disadvantage status and gender in England, between the 2019 to 2020 and 2024 to 2025 academic years.
Source: Department for Education (DfE). National curriculum assessments at key stage (KS) 4 in England, 2025.
Notes: Pupils are defined as disadvantaged if they are known to have been eligible for FSM at any point in the past 6 years (from year 6 to year 11), if they are recorded as having been looked after (in care) for at least one day or if they are recorded as having been adopted from care.
Education, jobs and training
Moving from school to work reveals more differences between young men and women. Here, we group results from 6 academic years together to get a more reliable comparison over time. When comparing the time periods 2014 to 2019 with 2020 to 2025, the number of young men (aged 16 to 24 years) who were NEET rose faster than for young women. This suggests that some young men may find it harder to access or stay in education, jobs or training places.
Figure 3.2: The number of young men who are NEET rose faster than for young women.
Percentage points change of young people aged 16 to 24 years in the UK who were NEET, by socio-economic background (SEB) and sex, between the 2014 to 2019 and 2020 to 2025 time periods.
Source: Office for National Statistics (ONS), pooled Labour Force Survey (LFS) data from 2014 to 2019 and 2020 to 2025 time periods, respondents aged 16 to 24 years in the UK.
Notes: NEET is defined as not in employment, education or training in the week before the survey. SEB refers to the main wage earner’s occupation when the respondent was aged 14 years. Where there was no earner in the family, SEB is treated as lower working class. The data used is weighted using the LFS person weights. Due to rounding errors, in some instances the totals may not add up to 100%.
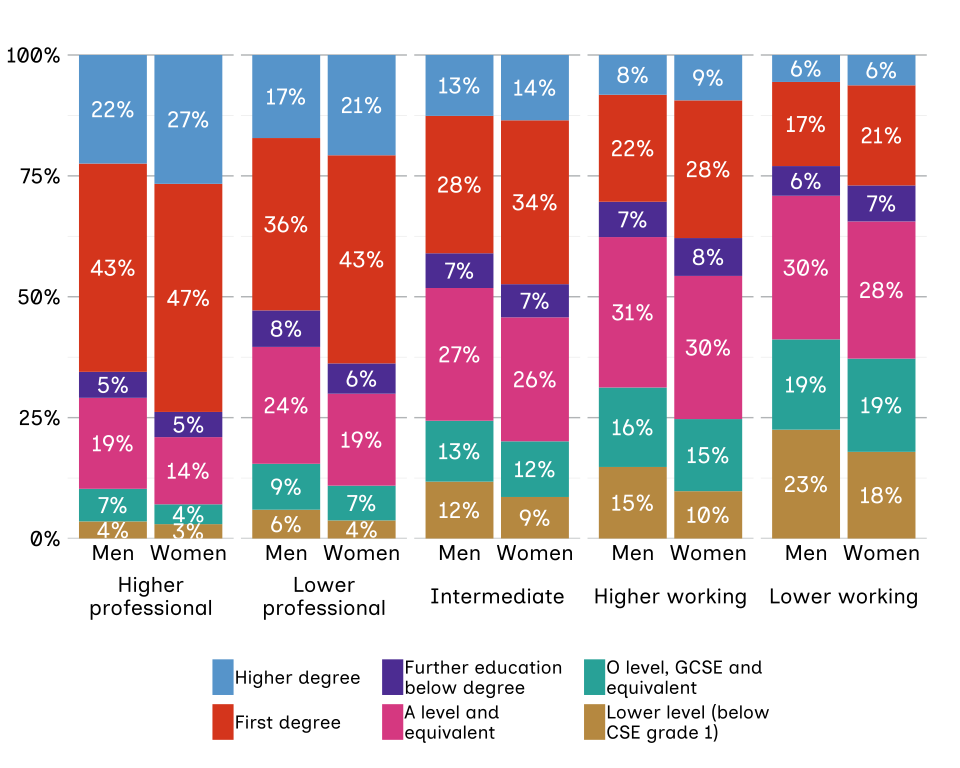
The growing gap between men and women in training and NEET rates may be feeding through to higher education (HE). Young women are more likely to have a degree than young men from the same SEB.
This gap is widest for higher professional and lower-working SEB groups. Women from higher professional backgrounds are the most qualified: 74% of them hold a degree. In contrast, men from lower working-class backgrounds have the lowest qualifications: only 23% of this group hold degrees.[footnote 1]
Figure 3.3: Within all SEBs, higher proportions of young women than young men have a first degree.
Highest level of qualification achieved by those aged 25 to 29 years in the UK, by SEB and sex, from 2014 to 2025 combined.
Source: ONS, pooled LFS data from 2014 to 2025 combined, respondents aged 25 to 29 years in the UK.
Notes: Due to rounding errors, in some instances the totals may not add up to 100%. A formal test was conducted to test for differences in degree attainment by SEB and sex. The data used is weighted using the LFS person weights.
Labour market and earnings
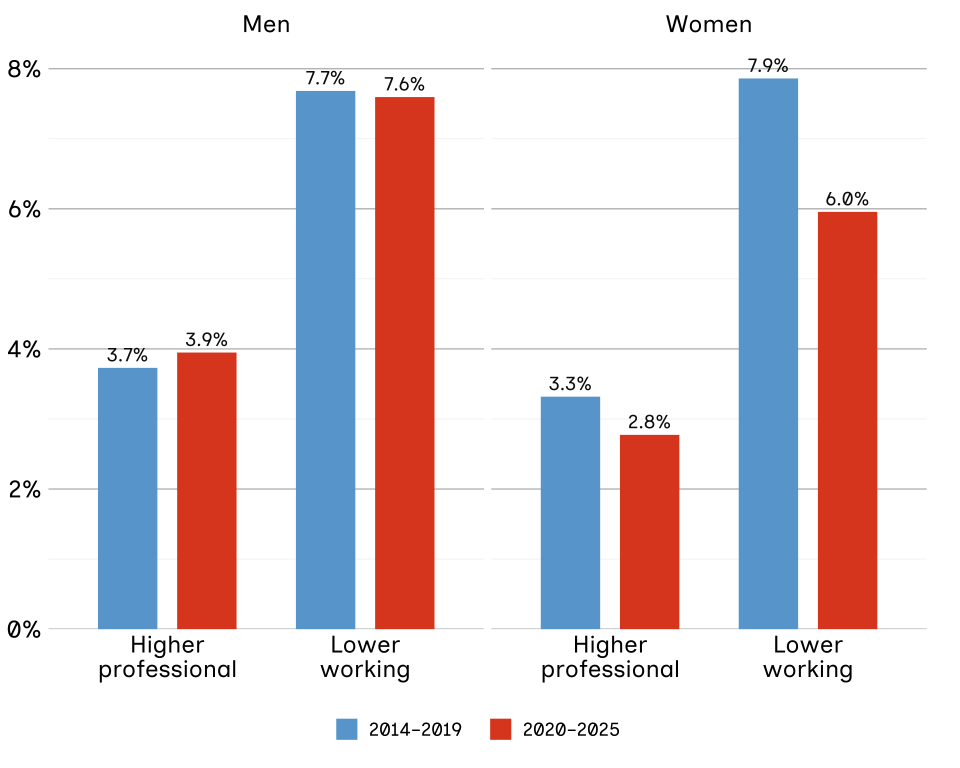
The training young people undertake early on affects the stability and type of jobs they get later. In figure 3.4 we can see a clear difference between men and women in unemployment rates. However, there is no strong statistical evidence of different trends over time for men and women. Overall, the unemployment level of people from lower working-class backgrounds is around double that of people from higher professional backgrounds.
Figure 3.4: For both men and women, unemployment has consistently been around twice as high for those of lower-working class SEB than for those of a higher professional SEB.
Percentage of young people aged 25 to 29 years in the UK who were unemployed, by SEB and sex, from the 2014 to 2019 and 2020 to 2025 time periods.
Source: ONS, pooled LFS data from the 2014 to 2019 and 2020 to 2025 time periods, respondents aged 25 to 29 years in the UK.
Notes: The unemployed are defined as those who are not in work but available and looking for work. This means that economically inactive people (people who are not working and not looking for work) are excluded from the calculation. A formal test was conducted of whether there are differences in unemployment by SEB and sex. The data used is weighted using the LFS person weights.
Women consistently do better than men in school and at university. However, women aged 25 to 29 years are still less likely than men to be in top professional jobs.
There is a distinct sex split in the workforce. Both young men and women have seen some improvements in their career levels, but young men are now more concentrated at the 2 extremes. They are more likely to be in the very highest-paid or lowest-paid roles. Women tend to be in middle-tier professional roles.
For those from the most advantaged backgrounds, the gap at the top may be growing. The proportion of men from higher professional backgrounds attaining top roles increased from 26% to 34%. For women of similar socio-economic backgrounds, the proportion rose from 19% to 25%.
Figure 3.5: Men are increasingly concentrated at both the highest and lowest levels of the occupation ladder.
Percentage of young people aged 25 to 29 years in the UK in different occupational levels, by SEB and sex, from the 2014 to 2019 and 2020 to 2025 time periods.
Source: ONS, pooled LFS data from the 2014 to 2019 and 2020 to 2025 time periods, respondents aged 25 to 29 years in the UK.
Notes: Due to rounding errors, in some instances the totals may not add up to 100%. A formal test was conducted of whether there are differences in occupational class by SEB and sex, and over time. The data used is weighted using the LFS person weights.
The pay gap
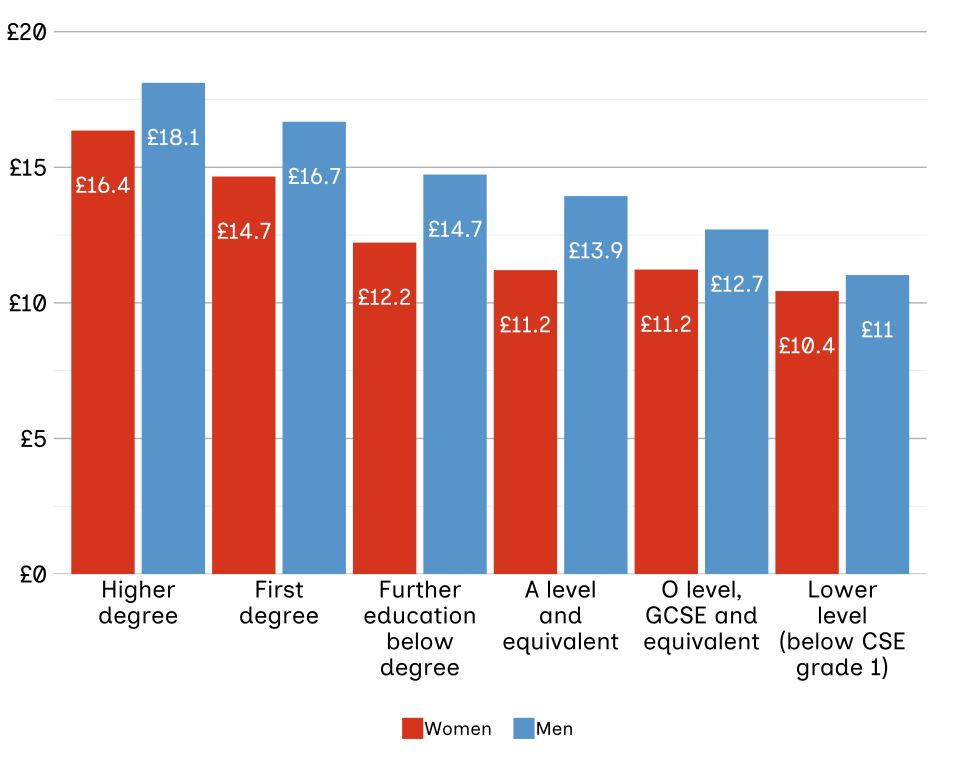
These job trends lead to differences in pay. Young women earn less than young men across all backgrounds. Even when women have the same qualifications and backgrounds as men, they earn significantly less. This gap is widest for people whose highest qualifications are A levels. In this group, women earn an average of £11.20 per hour, while men earn £13.90 per hour.
Figure 3.6: Young women earn significantly less than young men with the same qualifications and SEB.
Mean hourly earnings of young people aged 25 to 29 years in the UK by educational level and sex, controlling for SEB and age, from 2014 to 2025.
Source: ONS, pooled LFS data from 2014 to 2025 combined, respondents aged 25 to 29 years in the UK.
Notes: Earnings have been adjusted for inflation with a base year of 2025. Data is weighted using LFS income weights. For data by sex, the estimates shown are the hourly earnings of 27-year-old men and women from a lower working-class background. Data from 2014 to 2025 is combined.
Even when young people have the same qualifications and come from the same SEB, the gap between men and women remains significant. This probably reflects the different types of jobs taken up by men and women at this level. It shows that for those without high-level degrees, sex remains a major factor related to pay.
Occupation and income progression over time
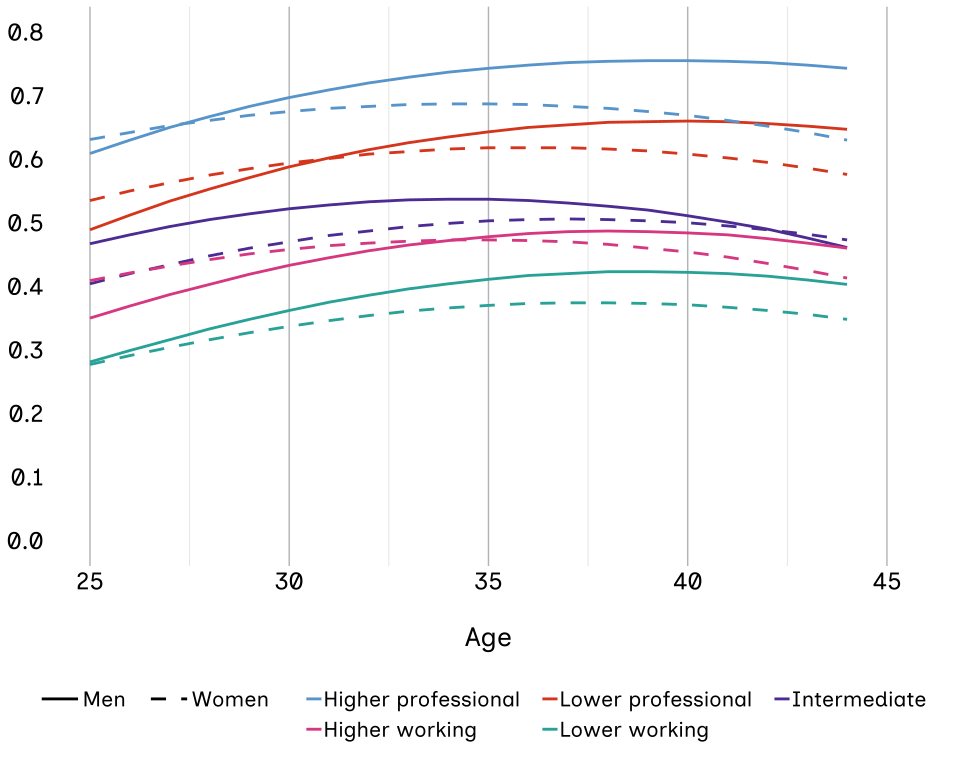
Men and women start their careers at a similar level. However, as people move from age 25 toward 44, the story changes. Men’s careers tend to grow steadily, with wage growth accelerating into their late 30s.
For women, the trend is the opposite. Between their late 30s and early 40s, the proportion of women holding professional roles is flat or may even decline. This may be due to the impact of starting a family, childcare costs and changing working patterns. While women start strong, they face much higher barriers to staying in top roles or moving up as they reach the middle of their careers.
People from lower working-class backgrounds have the lowest chance of reaching professional roles. While their opportunities might improve slightly in their 20s, as they move into their late 30s and early 40s they see a sharper decline in their progression compared to people from professional backgrounds.
Figure 3.7: Young men from higher SEBs are more likely to progress into professional occupations.
The likelihood of men and women entering the professional classes in the UK, by SEB, sex and age, from the 2023 to 2025 time period.
Source: ONS, pooled LFS data from 2023 to 2025, respondents aged 25 to 44 years in the UK in paid employment.
Notes: Estimates are derived from a logistic regression of professional employment by SEB and age controlling for survey year for individuals aged 25 to 44. Due to model revisions that now fully account for both the main effects and interaction effects between SEB and age, the results for this indicator are not directly comparable to previous years. The data is weighted using the LFS response weights.
These differences in career trajectories are reflected in earnings. While men’s pay continues to rise into their 40s, women’s pay hits a ceiling much sooner. Even after accounting for social class, the pay gap nearly doubles between the late 20s and late 30s.
Figure 3.8: On average, the annual incomes of young men from higher SEBs increase more over their working lives than those of young men from lower SEBs.
Income progression of men and women in the UK, by SEB, sex and age, from the 2023 to 2025 time period.
Source: ONS, pooled LFS data from the 2023 to 2025 time period, respondents aged 25 to 44 years in the UK in paid employment.
Notes: Estimates are derived from a linear regression of annual income by SEB and age, controlling for survey year and number of dependent children. Due to slight revisions to the model to account for the interaction between SEB and age, the results for this indicator are not directly comparable to last year’s. The data used is weighted using the LFS person weights.
Differences across ethnic groups
For this 2026 report, we looked at data across ethnic groups from 2014 to 2025. We could not compare shorter time periods (as we do for sex and disability) for different ethnic groups because the sample sizes were too small. Instead, we analysed the entire period to give the most accurate picture possible. In the future, we hope to use administrative data, such as the Office for National Statistics (ONS) Longitudinal Study (LS), to look at changes over time in intermediate outcomes for different ethnic groups.
Summary
Disadvantaged pupils from Chinese, Indian and Bangladeshi backgrounds are more likely to get degrees than their White British peers, while pupils from other ethnic backgrounds achieve similarly. Pupils from almost every minority ethnic group have higher achievement than the White British majority when we look at GCSE grades for those eligible for FSM. However, this academic success for minority ethnic groups does not always lead to the same rewards at work. There is a disconnect between what young people from some ethnic groups achieve in the classroom and their outcomes in the workplace.
Bangladeshi, Pakistani and Other ethnic groups are significantly less likely to get professional jobs and Black Caribbean and Pakistani young people face a significantly higher risk of being unemployed. These findings suggest that some of our most educationally mobile communities are still struggling to find stable, high-level work. However, young people from Indian backgrounds are the most likely to get professional jobs. This may also be true of young people from Chinese backgrounds, but the sample was too small for us to be sure.
People of Black African, Chinese, Indian, Other and White Other ethnic backgrounds are all significantly less likely to be NEET between age 16 and 24 years than White British people of the same SEB. Young people from lower working-class homes who are Black Caribbean or White British face the highest risk of becoming NEET and degree attainment for both groups is just 19%.
Disparities also show up in how much young people earn. Young people from Bangladeshi and Black Caribbean backgrounds earn significantly less than their peers from the same SEB. Young people from Chinese backgrounds generally earn more than their White British peers.
Compulsory school age
This section looks at how children from different backgrounds perform in school. Across the UK, many students from ethnic minority backgrounds now do better in school than their White British peers. The gap between the highest- and lowest-achieving groups is still very large.
The differences are clear from as early as primary school. By age 11 years, 80% of FSM-eligible children in the Chinese ethnic group meet the expected standards for their age. In contrast, only 18% of Gypsy or Roma children reach that same level.
As students move through secondary school, this divide often grows even wider. By the time they sit their exams at age 16 years, nearly 73% of FSM-eligible pupils from the Chinese ethnic group achieve the benchmark level of a grade 5 or above in both GCSE English and maths. Meanwhile, for Gypsy or Roma pupils, that figure drops to just 4%.
When looking at attainment of different ethnic groups over time, we observe that while most ethnic groups have seen their results bounce back since the pandemic, some have continued to fall behind. The biggest decline at age 11 years was seen among White Irish children, whose results dropped by 9 percentage points over the last 7 years.
Figure 3.9 shows that this downward trend is also visible at age 16 years. Between 2019 and 2025, the number of Traveller of Irish heritage pupils meeting expected standards nearly halved, falling from 12% to just 7%. White Irish and Gypsy or Roma pupils also saw their results dip during this time. The data suggests that while many groups are excelling, those who were already struggling may be finding it even harder to catch up.
Figure 3.9: There is great variation across ethnicities in the attainment of FSM-eligible pupils.
Percentage of FSM-eligible pupils achieving a strong pass (grade 5 or above) in both GCSE English and maths by ethnicity in England, from the 2018 to 2019 academic year to 2024 to 2025 academic year.
Source: DfE. National curriculum assessments at KS4 in England, 2024 to 2025.
Notes: Figures for 2024 are based on revised data. FSM eligibility is based on data collected in the school census, which records whether a child’s family has claimed eligibility. Parents are able to claim FSM if they receive certain benefits.[footnote 2]
Education and training
As young people move into adulthood, the education gap between ethnic groups remains wide. We look at degree attainment because HE is a sign of upward mobility: degrees often help young people move into professional jobs.
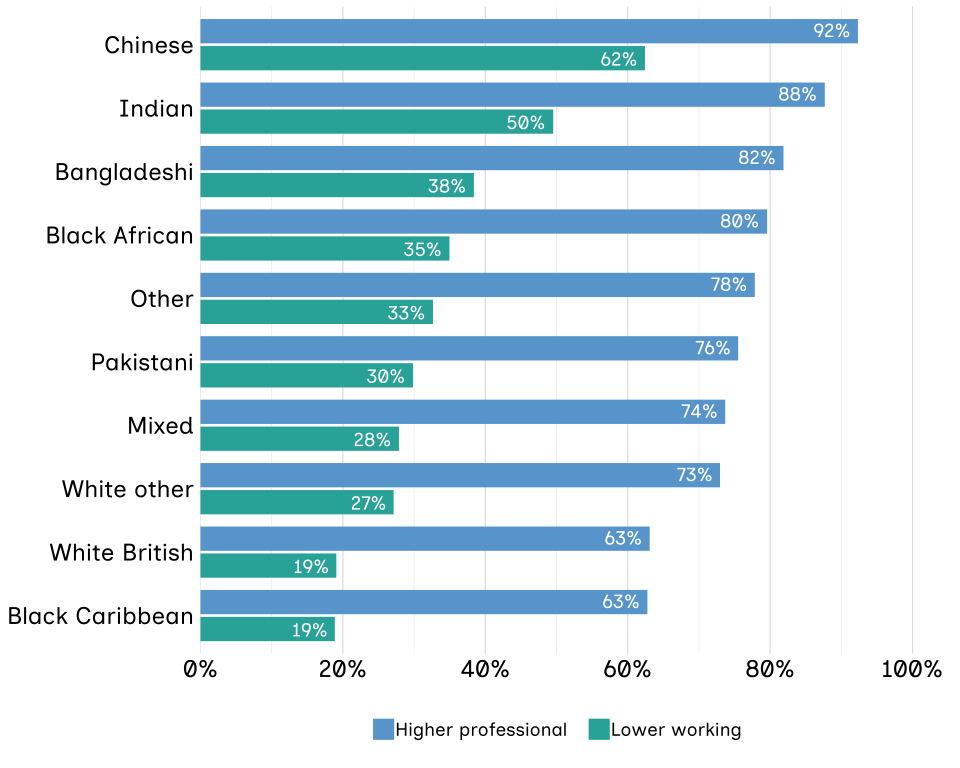
White British individuals are less likely to hold degrees than young people from Indian, Chinese and Bangladeshi backgrounds from the same SEB. White British and Black Caribbean young people from lower working-class backgrounds have the lowest levels of degree attainment of all groups, at 19%.
Figure 3.10: Students from Chinese, Indian and Bangladeshi backgrounds are significantly more likely to obtain degrees than their White British peers of the same SEB.
Percentage of young people aged 25 to 29 years in the UK from lower working-class and higher professional backgrounds who achieved a university degree, by ethnicity, 2014 to 2025 combined.
Source: ONS, pooled LFS data from 2014 to 2025 combined, respondents aged 25 to 29 years in the UK.
Notes: Because of small sample sizes, the outcome measure is simplified to whether the respondent has a university degree. The estimated percentages are derived from a logistic regression model on the likelihood of attaining a degree by ethnic group and SEB, controlling for sex.[footnote 3] The model assumes that class effects are the same within each ethnic group. The percentages shown are those for men. Percentages are shown only for those with lower working-class and higher professional backgrounds for illustrative purposes. The data used is weighted using the LFS person weights.
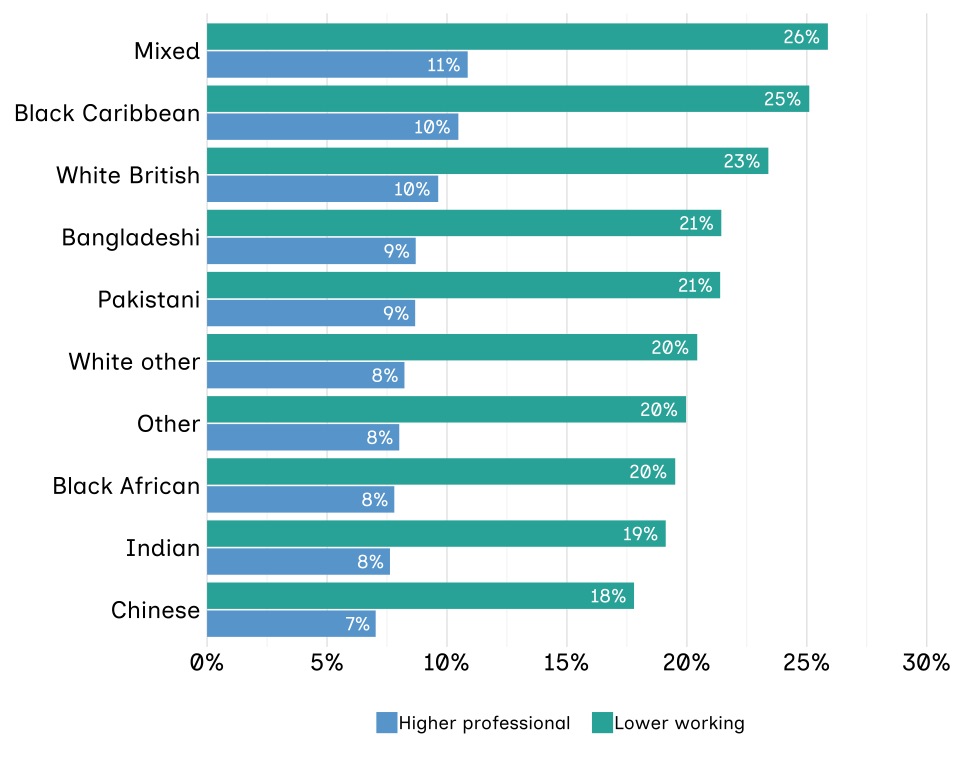
We also monitor young people who are NEET. As we noted in chapter 4, this number has risen in recent years and being NEET can lead to scarring effects on future pay and productivity.[footnote 4] When looking at this across socio-economic and ethnic backgrounds we observe that the risk of being NEET is not the same for everyone.
Figure 3.11: People of Black African, Chinese, Indian, Other and White Other ethnic backgrounds are all significantly less likely to be NEET between the ages of 16 and 24 years than White British people of the same SEB.
Percentage of young people aged 16 to 24 years in the UK who were NEET, by SEB and ethnicity, 2014 to 2025 combined.
Source: ONS, pooled LFS data from 2014 to 2025, respondents aged 16 to 24 years in the UK, data collected from July to September each year.
Notes: NEET is defined as not in employment, education or training in the week before the survey. The estimated percentages result from a logistic regression model on the likelihood of being NEET by ethnic group and SEB, controlling for sex. The model assumes that class effects are the same within each ethnic group. The estimated percentages are those for men. Percentages are shown only for those with lower working-class and higher-professional backgrounds for illustrative purposes. The data used is weighted using the LFS person weights.
Labour market and earnings
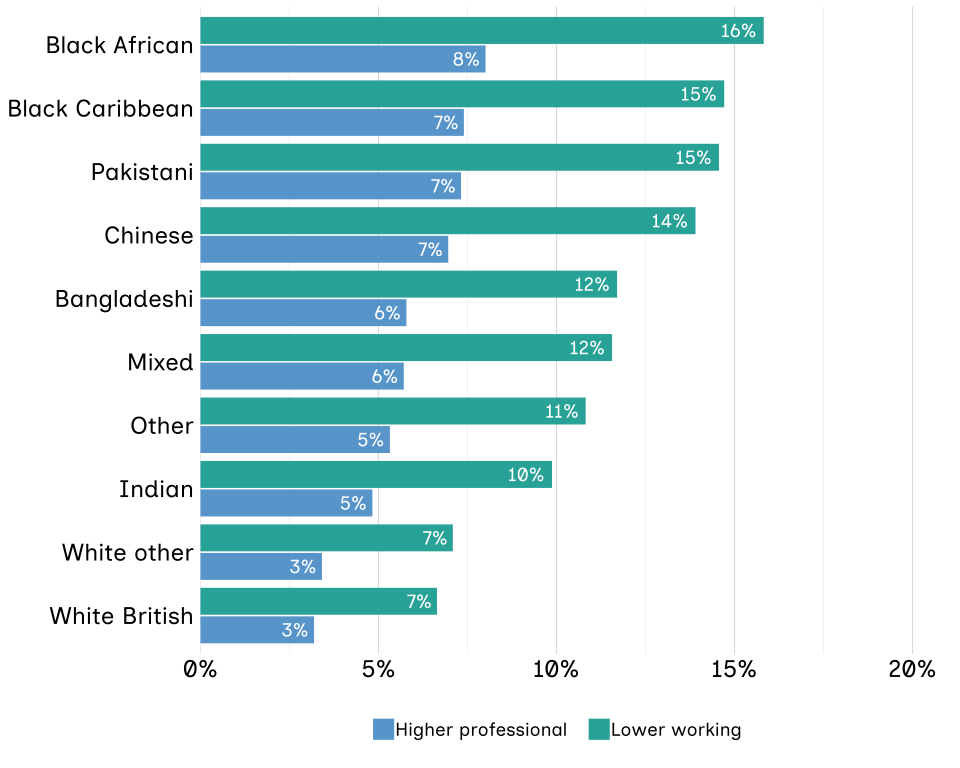
Young people from lower working-class backgrounds, and those from Black Caribbean and Pakistani backgrounds, have the highest rates of unemployment.[footnote 5] White British young people from higher-professional backgrounds have among the lowest unemployment rates (3%).
Figure 3.12: Almost every ethnic minority group faces a higher risk of unemployment compared with White British people when controlling for SEB.
Percentage of young people aged 25 to 29 years in the UK who were unemployed, by SEB and ethnic group, from 2014 to 2025 combined.
Source: ONS, pooled LFS data from 2014 to 2025 combined, respondents aged 25 to 29 years in the UK.
Notes: The estimated percentages result from a logistic regression model on the likelihood of being unemployed by ethnic group and SEB, controlling for sex. The model assumes that class effects are the same within each ethnic group. The estimated percentages are those for men. Percentages are shown only for those with lower working-class and higher professional backgrounds for illustrative purposes. The data used is weighted using the LFS person weights.
Occupational level
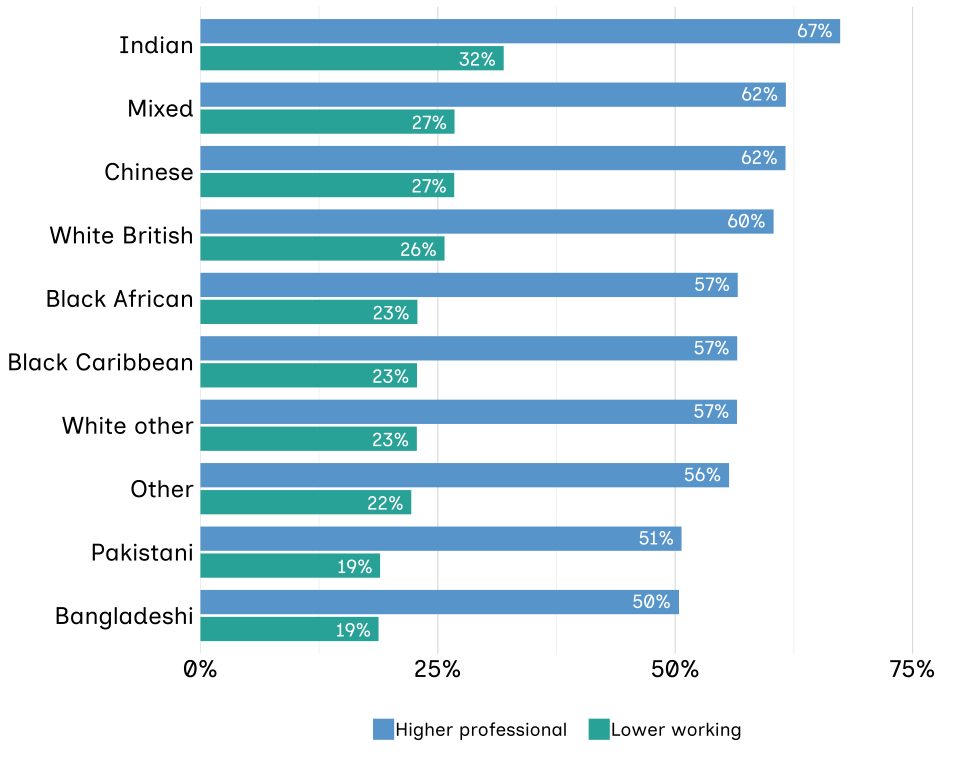
Indian young people aged 25 to 29 years are the only group that is statistically more likely to secure professional roles than their White British peers.[footnote 6] Young people from Bangladeshi, Pakistani and Other backgrounds find it much harder to break into professional roles.
Figure 3.13: Compared with their White British peers, people of Indian background are more likely to get professional jobs.
Percentage of young people aged 25 to 29 years in a professional occupation in the UK, by ethnicity and SEB, 2014 to 2025 combined.
Source: ONS, pooled LFS data from 2014 to 2025, respondents aged 25 to 29 years in the UK.
Notes: Because of small sample sizes, the outcome measure in the formal test is whether the respondent has a professional occupation (either higher or lower professional class). The estimated percentages are derived from a logistic regression model on the likelihood of being in a professional occupation by SEB and ethnic group, controlling for sex. The model assumes that class effects are the same within each ethnic group. The estimated percentages are those for men. Percentages are shown only for those with lower working-class and higher professional backgrounds for illustrative purposes. The data used is weighted using the LFS person weights.
Earnings and income
This final section looks at the ethnicity pay gap. We measure income because it is a key part of our social mobility framework. In our 2022 report, we explained that financial stability allows people to invest in their own future and in their children’s futures.
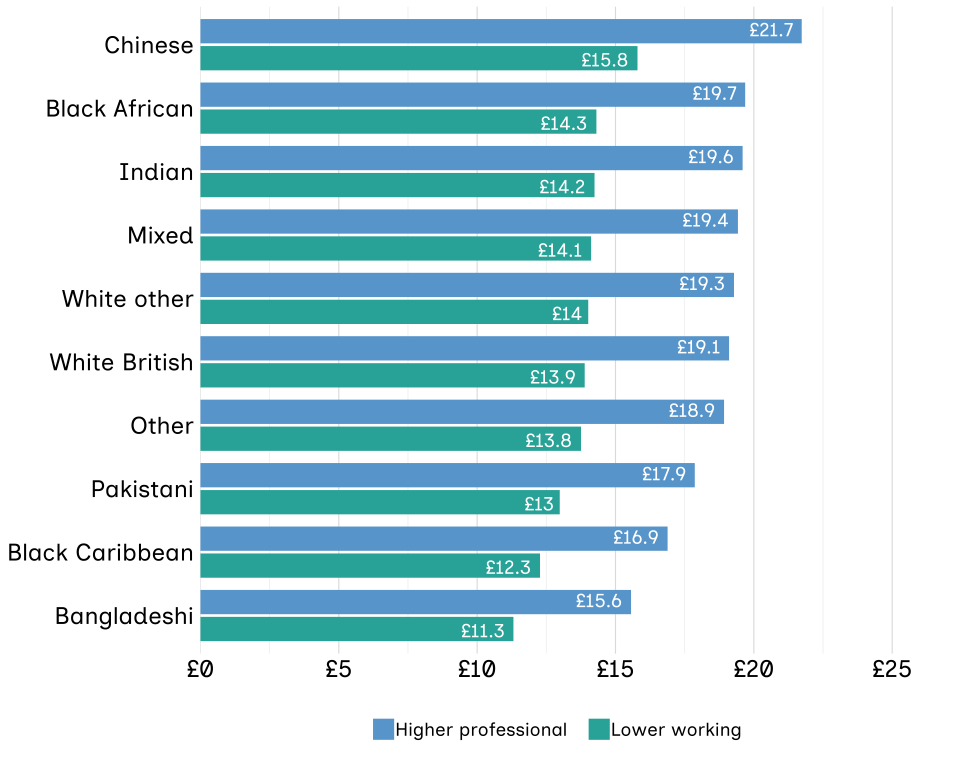
While small sample sizes prevent us from making claims about all ethnic groups, we see that young people from Bangladeshi and Black Caribbean backgrounds earn significantly less than their White British counterparts from the same SEB; while those from Chinese backgrounds, however, earn significantly more.[footnote 7]
We also find, consistently with previous years, that young people from higher professional homes earn more than those from lower working-class homes. This remains true regardless of the qualifications the individual has achieved.
Figure 3.14: Young people from Bangladeshi and Black Caribbean backgrounds earn significantly less than their peers from the same SEB. Young people from Chinese backgrounds earn significantly more.
Average (mean) hourly earnings of people aged 25 to 29 years in the UK, by SEB and ethnicity, 2014 to 2025 combined.
Source: ONS, pooled LFS data from 2014 to 2025, respondents aged 25 to 29 years in the UK.
Notes: Self-employed respondents and those without earnings are excluded. Earnings have been adjusted for inflation with a base year of 2025. For data by ethnicity, the percentages shown are those for men. Percentages are shown only for those with lower working-class and higher professional backgrounds for comparison, but all SEBs were included in the analysis.
Differences by disability status
Our 2026 analysis shows that disabled young people continue to face significant barriers across education and work. These challenges often start early and continue throughout their careers. To understand this, we compared 2 periods: 2014 to 2019 and 2020 to 2025. This comparison helps us see where the disability gap is narrowing and where it is widening.[footnote 8]
The Labour Force Survey uses 2 standard harmonised questions from the Government Statistical Service to determine whether a respondent is disabled:
-
“Do you have any physical or mental health conditions or illnesses lasting or expected to last 12 months or more?”
-
“Does your condition or illness/do any of your conditions or illnesses reduce your ability to carry out day-to-day activities?”
If an individual answers “yes” to both questions, they are classified as disabled.
Summary
The findings show a complex story of progress and persistent gaps. More disabled young people are now gaining university degrees. For those from the lower working SEB, the proportion in education or training rose from 28% to 36% between 2014 to 2019 and 2020 to 2025. However, disabled young people from disadvantaged backgrounds continue to be much more likely to be NEET and much less likely to be employed than their non-disabled peers. In the workplace, the gap in economic activity remains at 32 percentage points for those from the lowest SEBs. Even with the same degrees, disabled young people earn 8% less than their non-disabled peers. These results show that disability and background may limit a person’s chances of moving up in their career.
Education and training
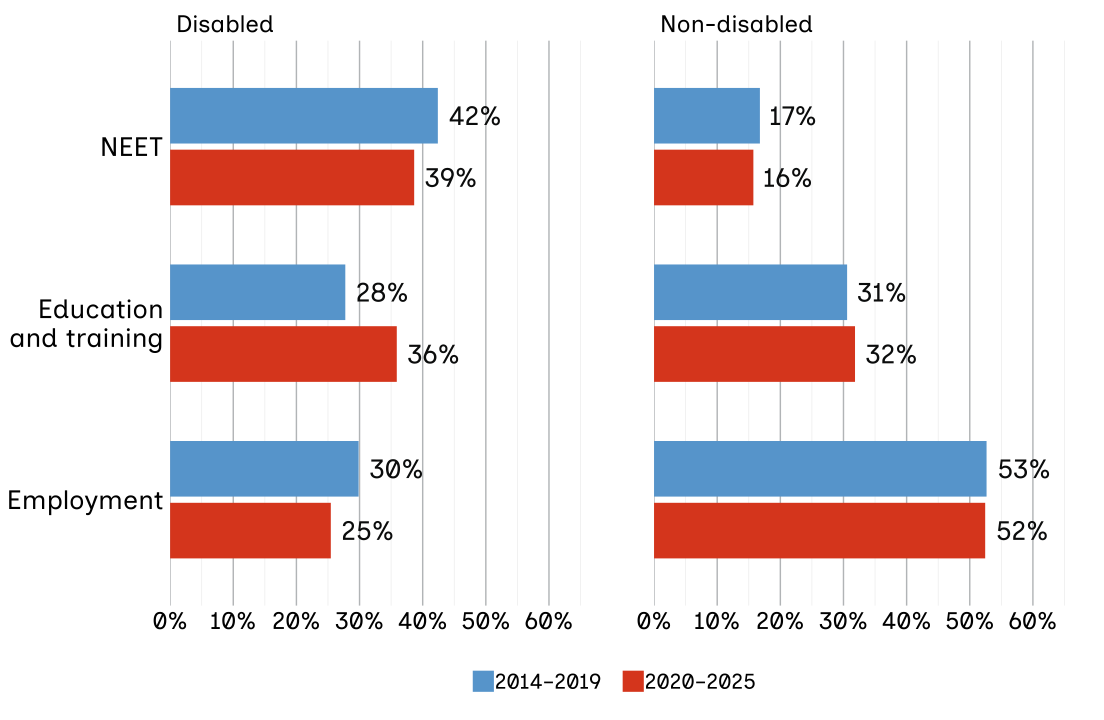
There is some positive news in education. Disabled young people are now staying in school or training for longer. Figure 3.15 shows that between 2014 to 2019 and 2020 to 2025, more disabled people from lower working backgrounds entered education and training. This group saw a large 8-percentage-point increase, from 28% to 36%. By contrast, non-disabled people from the same background only saw a 1-percentage-point increase. This suggests that more disabled young people are using education to improve their options. However, disabled young people from disadvantaged backgrounds continue to be much more likely to be NEET and much less likely to be employed than their non-disabled peers.
Figure 3.15: Disabled young people from disadvantaged backgrounds continue to be much more likely to be NEET and much less likely to be employed than their non-disabled peers.
Percentage of young people aged 16 to 24 years from lower working-class backgrounds in the UK who were in education, employment or training and those who were NEET, by SEB and disability status, from 2014 to 2019 and from 2020 to 2025 time periods.
Source: ONS, pooled LFS data from the 2014 to 2019 and 2020 to 2025 time periods, respondents aged 16 to 24 years in the UK.
Notes: We use the LFS variable DISEA (disability status). This provides a measure of disability consistent with the Equality Act. The survey asks whether the respondent has a health condition or illness lasting 12 months or more (or both), and whether that condition reduces their ability to carry out day-to-day activities (for details see the LFS user guide volumes 3 and 4). The data used is weighted using the LFS probability weights.
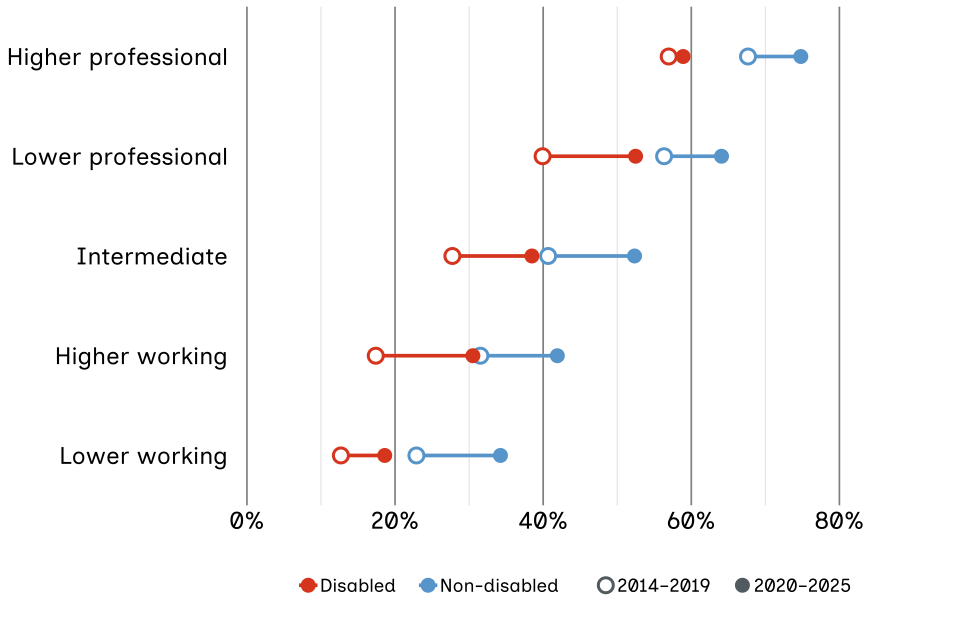
University degree attainment has also risen for disabled individuals across every SEB. However, a gap remains. We observe in figure 3.16 that non-disabled peers are often advancing even faster, which means the overall gap in qualifications is not always closing.
Figure 3.16: While there has been educational progress for both groups, disabled young people remain less likely than their non-disabled peers to gain higher levels of qualification.
Percentage of people aged 25 to 29 years in the UK achieving degree qualifications, by SEB and disability status, 2014 to 2019 and 2020 to 2025 combined.
Source: ONS, pooled LFS data from the 2014 to 2019 and 2020 to 2025 time periods, respondents aged 25 to 29 years in the UK.
Notes: A formal test was conducted to test for differences in degree attainment by SEB and disability. The data used is weighted using the LFS person weights.
The transition to work
While education trends are improving, the move into the workplace is more difficult. Disabled young people are less likely to be economically active and in employment than those without a disability.
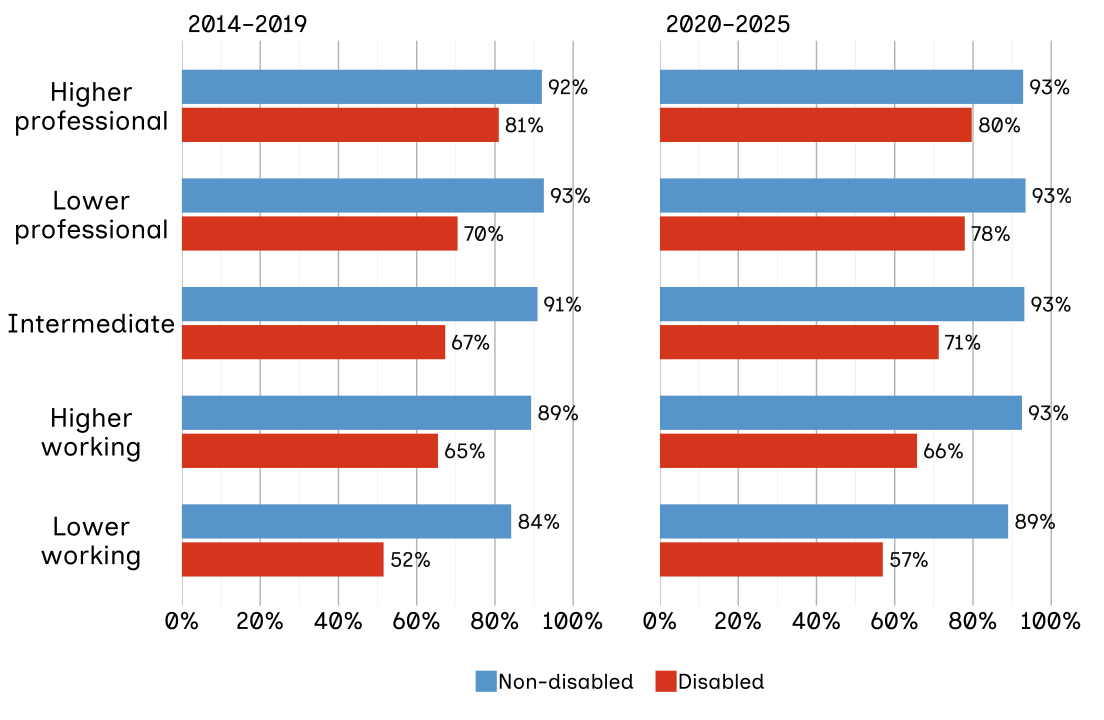
Economic activity rates have shown some growth. Disabled people from lower professional backgrounds saw their activity rates rise from 70% to 78% (see figure 3.17). This helped narrow the disability gap for that group from 23 to 15 percentage points.
But for those from lower working-class backgrounds, the picture is different. The disability gap in economic activity for this group stayed at 32 percentage points across both periods. This suggests that young people who are both disabled and from a lower working SEB may face the most persistent barriers to entering the workforce.
Figure 3.17: The disability gap in economic activity not only remains but is widening significantly over time.
Percentage of young people aged 25 to 29 years in the UK who were economically active, by SEB and disability, for the 2014 to 2019 and 2020 to 2025 time periods.
Source: ONS, pooled LFS data from the 2014 to 2019 and 2020 to 2025 time periods, respondents aged 25 to 29 years in the UK.
Notes: The economically active are those who are either in work or who are available for and actively looking for work. We use the LFS variable DISEA. This provides a measure of disability consistent with the Equality Act. It also takes account of whether the respondent has a health condition or illness lasting 12 months or more (or both) and whether that condition reduces ability to carry out day-to-day activities (for details see LFS user guide volumes 3 and 4). A formal test was conducted of whether there are differences in economic activity by SEB and disability status. The data used is weighted using the LFS person weights.
Barriers in the workplace
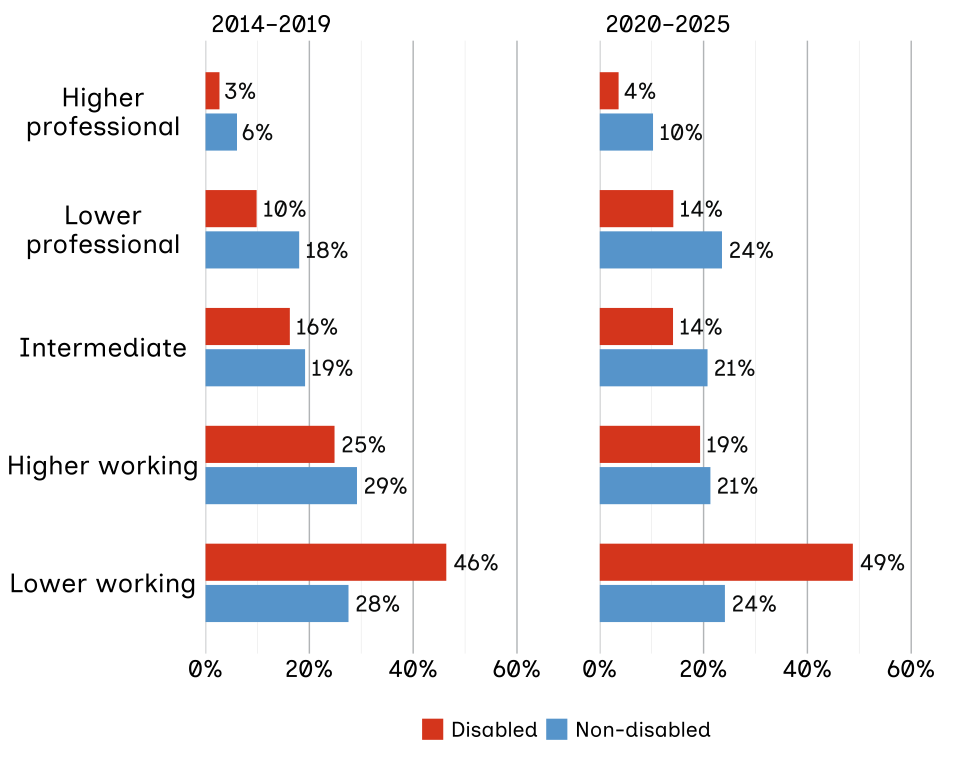
Once in work, disabled people are less likely to reach the highest-level jobs and are paid less. In 2020 to 2025, non-disabled people from lower working SEBs were more than twice as likely to reach a higher professional job as their disabled peers (around 10% versus 4%).
Figure 3.18 shows that, in 2020 to 2025, 68% of disabled people from a lower working-class background remained in working-class jobs, whereas only 45% of their non-disabled peers stayed in those same roles. This 23 percentage point disability gap in 2020 to 2025 has increased from a 14 percentage point gap in 2014 to 2019, although the increase is not statistically significant.
Figure 3.18: Non-disabled people from lower working-class backgrounds are now more than twice as likely to be in higher professional roles than disabled peers.
Percentage of young people aged 25 to 29 years in the UK from lower working-class background, by occupation level and disability status, from the 2014 to 2019 and 2020 to 2025 time periods.
Source: ONS, pooled LFS data from the 2014 to 2019 and 2020 to 2025 time periods, respondents aged 25 to 29 years in the UK.
Notes: Due to rounding errors, in some instances the totals may not add up to 100%. We use the LFS variable DISEA. This provides a measure of disability consistent with the Equality Act. It considers whether the respondent has a health condition or illness lasting 12 months or more (or both) and whether that condition reduces the ability to carry out day-to-day activities. A formal test was conducted of whether there are differences in occupational class by SEB and disability. The data used is weighted using the LFS person weights.
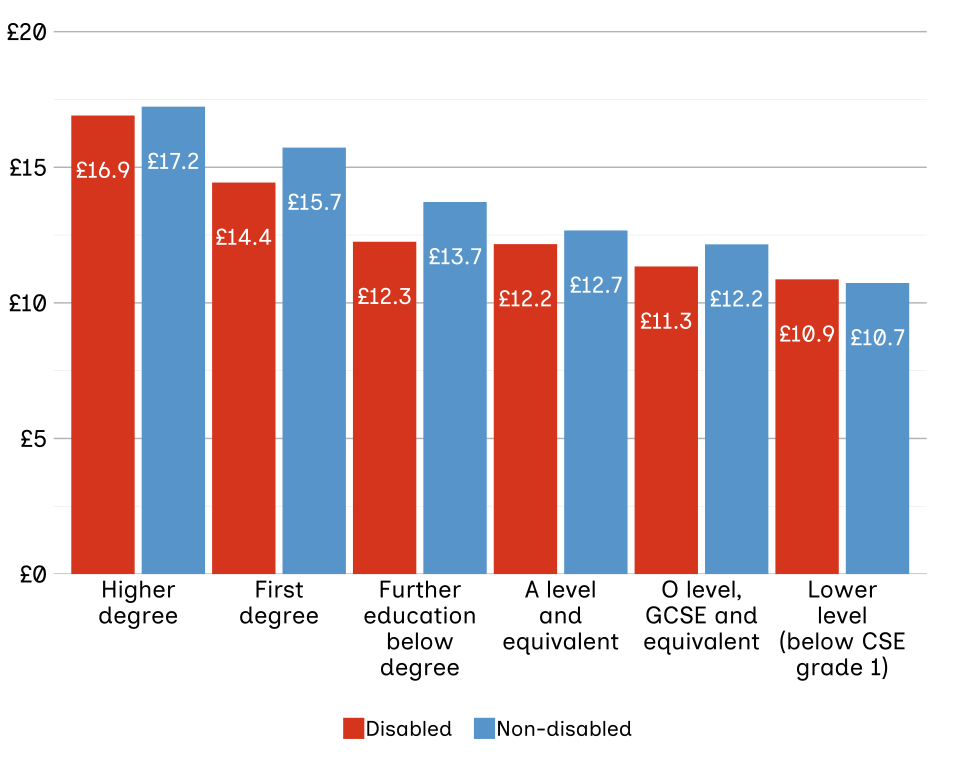
In terms of pay, disabled people aged 25 to 29 years earn significantly less than those without a disability. Even with the same undergraduate qualifications, disabled young people earn 8% less than their non-disabled peers.
Figure 3.19: Disabled young people earn less than their non-disabled peers with the same qualifications.
Average (mean) hourly earnings of young people aged 25 to 29 years in the UK, by educational level and disability status, controlling for SEB and age, 2014 to 2025 combined.
Source: ONS, pooled LFS data from 2014 to 2025, respondents aged 25 to 29 years in the UK.
Notes: Earnings have been adjusted for inflation with a base year of 2025. Data is weighted using LFS income weights. For data by year and disability, the estimates shown are the hourly earnings of 27-year-old men from a lower working-class background. Data by disability is combined from 2014 to 2025. Among people with a disability, those in work are a more selective group because their inactivity rate is higher. Controls for education level, age and SEB were included to test whether the pay gap between disabled and non-disabled young people is statistically meaningful. The difference was highly significant, indicating that a disability pay gap exists even among peers with the same qualifications and backgrounds.
Conclusions
The findings in this chapter reveal a striking pattern across multiple protected characteristics: strong performance in school and higher education does not necessarily lead to high professional or well-paid jobs. Young women, some ethnic minority groups and disabled young people have strong educational outcomes that are not reflected in their later occupational or earnings outcomes. This pattern is consistent with barriers beyond educational attainment, although the analysis does not identify the reasons for this.
For instance, young women consistently outperform young men in education from early childhood through to university. By their late 20s, they are far more likely to hold degrees than men from the same backgrounds. Despite this classroom success, young women remain disproportionately concentrated in lower professional roles, while men are far more likely to reach higher-professional occupations.
Despite achieving strong results at school and university, young people from Bangladeshi and Pakistani backgrounds face significantly poorer employment and pay outcomes than their White British peers.
Finally, once in the workplace, disabled graduates earn 8% less than non-disabled peers with the same qualifications.
Case studies
Aaron Winfield, age 22, Chesterfield, Derbyshire

I had a very broken childhood. I grew up with my mum, her partner, my little brother and sister. Nobody worked. What money we had as a family was spent down the pub. I didn’t have many good role models around me and felt I had to grow up before I should have.
I didn’t know where I wanted to go in life and I took a lot of my frustration out at school. I only had 43% attendance one year due to exclusions. I didn’t want to be in lessons and wasn’t interested. I just didn’t care.
At age 13 years, I was sent to Engineered Learning for one day a week, an organisation that delivers welding and construction programmes to young people. It was a bit like the system was saying, ‘this is your last chance’. It soon turned into 3 days a week, because I actually turned up. It was the one thing I didn’t mind getting up in the morning for. The more time I spent there, the better I got at school.
I finally had good role models. I was learning a trade, getting drive and being good at something. As well as learning practical skills with my hands, I was learning skills for life. How to conduct myself and treat others in the workplace, how to be a responsible citizen, how to be a good working person. We worked in small groups and it was very catered to the help you needed. A lot of the time, I needed somebody there, not looking over my shoulder, but being supportive. Someone who could sit there and listen, who had been through similar stuff.
Dan was our instructor, but he was also like a counsellor to us. The guy you spoke to, whether opening up about personal issues or about your troubles in school. He very quickly knew pretty much everything about me. Although he had an authority role, which was what I needed, there was also a shared respect. He was more invested than any teacher I’d met.
Dan helped me line my first job up and got me my first interview which led to a welding job. At the start, he would come to my work once a week and make sure I wasn’t mucking about. I then progressed into structural welding which involved working on bridges and gas tanks. My work became my passion and I was taking home good money.
With welding there’s a lot to learn and when I do something, I want to do it to the very best of my ability. I worked hard at being the best I could at welding and I’ve now launched my own business. Dan inspired me and showed me if I have a passion for something, I can make it work.
I now have a family of my own which has given me a new security in life having lived independently since I was aged 17 years. My son wants for nothing, he doesn’t go to nursery hungry, he has a full packed lunch every day. I don’t have to walk around the shop saying, “we can’t afford that, mate”. A lot of how I father my children derives from Dan, he was my mentor for some of the most crucial years of my life at age 13 years.
I have people walk through my door now that struggle to find work. Some people don’t have the drive and some struggle in dead-end jobs, which I’d struggle to have the drive in. But discovering a passion and having a mentor like Dan, who can teach you the skills and attitude needed for a job, will mean you’ll never be unemployed.
Sabrina Cohen-Hatton, age 43, London
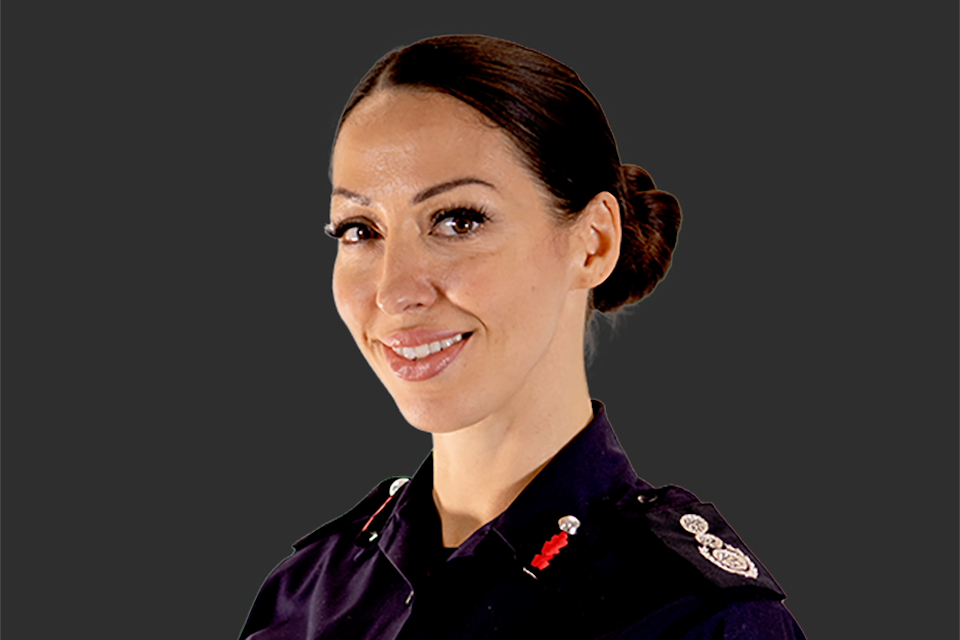
My upbringing was tricky. We grew up in poverty after my dad died and my mum found it really hard to cope and struggled with her mental health. My parents had run a pizzeria, but after my dad died and the recession hit, my mum lost the business, so we grew up on benefits. We were on the at-risk register for years and had social workers back and forth.[footnote 9]
When I was 15 years old, home became too volatile and I ended up sleeping rough on the streets of Newport. I still went to school, partly because I wanted to hide the fact that I was homeless. Academically I was good, which at least helped me feel like I could achieve something. But behaviour-wise I was a nightmare, which isn’t a surprise given what I was dealing with. When you’re raised by a caregiver who loves you but doesn’t have the means to look after you, you’re trained to see every kind of authority figure through a lens of mistrust.
When not at school, I was sleeping in the doorways of shops, a derelict church and empty buildings wherever I could. Financially it was really tough for me because there was limited help available due to my age. I was entitled to £15 a fortnight as a bridging allowance. I couldn’t access any council housing as they deemed me voluntarily homeless regardless of why I’d left, so I started selling the Big Issue.
I found a small village, Monmouth, about an hour away where no one else was selling and I would sit there with a stack of magazines from 7 in the morning until 7 at night until I’d sold them all. Eventually, after a very difficult period on and off the streets, not having a stable place to sleep and even experiencing violence, I saved up enough to put a small deposit on a cheap rented flat in the South Wales Valleys. That’s when I started to think about the fire service, I think I wanted to help people in the way no one helped me.
When I started, I was the seventh woman in a workforce of 1,700. Nationally, less than 1% of operational firefighters were women. I started as a part-time firefighter and since then I’ve worked across a range of roles and climbed the ladder – working as a watch manager, community safety official, station commander, government adviser, deputy assistant commissioner.
My first chief fire officer appointment was in West Sussex. I took over the service following a difficult inspection and led [it] through significant improvements over 6 years.
Moving on from my past wasn’t easy, poverty is not something you can wash off your skin. Believing you have worth after feeling deeply dehumanised on a daily basis is incredibly hard – I’d been abused more times than I care to remember. While chief fire officer I would look at other leaders, who didn’t seem to have the same vulnerabilities and would feel I was different.
The game changer for me has been finding the courage to talk about my experiences openly. Since opening up, so many people have got in touch with me to say they’ve been through something similar and it’s made a real difference. It’s important that people who’ve achieved upward social mobility speak about it openly because it helps others see what’s possible. I’m a big believer that if you can see it, you can be it. It’s also important to think about how you target your opportunities. For example, unpaid internships are not going to be accessible to someone who doesn’t have a financial safety net and needs to earn to stay afloat. Employers’ encouraging staff networking groups that consider things like social mobility are so helpful for people to come together and speak about their experiences.
The amazing thing about the fire service is that it offers incredible career paths where you can join on the first rung of the ladder and work your way to the very top. I didn’t think, “I want to be a chief one day,” but each time I took a step and succeeded, I felt ready to take the next one.
-
Formal statistical testing showed no significant differences between the 2014 to 2019 and 2020 to 2025 periods. Therefore, we have combined 2014 to 2025 data to provide more reliable estimates. ↩
-
See DfE guidance for more information on FSM eligibility, ‘Early years foundation stage profile results’, 2023. Published on GOV.UK. ↩
-
The model shows that young people from most ethnic backgrounds are significantly more likely to have a degree than young people from a White British background. ↩
-
ONS, ‘Young people not in education, employment or training (NEET), UK: May 2026’. Published on ONS.GOV.UK. ↩
-
Although the chart shows a 16% unemployment rate for young people from Black African backgrounds, this is based on a small sample size and is not statistically significant. It is therefore omitted from the main text findings. ↩
-
Although the chart shows that 62% of young people of Chinese and Mixed background from professional backgrounds are in higher-professional roles, this is based on a small sample size and is not statistically significantly higher than the White British group. It is therefore omitted from the main text findings. ↩
-
Although the chart shows that earnings for young people of different ethnic backgrounds are slightly higher (Indian) or lower (Pakistani) than earnings for White British young people, this is based on a small sample size and is not statistically significant. It is therefore omitted from the main text findings. ↩
-
In this chapter we refer to the disability gap as the percentage points (or pounds when talking about earnings) difference between the non-disabled and disabled groups. ↩
-
In social care settings, local authorities may keep an at‑risk register for: children on child protection plans, adults with care and support needs, people at risk of domestic abuse, people at risk of homelessness, and individuals vulnerable due to disability, mental illness or exploitation. ↩