Chapter 2: Long-term trends of social mobility outcomes
Published 29 October 2026

© Crown copyright 2026
This publication is licensed under the terms of the Open Government Licence v3.0 except where otherwise stated. To view this licence, visit nationalarchives.gov.uk/doc/open-government-licence/version/3 or write to the Information Policy Team, The National Archives, Kew, London TW9 4DU, or email: psi@nationalarchives.gov.uk.
Where we have identified any third party copyright information you will need to obtain permission from the copyright holders concerned.
This publication is available at https://www.gov.uk/government/publications/state-of-the-nation-2026-whos-getting-ahead/chapter-2-long-term-trends-of-social-mobility-outcomes
Highlights
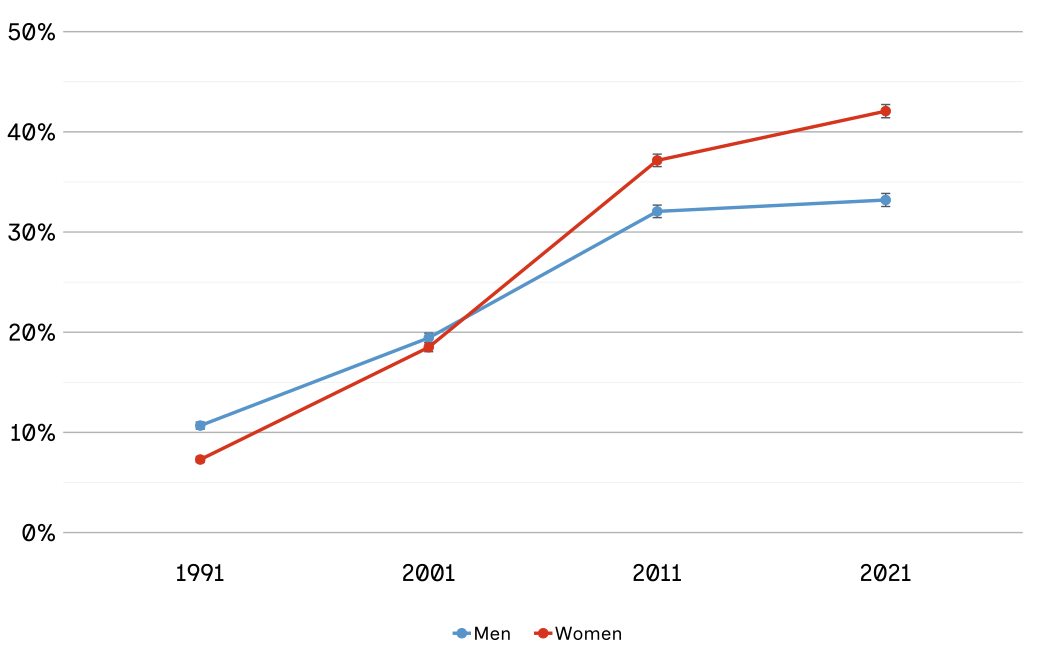
Upward educational mobility increased steadily from 1991 to 2011. The rate of degree attainment among men aged 28 to 37 years from non-graduate families rose from 11% in 1991 to 32% in 2011 and from 7% to 37% for women. However, the rate of increase then slowed: upward educational mobility was 33% for men and 42% for women in 2021.
Relative educational mobility improved both in the first decade analysed (1991 to 2001) and in the most recent (2011 to 2021). In other words, parents going to university (or not) seems to have had less influence on children’s chances of doing so.
Upward occupational mobility from the working class to the professional class increased considerably, especially between 1991 and 2001. Among early-career individuals aged 28 to 37 years, 25% of men and 20% of women experienced this long-range upward mobility in 1991, rising to 34% and 36% in 2011. It has continued to increase slowly over the last decade, reaching 36% and 38% in 2021.
Relative occupational mobility has improved among early-career people aged 28 to 37 years, but has shown little change among people aged 38 to 47 years in mid-career. This means that the strength of the link between parents’ occupational class and their children’s occupational class has stayed fairly steady.
The calculations of income mobility from the Office for National Statistics Longitudinal Study (ONS-LS) are better called occupational-wage mobility. This is because we cannot measure income directly in the ONS-LS. Instead, we can analyse ‘occupational wages’, which are the average wages for each occupation and are estimated indirectly from other data sources. This measure does not include non-salary income.
Relative occupational-wage mobility among early-career men and women worsened notably up until 2001, but improved in the most recent decade. However, relative occupational-wage mobility for young women remains significantly worse than it was in 1991. So parents’ wages now predict young women’s wages more strongly than they did in 1991. Relative occupational-wage mobility among mid-career men and women also decreased between 1991 and 2011.
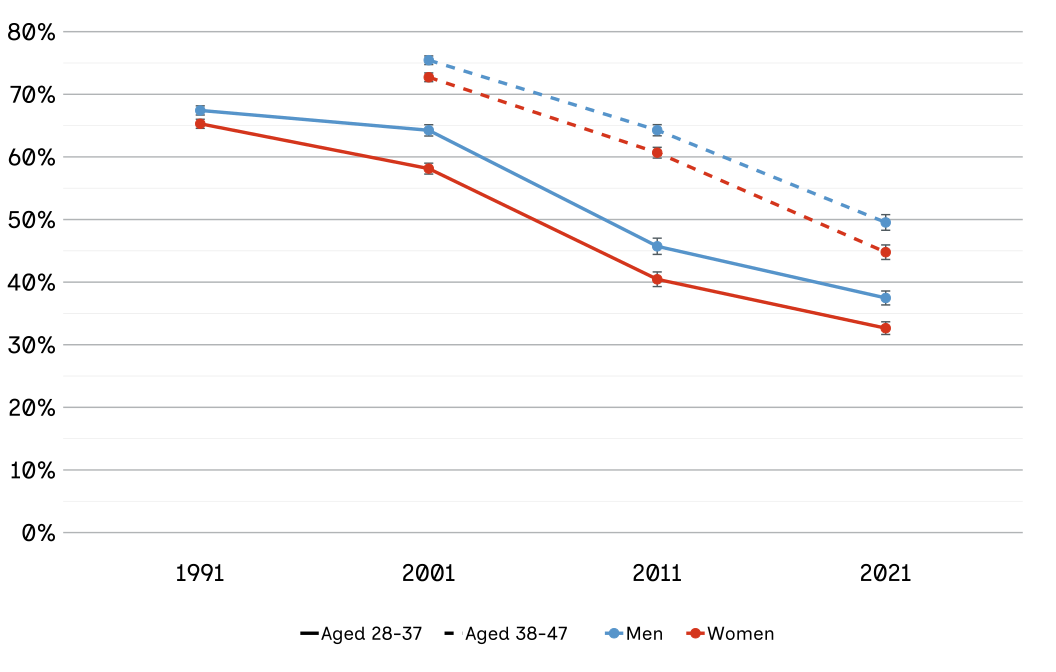
Housing mobility shows more significant deterioration. While there were high rates of upward housing mobility – moving from rented to owned accommodation – until 2001, rates declined markedly after this. In 1991, 67% of men and 65% of women aged 28 to 37 years experienced upward housing mobility, compared with 37% of men and 33% of women in 2021.
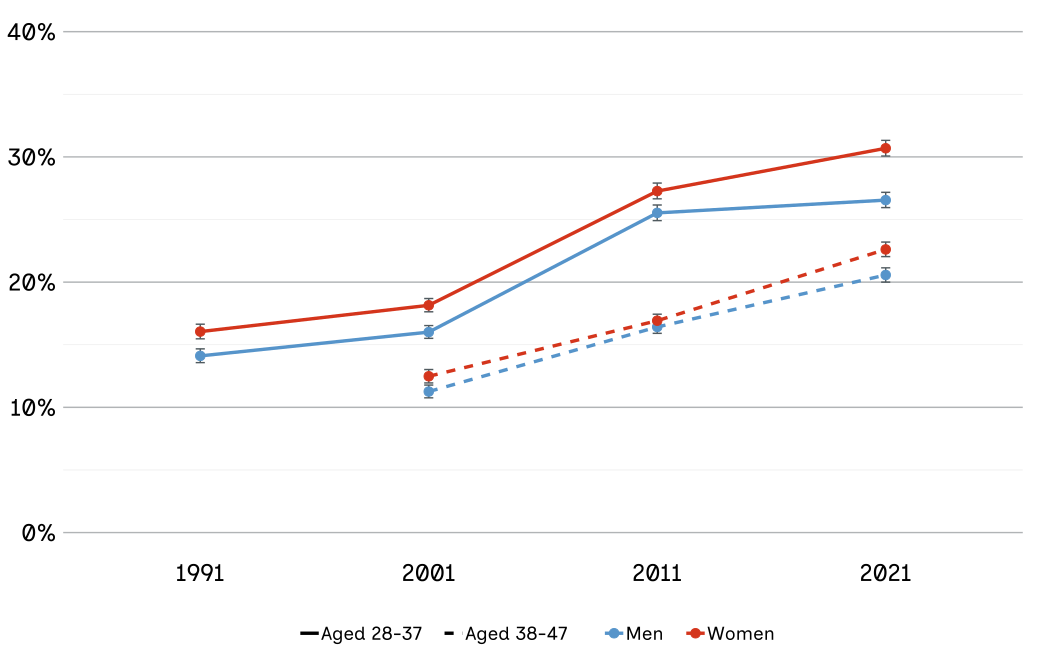
There were low rates of downward housing mobility in the first 2 decades analysed (11% for men and 12% for women aged 38 to 47 years in 2001), but in 2021, there were higher rates of 21% for men and 23% for women.
In 2021, around 1.7 million people aged 28 to 37 years in England and Wales experienced downward housing mobility, compared with 850,000 who experienced upward mobility.[footnote 1] In contrast, during the 1991 Census, when the proportions whose parents had been owners and renters were evenly balanced, upward housing mobility was 3 times as common as downward.
Men were more likely to be upwardly mobile in housing terms than women, and less likely to be downwardly mobile throughout with the gap possibly widening.
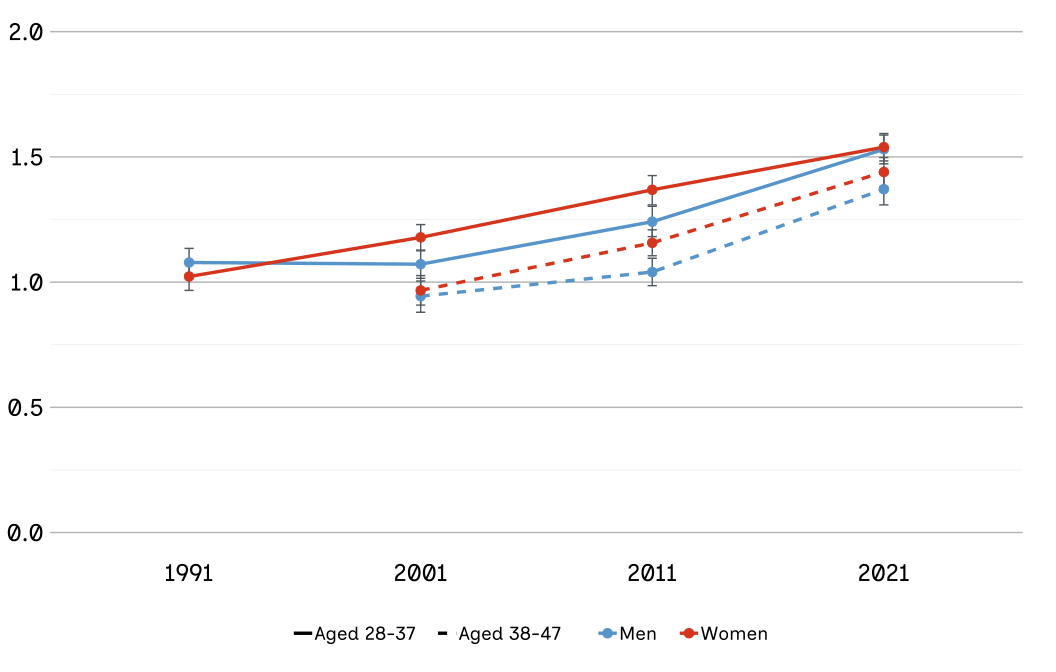
There was worse relative housing mobility (how strongly parental ownership predicts children’s ownership) after 2001. This worsened further after 2011.
Introduction
In the State of the Nation 2023, we traced mobility outcomes over time at a national level. We reported trends in 4 domains: occupational, income, educational and housing mobility, using a variety of sources.[footnote 2]
We also investigated both absolute and relative mobility. By ‘absolute mobility’, we mean the proportion of adults who have been upwardly or downwardly mobile (for example, the proportion of people from working-class origins who gained access to a professional occupation). By ‘relative mobility’, we mean the difference in mobility chances between people from different class origins. For example, how much more (or less) likely people from professional backgrounds are to enter professional occupations, compared with people from working‑class backgrounds.
Some of the headlines from the Social Mobility Commission’s (SMC) State of the Nation 2023 report were:
- “For absolute mobility, the most common pattern was to find more upward than downward mobility, though the contrast was more marked in previous decades than it is today.”
- “For relative mobility, there continue to be quite high levels of intergenerational persistence in most domains, although the trends over time differ – in the case of housing mobility there has been a marked increase in persistence in contrast to educational mobility where there has been a marked decrease in persistence.” (State of the Nation 2023, page 43).
The Office for National Statistics Longitudinal Study
We are now able to update and verify the conclusions of the 2023 report using newly released data from linked censuses, the ONS-LS. The Census is the most authoritative data available, because it provides almost complete coverage of the population. However, it does not include measures of people’s social backgrounds.
The linked census data that ONS has constructed adds this missing piece of the data, helping us link people’s social origins with their current position.[footnote 3] By linking records across decades, it allows us to follow individuals’ long-term career paths. Specifically, we identify individuals when they were aged 8 to 17 years and living at home during the 1971, 1981 or 1991 Censuses. This allows us to record their parents’ occupations. We then find those same people in later censuses, including the most recently linked 2021 data, to see which occupational class they reached as adults in their 30s and 40s. We can only use the linked censuses for England and Wales at present, although eventually we hope to add analysis of the linked censuses for Northern Ireland and Scotland as well.
Using the linked censuses of the ONS-LS, we can directly investigate intergenerational occupational, educational and housing mobility over the last 50 years. We can also make some indirect estimates of occupational wage mobility.[footnote 4] The ONS-LS is now the best resource for studying educational, occupational and housing mobility over time. Its strengths are the large sample sizes, the length of the period covered, the quality of its coverage of the population and the low levels of non-response and attrition (see the technical annex for more details).
However, the ONS-LS does have some limitations. It is not able to provide estimates of mobility for the whole population, but only for specific cohorts. To establish a person’s social background, individuals must be captured in a census while they are still living at home as children. This is the only way to link their record to their parents’ data.[footnote 5]
We therefore have to focus on specific cohorts, such as young people aged 28 to 37 years at the time of the 2021 Census (see figure 2.1). These young people will have been aged 8 to 17 years at the time of the 2001 Census 20 years earlier and are likely to have been living at home with one or both parents at that age. After age 16 years, young people are more likely to leave home and so can no longer be linked with a co-resident parent’s data. In addition to these early-career young people, we can also study mid-career people aged 38 to 47 years by linking them to their co-resident parents in the census 30 years earlier.
Figure 2.1: Cohort and ages tracking matrix.
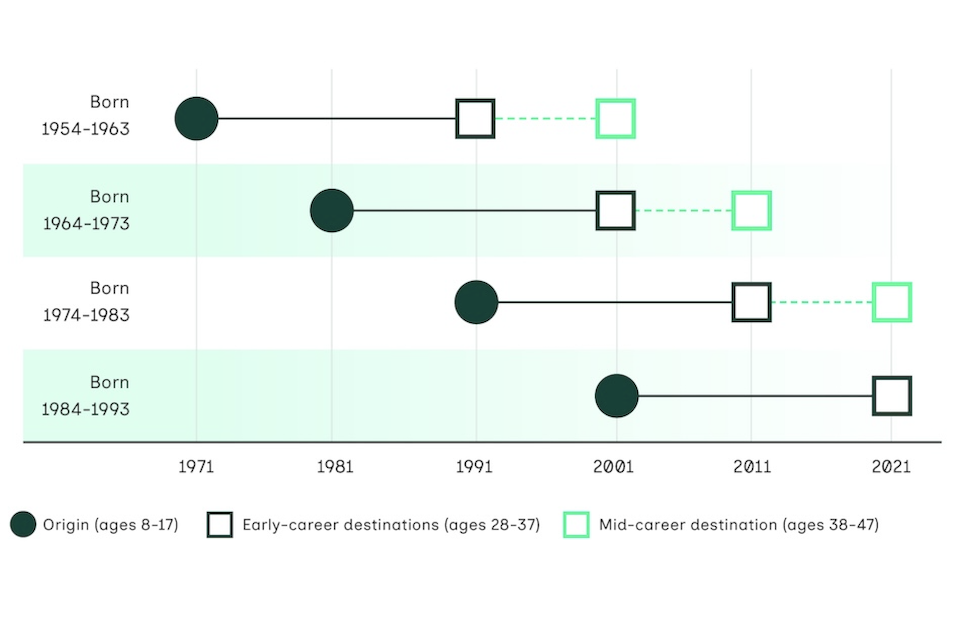
Note: Because the Census is conducted in the spring, a person’s age on the day of the Census does not perfectly align with a single calendar birth year. For example, people born in the later months of 1953 will have been aged 17 at the time of the 1971 Census.
The period covered by the linked censuses – from 1971 when the first set of parents were studied until 2021 – has been one of remarkable social change in England and Wales, and the UK as a whole. There has been a significant increase in overall population size driven by immigration, alongside a continuing shift to a post-industrial society, a huge expansion of tertiary education in the 1990s and 2000s and a major expansion of owner-occupation following the Right to Buy council housing reforms of the 1980s. These changes have occurred alongside a long‑term rise in real-term house prices.
Odds ratios
Sociologists and economists use several statistical tools to measure the gap in outcomes between groups (often called relative mobility). One useful technique when comparing 2 groups is the odds ratio, which measures the relative odds of people from 2 different origins of achieving one of 2 outcomes and avoiding the other. For example, what are the relative odds of someone from a professional Socio-economic background (SEB), compared with someone from a working SEB, of attaining a degree (rather than no degree)?
What are odds ratios?
An odds ratio is a comparative (or relative) measure. It compares the chances of a particular outcome between 2 groups and shows us the ‘gap’ in chances between them using a single number. An odds ratio always shows us the difference between 2 groups, not the chances of any one group.
For example, in figure 2.11 we see that, in 2001, just over 11% of mid-career men whose parents were homeowners had become renters. This must mean that the remaining 89% became homeowners themselves. So the odds of being a homeowner for this group are simply 89:11, or around 8 to 1. In other words, for every person in this group who became a renter, 8 became homeowners.
What if we look at a different group, men whose parents were renters in 2001, in figure 2.10? As expected, they have a higher chance of being a renter themselves. Just over 75% of them became homeowners, which must mean that around 25% became renters. So this group’s odds of being homeowners are much lower, at only 75:25, or around 3 to 1. There are still more homeowners than renters, but the odds are much smaller than for men whose parents were homeowners.
If we divide the first odds by the second, we get the figure reported in figure 2.12, the ‘odds ratio’ of 2.57. This incorporates all 4 of the percentages above, as the calculation is roughly 89:11 divided by 75:25.
The odds ratio is helpful, because it summarises the difference between the 2 groups in a single number, using all 4 percentages. This is particularly useful when we look at change over time.
For example, we see that 20 years later, in 2021, the odds ratio had increased from 2.57 to 3.94 for men at mid-career. This is because, while everyone’s chances of becoming a homeowner worsened in that 20-year period, the chances of men whose parents were renters worsened more severely. The higher odds ratio (3.94 in 2021, compared with 2.57 in 2001) shows this increased inequality in just one number.
Educational mobility
Summary
Among young people aged 28 to 37 years, there were large increases in upward educational mobility from non-graduate families until 2011. This increase had slowed by 2021. Relative educational mobility improved both between 1991 and 2001 and between 2011 and 2021. In other words, opportunities to gain a university degree have become much more equal. Moreover, women have caught up with and then overtaken men in upward educational mobility.
There was a great expansion of university education in England and Wales (just as in other developed Western countries) in the 50 years covered by the LS. In the UK in 1971, around 5% of young people aged 25 to 29 years had degrees (Anthony Heath and others, 2018, figure 7.3).[footnote 6] By 2021 the figure was approaching 50% although the rate of growth had slowed down. This expansion had been driven by the Robbins Report of 1963 and the creation of many new universities in the 1960s.[footnote 7] A further expansion happened in the 1990s when most polytechnics were converted into degree-awarding higher educational institutions.
Absolute educational mobility
This expansion of higher education (HE) means that there will have been a great deal of upward educational mobility. Most students at university will have been the ‘first generation’ from their families to gain a degree. This is reflected in figure 2.2, which shows the percentages of men and women in their late 20s and early 30s who were upwardly mobile in educational terms. This is defined as the proportion of young people coming from families where neither parent had a university degree, who gained a degree themselves.
Figure 2.2 shows that at the time of the 1991 Census, before the major acceleration in the growth of university education of the 1990s, 11% of young men from non-graduate families had obtained degrees and so were upwardly mobile educationally. The figure for young women was significantly lower at 7%. By 2001 upward mobility had increased to nearly 20% and young women had largely caught up with young men. By 2011 young women had moved ahead, with 37% from non-graduate families being upwardly mobile compared with 32% of young men. A similar pattern is seen in the intermediate outcomes (see chapter 3). In 2021, young women moved further ahead, although the rate at which upward mobility grew began to level out (reflecting the stabilising growth in HE generally). However, chapter 3 shows that these improvements in education are not always translated into higher earnings for women and other groups.
Figure 2.2: There were large increases in upward educational mobility among young people from non-graduate families, with the rate of increase levelling out in 2021.
Probability of becoming a graduate among those coming from non-graduate families (expressed as percentages), men and women aged 28 to 37 years.
Source: Office for National Statistics Longitudinal Study (ONS-LS).
Note: This chart tracks mobility trends over time by year of destination (the census year in which the mobility outcome was observed). Each destination year corresponds to specific birth cohorts as defined in figure 2.1. The error bars show 95% confidence intervals. Non-graduate families are where neither parent has a university degree.
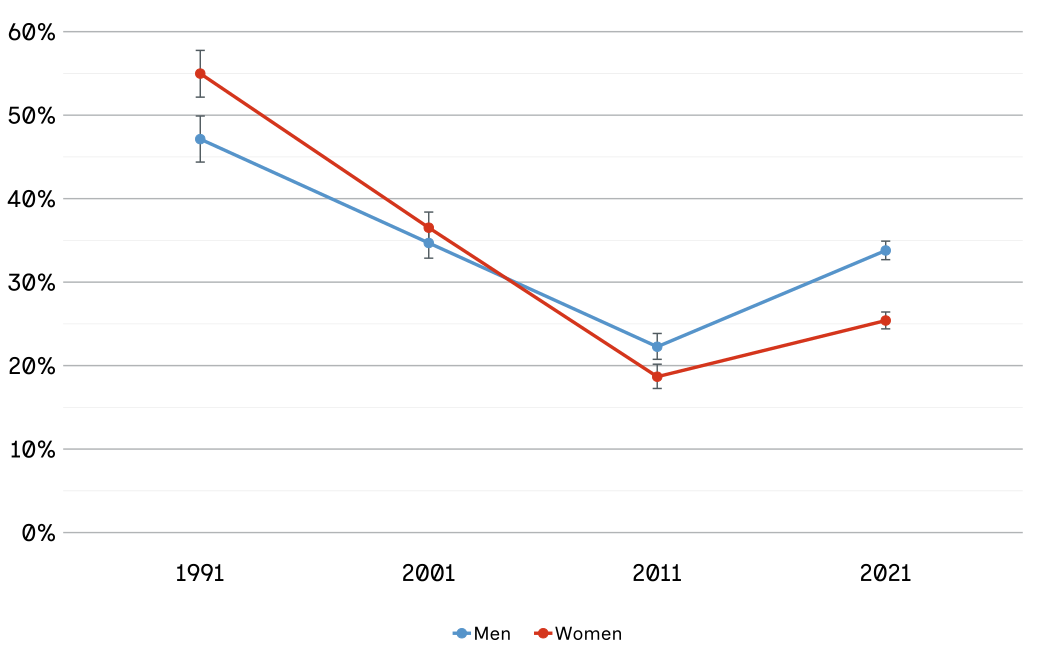
Figure 2.3: Downward educational mobility fell up until 2011 but then rose again in the most recent decade.
Probability of downward educational mobility (expressed as percentages) among those coming from graduate families, men and women aged 28 to 37 years.
Source: ONS-LS.
Notes: This chart tracks mobility trends over time by year of destination (the census year in which the mobility outcome was observed). Each destination year corresponds to specific birth cohorts as defined in figure 2.1. The error bars show 95% confidence intervals. Graduate families are where at least one parent has a university degree.
Downward educational mobility among young people declined up until 2011 (a smaller percentage of young people were ending up with lower qualifications than their parents), but went back up in 2021. As with upward mobility, women initially had less favourable chances of gaining university education than men, but by the end of the period had greater chances and lower rates of downward mobility.
Relative educational mobility
Figures 2.2 and 2.3 show that young people reaching adulthood towards the end of the 20th and in the first 2 decades of the 21st century had much more favourable chances of obtaining university degrees than their parents had done. In addition, figure 2.4 shows that the chances of young people from non-graduate families obtaining a university degree themselves also improved over these decades relative to those of people from graduate families. In other words, there was increasing equality of opportunity for HE.
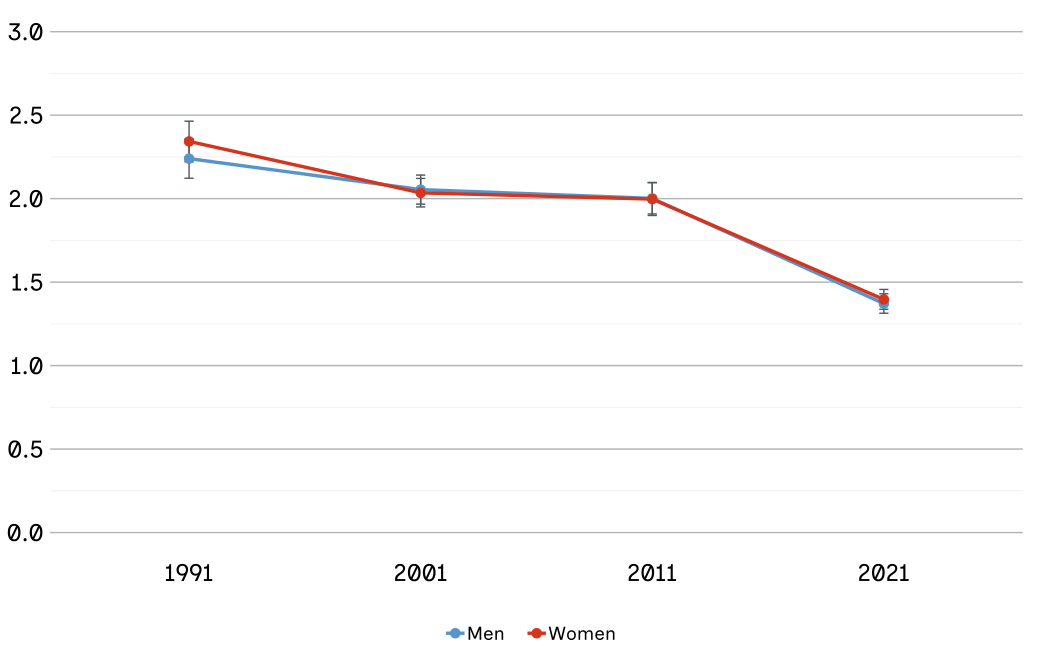
Figure 2.4 shows that inequality of opportunity for HE had been high in the years up to 1991 but then fell sharply in the next decade. There was also a marked improvement in 2021.
Figure 2.4: Intergenerational educational persistence fell between 1991 and 2001 and again between 2011 and 2021.
Relative educational mobility: degree:no-degree log odds ratios (respondents aged 28 to 37 years).
Source: ONS-LS.
Notes: This chart tracks mobility trends over time by year of destination (the census year in which the mobility outcome was observed). Each destination year corresponds to specific birth cohorts as defined in figure 2.1. The error bars show 95% confidence intervals. Education is a binary measure of attainment of an undergraduate degree qualification. A higher odds ratio indicates greater intergenerational persistence while a lower odds ratio indicates greater relative mobility.
Figure 2.4 also suggests that educational persistence was at a similar level for men and women in each period (as seen from the overlapping confidence intervals).
The big story, then, is that equality of opportunity for HE among people from different educational backgrounds has improved over the last 3 decades, although substantial inequalities still remain. This improvement in equality of opportunity is likely connected with the overall expansion of HE, although from this descriptive data we cannot rule out the possibility that reforms to university admissions and recruitment procedures might have made a difference too.
However, we should also recognise that the expansion of HE has been associated with much greater heterogeneity among HE institutions.[footnote 8] Improvements in equality of opportunity for access to high-tariff universities (those asking for high grades), such as Oxford, Cambridge and Imperial College London, may well have been more modest, but unfortunately the linked census data does not allow us to investigate this as it does not capture which university individuals attended.
Comparisons with previous research
These results for relative educational mobility are very similar to those reported in our State of the Nation 2023 report (page 80, figure 2.21), which showed the trend over time in relative educational mobility, using results updated with those from the UK Household Longitudinal Survey (UKHLS).[footnote 9][footnote 10]
Figure 2.5: There has been an increase in relative educational mobility among young adults, 1991 to 2020.
Parent:adult children log odds ratios relating to university degrees, UK, respondents aged 28 to 37 years.
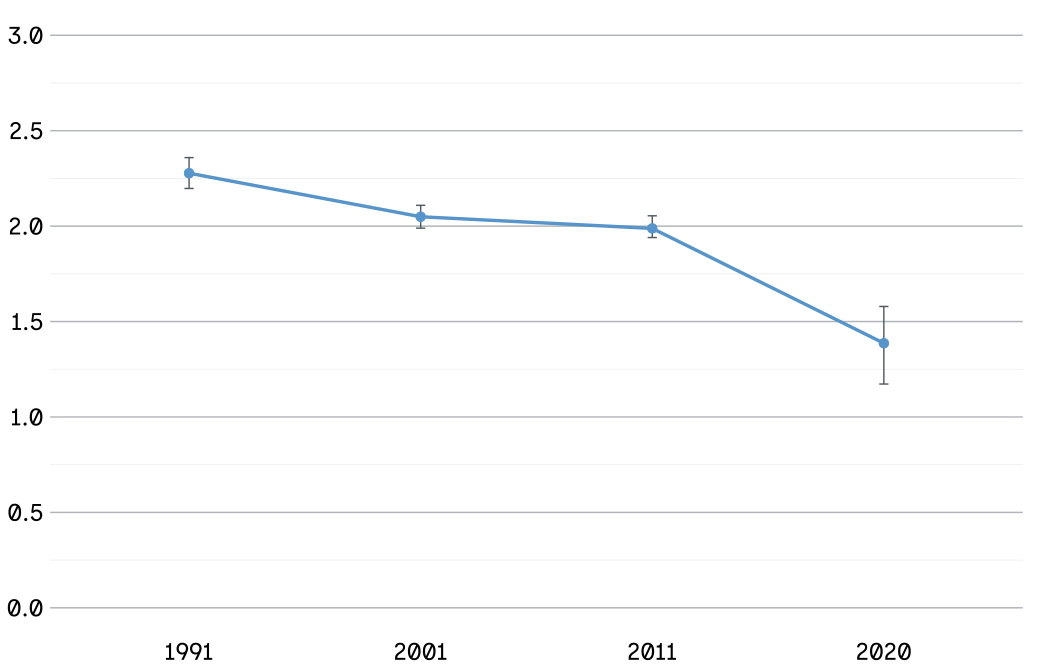
Source: Bell and others (2023) and UK Household Longitudinal Survey (UKHLS), 1991 to 2020. Respondents aged 28 to 37 years in the UK.
Notes: Education is a binary measure of attainment of an undergraduate degree qualification. A higher odds ratio indicates greater intergenerational persistence while a lower odds ratio indicates greater relative mobility (children are more likely to end up with the same education as their parents versus more likely to move beyond it). Odds ratios have been transformed to log odds ratios for consistency with this year’s analysis. The error bars show the 95% confidence intervals for each estimate.
Occupational mobility
Summary
Long-range upward occupational mobility from the working class increased considerably up to 2001 and has continued to improve (although at a slower rate over the last decade). Long-range downward occupational mobility from the professional class has been consistently low and has even declined recently among women. Relative occupational mobility has improved among early-career men and women but has shown little change among people in their mid career.
There has been a gradual but substantial evolution of the types of jobs people do (known as occupational structure) since 1971, with a decline in traditional manufacturing and heavy industry in many parts of the country and the emergence of a post-industrial economy. Britain has experienced a decline in the size of the working class, contrasting with growth in the number of people employed in the knowledge-intensive occupations of the professional and managerial classes (such as doctors and nurses, data analysts and IT managers).
In 1971, around 25% of the male workforce was in a professional or managerial occupation, while 45% were in working-class jobs (technical, semi-routine and routine occupations).[footnote 11] By 2021 these figures were more or less reversed. This transformation of the class structure has provided the opportunity for high levels of upward mobility out of the working class into the professional class. But it also means that “increasing numbers of individuals are now starting out in life from more advantaged class positions. So the numbers of those ‘at risk’ of downward mobility are steadily rising, and the number ‘at risk’ of upward mobility are steadily falling”.[footnote 12] To take an extreme illustration of this, in a society where everyone was professional, the only possible mobility would be downwards.
For our analysis of the LS, we distinguish 3 broad social classes, namely professional, intermediate and working class.[footnote 13]
Absolute occupational mobility
Long-range upward mobility
By ‘long-range upward mobility’ we mean movement from working-class families (as measured by the class positions of a person’s parents, if they lived with them) to a professional-class occupation for that person as an adult, 20 or 30 years later. Long-range downward mobility is the opposite – movement from professional parents to a working-class occupation for the adult children.[footnote 14]
In figure 2.6, we show the proportions of ‘early-career’ men and women (aged 28 to 37 years) who had experienced long-range upward mobility compared with their parents 20 years earlier. We also show the proportions of mid-career men and women (aged 38 to 47 years) who had experienced long-range upward mobility compared with their parents 30 years earlier. Since the ONS-LS begins only in 1971, the first Census in which we can study the mobility outcomes of these mid-career people is 2001. In the case of occupational mobility, mid-career is a better stage of the life cycle to study mobility outcomes than the early career, as many people from advantaged homes take lower-level entry-level jobs but then move back up over the course of their careers (termed the ‘counter mobility’ thesis).
Figure 2.6 shows that, among early-career men and women, long-range upward mobility out of the working class increased substantially between the first 2 Censuses (1991 and 2001) but then levelled off among men. Women initially experienced a lower rate of upward mobility than men but had overtaken them by the end of 2021.
Figure 2.6: Long-range upward mobility from the working class increased considerably at first among early-career men and women and has continued to increase at a slower rate.
Proportions (measured as percentages) of those growing up in working-class families who were upwardly mobile to the professional class, men and women aged 28 to 37 years with outcomes observed at the 1991, 2001, 2011 and 2021 Censuses, and those aged 38 to 47 years with outcomes observed at the 2001, 2011 and 2021 Censuses.
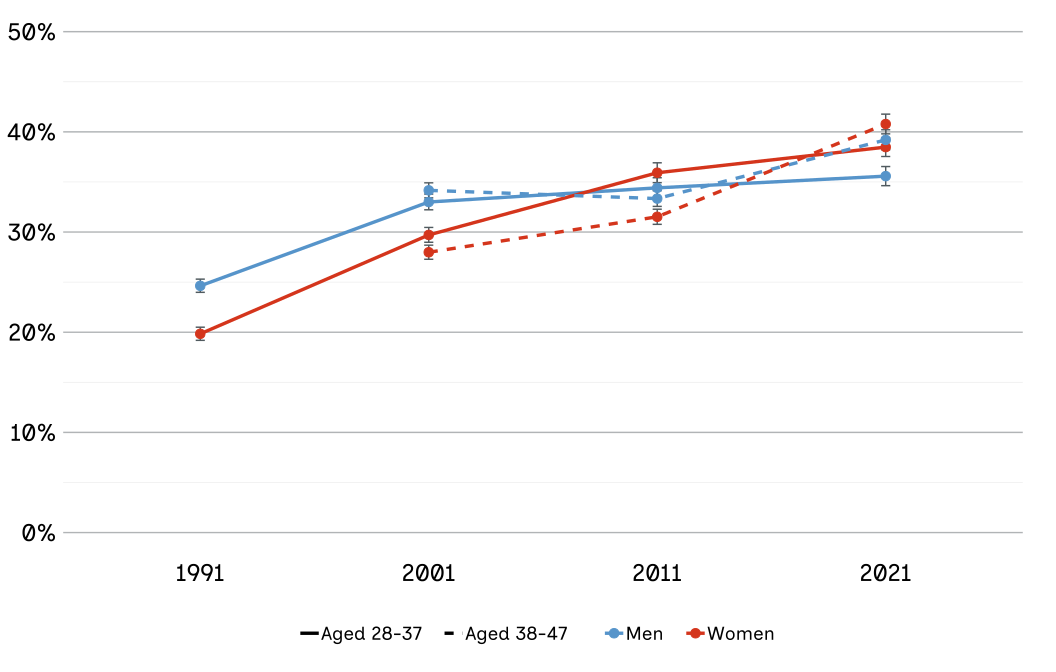
Source: ONS-LS.
Notes: This chart tracks mobility trends over time by year of destination (the census year in which the mobility outcome was observed). Each destination year corresponds to specific birth cohorts as defined in figure 2.1. The error bars show 95% confidence intervals. To ensure fair comparisons across all decades, we use a simplified 3-category version of the NS-SEC social class measure – grouping occupations into working, intermediate and professional classes.
Trends among people in mid-career can only be observed in the period since 2001. These trends are broadly similar to those for early-career men and women, with a small increase for men and larger increases for women in rates of long-range upward mobility, especially between the 2011 and 2021 Censuses. As would be expected, people in mid-career also show a higher rate of upward mobility than the same cohort had shown a decade earlier when they were at the early-career stage. So among men aged 28 to 37 years in 1991, 25% had experienced long-range upward mobility from the working class; 10 years later, when members of this cohort were in mid-career and aged 38 to 47 years, the percentage had risen to 34%.
Long-range downward mobility
Figure 2.7 shows rather different trends for people in mid-career from those at an early-career stage. Among men aged 28 to 37 years, the proportion downwardly mobile from the professional class varied around 20% with no clear trend over time. But among men in mid-career it fell by around 3 percentage points between the 2001 and 2021 Censuses. Among women, there was a decline in downward mobility from the professional class both among the early career and the mid career, although the drop was larger among the latter (falling by 9 points between the 2001 and 2021 Censuses).
Figure 2.7: Long-range downward mobility from the professional class has been consistently low and has tended to fall over time, especially among women.
Percentages of young people growing up in professional families who were downwardly mobile to the working class, men and women aged 28 to 37 years with outcomes observed at the 1991, 2001, 2011 and 2021 censuses, and those aged 38 to 47 years with outcomes observed at the 2001, 2011 and 2021 censuses.
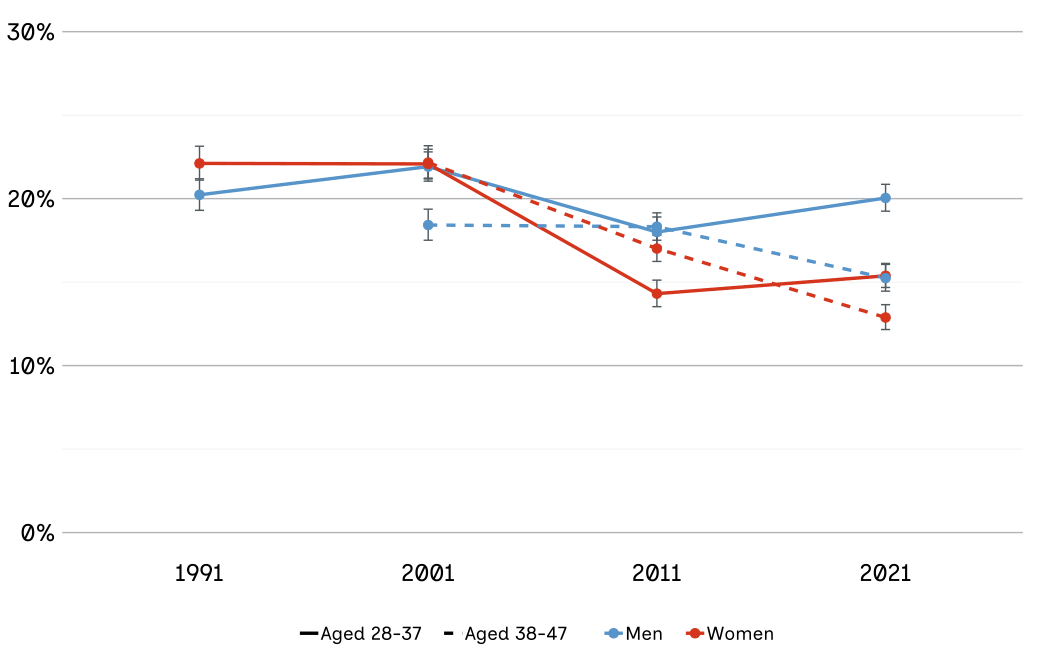
Source: ONS-LS.
Notes: This chart tracks mobility trends over time by year of destination (the census year in which the mobility outcome was observed). Each destination year corresponds to specific birth cohorts as defined in figure 2.1. The error bars show 95% confidence intervals. To ensure fair comparisons across all decades, we use a simplified 3-category version of the NS-SEC social class measure, grouping occupations into working, intermediate and professional classes.
These results for downward mobility from the professional class mirror the results for upward mobility from the working class. The expansion of the professional class essentially has given more opportunities to the children of professionals as well as to the children of working-class families to obtain professional and managerial jobs themselves.
In addition, the results are consistent with the ‘counter-mobility’ thesis. That is, people from professional backgrounds often have to take their first job at an ‘entry-level’ (for example in the intermediate classes) but then manage to return to the professional-class level of their parents through upward intragenerational mobility. Their early-career positions may be a poor indicator of their longer-term mobility prospects and outcomes.
It is striking that the proportion of people from working-class families experiencing upward mobility has been larger than the proportion of those from professional families experiencing downward mobility. This follows from the long-term expansion in the size of the professional class. At the same time, however, because of the past expansion of the professional class among the parental generation, increasing numbers of individuals are now starting out in life from more advantaged class positions. So the proportion of the age group as a whole experiencing long-range downward mobility could be increasing. And this is indeed what we find (although there are still more people moving up than down overall).
While the increasing opportunities for professional and managerial occupations are a major driver of rates of upward and downward mobility, they are not the only potential influence. Equality of opportunity for people from different origins can make a difference. When opportunities are more equal, mobility rises in both directions.
Relative occupational mobility
While absolute-mobility measures look at the percentages of people who experience mobility, relative-mobility measures instead compare the mobility chances of 2 (or more) different groups. As described earlier, a useful technique when measuring inequality of outcomes between different social origins is the odds ratio, a way of comparing how likely alternative outcomes are in one group versus another. We measure the relative odds of people from professional and working-class family origins achieving professional outcomes themselves and avoiding a working-class outcome.
In figure 2.8, we show how this measure of inequality of class mobility chances (that is, of relative mobility) has evolved over recent decades. What we find is that the trends over time in relative mobility differ markedly between early-career and mid-career people. Among early-career young people (aged 28 to 37 years), we see an improvement in relative mobility for both young men and women between the 1991 and 2001 Censuses, and a further improvement for young men in the most recent intercensal period, 2011 to 2021.
In contrast, there is little change in relative mobility among either men or women in mid-career: among men the log odds ratios remain above 1.4 across the 2001, 2011 and 2021 Censuses, whereas among women they remain below 1.4, showing slightly better relative mobility for women. In both cases, there is a small and non-significant fall and of much smaller magnitude than the decline among early-career men and women. This pattern of small variations around a fairly steady long-term trend tends to confirm the finding of ‘trendless fluctuation’ by academic researchers such as John Goldthorpe.[footnote 15]
Figure 2.8: Intergenerational class equality of opportunity has improved among early-career men and women but has not changed so much among those in mid-career.
Relative occupational mobility: professional class:working class log odds ratios among young men and women aged 28 to 37 and aged 38 to 47 years, outcomes observed at the 1991, 2001, 2011 and 2021 Censuses.[footnote 16]
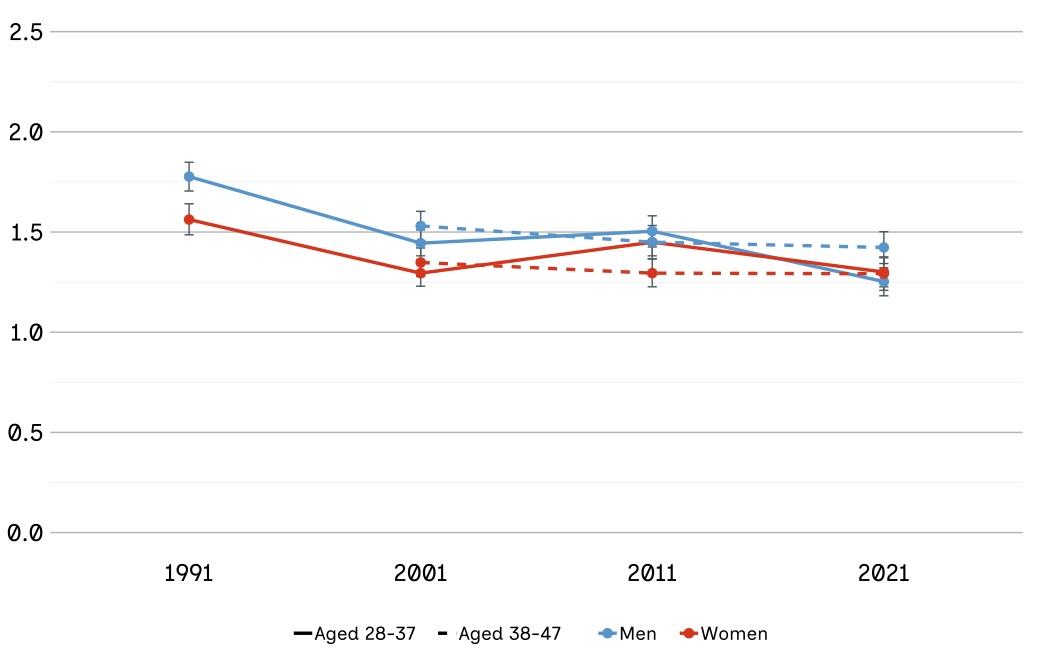
Source: ONS-LS.
Notes: This chart tracks mobility trends over time by year of destination (the census year in which the mobility outcome was observed). Each destination year corresponds to specific birth cohorts as defined in figure 2.1. The error bars show 95% confidence intervals. A formal test of the changes in relative mobility, using the ‘undiff’ parameter estimate and distinguishing 5 social classes, confirmed the changes shown in figure 2.8. For early-career men the parameter estimates (and their standard errors) for the 3 later periods relative to the first period (set at 1.00) were 0.82 (0.03), 0.86 (0.03) and 0.74 (0.03). For early-career women the parameter estimates were 0.82 (0.03), 0.92 (0.04) and 0.80 (0.03). For mid-career men the parameter estimates (and their standard errors) relative to the first period (set at 1.00) were 0.94 (0.03) and 0.93 (0.03). For mid-career women they were 0.92 (0.04) and 0.90 (0.04).
How might we explain the difference in the trends for early and mid-career young people? If we were to focus solely on early-career young people, we might suggest that the expansion of HE after 1991, and the greater equality of opportunity that we observed in educational mobility, might explain the increase in occupational equality of opportunity too.
An alternative explanation could be that, after the expansion of HE during the 1990s, careers have on average been started at an older age than before (for example, at 21 instead of at 16). In effect, a large and increasing proportion of the age group have been starting their careers some 2 or 3 years later than they would have done in the previous cohorts. So, many members of the age group would have been at an earlier career stage than their predecessors before the great HE expansion in the 1990s. This could also explain why relative mobility appears to be greater among young people after the expansion: early‑career earnings are still tightly clustered and the larger differences between groups only emerge later, after the high earners pull ahead.
Comparisons with previous research
Our results for absolute occupational mobility cannot be compared directly with those reported in State of the Nation 2023: the 2023 report looked at trends over time in the workforce as a whole, whereas this year’s report focuses on specific age groups. Our 2023 report showed that the level of upward mobility had declined in recent years while rates of downward mobility had increased, contrary to what we report here. The 2023 analysis also emphasised that the findings might have been biased because the data used for the most recent period disproportionately included people at earlier career stages. Since social mobility is a process which evolves over people’s careers, it is important to take account of people’s career stage, which the current analysis is better able to do. On the other hand, with people increasingly staying in education for longer periods, it may be the case that chronological age does not correspond nowadays to the career stage in exactly the same way that it did 30 or more years ago.
The results for relative mobility are more closely in line with previous published research. Researchers Franz Buscha and Patrick Sturgis (2018) found an improvement in relative mobility among early-career people in the last decade of the 20th century, but this stalled in the first decade of the 21st century (a similar result to ours for the 1991 to 2011 period). They obtained similar results for those in mid-career, although the changes across birth cohorts were not quite as strong as those for the early-career stage.[footnote 17]
Brian Bell and others (2023) used different methods: rank-rank regressions of scales of occupational attainment. These regressions rely on ranking occupations and then measuring how the ranks of parents’ occupations link to the ranks of children’s occupations. They also found an improvement in relative mobility across the 3 early-career cohorts that they studied up until 2011.[footnote 18] They report that persistence was stronger among men than among women throughout, as we do for the same period and cohorts.
On trends for people in mid-career, Erzsébet Bukodi and John Goldthorpe (2019), using a series of birth cohort studies, found no significant change among men aged 38 years in relative class mobility, a result similar to ours.[footnote 19] However, they found a significant improvement in relative mobility among women (that is, a decline in the strength of the association between parents’ and children’s class positions), a result that comes closer to our findings for early-career than for mid-career women. Their observations of mobility outcomes cover the period from 1984 to 2008 and so are earlier than those that we cover in the ONS-LS for people in mid-career (namely 2001 to 2021).
None of the existing academic literature has covered the most recent decade as yet. Our State of the Nation reports have covered the period from 2014 to 2022 using the Labour Force Survey (LFS) and found a statistically significant improvement after 2019 in relative mobility for the population aged 25 to 64 years as a whole (State of the Nation report 2023, figure 2.10). However, the sample size was too small to separate those at early, mid- or late-career stages and the post-2019 period is one where the LFS response rates fell sharply.
Income mobility
Summary
The calculations of income mobility from the ONS-LS are better called occupational-wage mobility. This is because we cannot measure income directly in the ONS-LS. Instead, we can analyse ‘occupational wages’, which are the average wage for each occupation and are estimated indirectly from other data sources. This measure does not include non-salary income.
Relative wage mobility among early-career men and women worsened up until 2001, but improved in the most recent decade. However, relative wage mobility for young women remains significantly worse than it was, as measured in 1991. This means that the wages of young women’s parents are a significantly stronger predictor of young women’s wages now than they were then. Intergenerational occupational-wage persistence among mid-career men and women increased across the 3 earliest cohorts. In other words, wages became more closely linked to parents’ occupation‑based wages over that time.
Background
At the same time as the occupational transformation that Britain saw over the last 60 years, average real household income doubled between 1961 and 2015. There were increases both for the least affluent and most affluent households, but the absolute gaps between the most and least affluent widened greatly in the 1980s and continue to widen today, although more slowly. Over the period as a whole, the income of a household at the 90th percentile (the household that is 90% of the way up from the bottom or 10% from the top) trebled in real value (after adjusting for inflation and household size). In contrast, the increase for a family at the 10th percentile (only 10% of the way up from the bottom) was only 2.5 times. The gaps are even greater as we get to the very top of the income distribution. There are also some differences within the lowest 10%, although not as large.
This widening of income gaps over time raises the possibility that those at the top of the income distribution become better able to help their children’s careers by financially supporting their access to HE or their move to expensive areas of the country such as London, where high-level job opportunities are more common. Increased intergenerational persistence of income might therefore be expected to follow from the widening income inequalities between families. Put simply, when the gap between rich and poor increases, children’s incomes are more likely to end up similar to their parents’. And this makes it harder for people to move up or down the income ladder.
There are also grounds for thinking that income inequality within occupational classes, particularly within the professional classes, may have grown substantially over this period.[footnote 20] Occupational classes are not as uniform as they used to be. Conventional sociological approaches based on broad social classes may be missing some important developments in social stratification. Trends in income mobility could well be different from those for occupational mobility.
Unfortunately, there are currently no large-scale data sources for Britain that enable us to directly measure intergenerational income mobility for the most recent period. Researchers in other countries can draw on linked tax records for parents and their adult children (for example, Miles Corak for Canada and Raj Chetty for the USA).[footnote 21] These are not yet available in Britain, although the SMC has called upon the government to connect existing datasets between His Majesty’s Revenue & Customs, the Department for Education and the Department for Work and Pensions. In Britain, researchers have instead used longitudinal panel studies, which measure family income when the children are growing up and obtain the adult children’s income when they enter the labour market, years later. The Millennium Cohort Study (which is following up children born in 2000 to 2002 across the UK) will give an up-to-date measure of income mobility as soon as the members have fully moved into the labour market, but in the meantime we have to rely on other sources.
The ONS-LS, which we have used to measure occupational, educational and housing mobility, does not contain information on the income or earnings of parents or adult children. However, the detailed information on occupations that the ONS-LS does include, when combined with external data on the average earnings of different occupations, enables researchers to estimate what can be termed occupational-wage mobility. Since the broad occupational classes used in the previous section each include a range of specific occupations with different average earnings, this method addresses issues arising from increasing income differences within social classes and also summarises how earnings vary across the labour force.[footnote 22] Further details of the method for estimating occupational-wage mobility are provided in the technical appendix.
As with the other analyses of mobility using the LS, researchers have to look at specific age groups of young people in the early stages of their careers (aged 28 to 37 years at the time of the relevant census) or mid-career (aged 38 to 47 years) in order to link them with their parents. We focus on relative rather than absolute mobility, in other words, on the strength of the association between parents’ estimated occupational earnings and those of their adult children. A stronger link can show greater intergenerational persistence (adult children’s earnings similar to parents’), and a weaker link shows less persistence (adult children’s earnings differ from parents’) and increased relative mobility.[footnote 23]
Relative occupational-wage mobility
To measure relative occupational-wage mobility, we rank people by the average earnings of their occupation, using separate averages for men and women. This provides us with a percentile rank similar to the rankings of household income described earlier and helps capture how specific occupations differ in their earnings. Using the technique of rank-rank regression (or rank-rank slopes), we can then estimate the strength of the association between the percentile position of the adult children’s occupational earnings and that of their parents in the linked census 20 or 30 years earlier.[footnote 24] The rank-rank regression approach is preferred because it is robust to outliers and invariant to dispersion changes (not thrown off by unusual values and changes in how spread out earnings are).
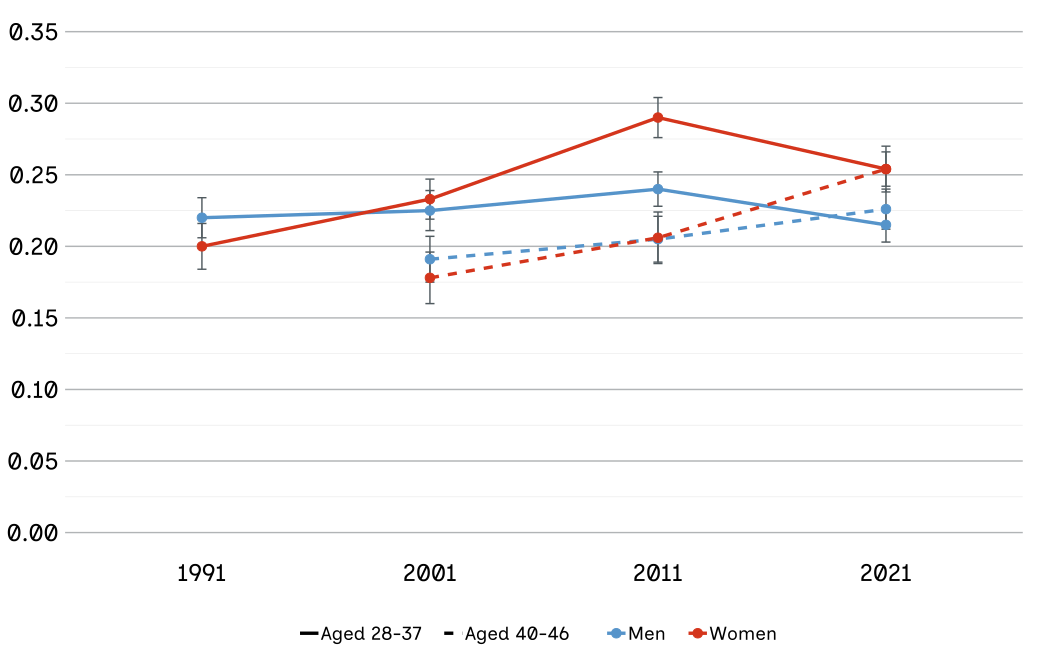
Figure 2.9 shows the trends over time in the strength of intergenerational association (how strong parental income is as a predictor of children’s income) among young people aged 28 to 37 years in the relevant census. We see this association strengthened across the first 3 waves of the ONS-LS but then weakened in the most recent wave covering the cohort born between approximately 1984 and 1993.[footnote 25] There was a broadly similar trajectory for young women and young men. The strength of association for young men in the most recent period was similar to the earliest period (0.215 and 0.220 respectively, as shown in figure 2.9), but this was significantly higher for young women in 2021 than it had been in the earliest.
Figure 2.9: Intergenerational occupational-wage persistence among early-career men and women increased up until 2001 but, decreased thereafter. At the same time, persistence among mid-career men and women increased across the 3 cohorts.
Relative occupational-wage mobility: rank-rank slopes for young men and women aged 28 to 37 and 40 to 46 years at the 1991, 2001, 2011 and 2021 Censuses.
Source: ONS-LS.
Notes: This chart tracks mobility trends over time by year of destination (the census year in which the mobility outcome was observed). Each destination year corresponds to specific birth cohorts as defined in figure 2.1. The regression model includes controls for parental age. The error bars show 95% confidence intervals.
We can also look at trends in intergenerational occupational-wage persistence for the 3 oldest cohorts in mid-career (aged 40 to 46 years).[footnote 26] Here we see a picture of strengthening intergenerational persistence similar to that found for the same birth cohorts observed at their early-career stage in the previous wave.
The increasing intergenerational persistence shown over the 3 earliest birth cohorts is consistent with previous findings on income mobility for this period and with the increase in earnings inequality among parents in the 1980s and 1990s. The decrease in intergenerational persistence seen for the most recent birth cohort is consistent with our findings for this cohort when looking at occupational mobility (see the results for early-career men and women in figure 2.8 above). As with occupational mobility, the explanation for this decrease in persistence may be connected with the increase in equality of opportunity for HE (shown in figure 2.4). Further research is needed to check this theory.
Comparisons with previous research
The main previous analyses of intergenerational income mobility have used a series of birth cohort studies. In particular, the National Child Development Study (NCDS – 1958 birth cohort observed in 1991 when the adult children were aged 33 years) and the Birth Cohort Study (BCS – 1970 birth cohort observed in 2000 when the adult children were aged 30 years). The foundational article by Jo Blanden and others (2004) reported that intergenerational persistence increased between the 2 studies, consistent with the strengthening association found over the 1991 to 2001 period in the present study. In other words, the link between parents’ wages and their adult children’s occupational wage got stronger. However, the researchers used a different type of regression model (intergenerational elasticity of earnings, not a rank-rank regression).[footnote 27]
Researchers Paul Gregg and others (2017) have also examined the strength of intergenerational persistence between the same 2 birth cohorts, but were able to investigate how the association varies at different ages, including at mid- and later-career stages (the latter only in the NCDS).[footnote 28] They show that the association strengthens markedly when people are in their 20s and 30s and reaches its maximum when the adult children are in their 40s. They also show that at mid-career, as well as the early-career stage, the association was stronger in the later birth cohort (observed at age 42 years in 2012) than in the earlier cohort (observed at age 42 years in 2000). In other words, children born later were more likely to end up in similar occupational‑wage positions to their parents.
There is also a study, by Brian Bell and others (2023), that uses the same ONS-LS as the present study and a similar methodology, using an external source (NES/ASHE) to calculate occupational wage and examine intergenerational persistence across 3 cohorts. Cohorts were born approximately 1954–63, 1964–73, 1974–83, and were observed in 1991, 2001 and 2011 at aged 28 to 37 years.[footnote 29] These researchers report occupational-wage elasticities, which means they use a model that estimates what percentage difference we would expect to see in children’s income from a 1% difference in parental income. For example, they find an occupational-wage elasticity of approximately 0.35 for the earliest cohort (born approximately 1954–63 and observed in 1991). This means that if we compare 2 sets of parents, the parents with an income that is 1% higher will probably have children with an income that is 0.35% higher than the other parents’ children. This rises to around 0.40 for the middle cohort (born approximately 1964–73), then declines to 0.33 for the most recent cohort (born approximately 1974–83 and observed in 2011). Their overall conclusion of ‘little overall change’ in occupational-wage mobility is perhaps least consistent with our new results for the corresponding waves of the LS, where we found some significant change.[footnote 30]
Housing mobility
Summary
There were high rates of upward housing mobility (people who grew up in rented accommodation becoming homeowners) between 1991 and 2001, with rates decreasing between 2001 and 2021.[footnote 31] Correspondingly, there were low rates of downward housing mobility (people who grew up in accommodation their parents owned becoming renters) in the first half of the period, but rates of downward mobility increased in the second half of the period. In 2021, the probability of upward mobility for those who grew up in rented accommodation was still higher than the probability of downward mobility for those who grew up in accommodation their parents owned. However, the raw number of people who grew up in accommodation their parents owned was much larger. As a result, the number of young people experiencing downward housing mobility was twice as large as the number experiencing upward mobility. Men were more likely to be upwardly mobile than women, and less likely to be downwardly mobile throughout, with the gap, if anything, widening. There was also increased intergenerational persistence in housing status after 2001, increasing further after 2011.
Background
England and Wales saw some major transformation of housing in the period after World War 2. Great strides were made in tackling the postwar housing crisis: there were major building programmes both in the public and private sectors, reducing the level of overcrowding and improving amenities. One crucial element of this progress was the major slum clearance programme of postwar governments, the building of new towns like Milton Keynes and investments in social housing with large-scale state assistance.[footnote 32] Up until the 1970s, the housing stock grew steadily, with social housing and owner-occupied housing expanding, while privately rented accommodation declined. In the 1980s, however, there was a marked shift towards market forces (moving away from state supply and provision to letting private landlords and buyers shape the housing market). This led to a programme of selling off social housing at subsidised prices to tenants. The social housing stock started to decline, while owner-occupation greatly increased until the early 2000s before levelling out.[footnote 33]
A further major change has been in the real cost of housing, both for renting and buying. Real house prices (adjusting for inflation) doubled between 1970 and 1991 and then increased sharply to 2007, when real house prices had quadrupled compared with 1970, and have since remained at around the same multiple.[footnote 34] Alongside these changes, inequality in access to housing space also increased greatly between 1981 and 2011 (meaning some people have more living space than others).[footnote 35]
These changes in the supply of different types of housing are reflected in patterns of housing mobility between renters and homeowners. Following previous research, we distinguish between homeowners (covering both those with mortgages and those who own outright) and, on the other hand, renters (covering private renting as well as social housing). We define upward housing mobility as moving from renting to owner-occupation, and downward mobility as the reverse. Those resident in communal establishments (such as care homes) are excluded.
Absolute housing mobility
Figure 2.10 shows that there were high rates of upward mobility in the decade up to 2001, with nearly two-thirds of young people who had lived in rented accommodation when they were growing up becoming homeowners themselves. The rate of upward mobility then fell substantially in the first 2 decades of the 21st century.
Figure 2.10: There were high rates of upward housing mobility for the first 2 decades with rates declining in the last 2 decades, both among early- and mid-career men and women.
Probability of becoming a homeowner among those who had been in rented accommodation as children (expressed as percentages), men and women aged 28 to 37 years and 38 to 47 years.
Source: ONS-LS.
Note: This chart tracks mobility trends over time by year of destination (the census year in which the mobility outcome was observed). Each destination year corresponds to specific birth cohorts as defined in figure 2.1. The error bars show 95% confidence intervals.
Similarly, as figure 2.11 shows, there were low rates of downward housing mobility until 2001 and increasing rates thereafter.
There were, however, continuing inequalities between young men and young women in housing mobility chances. In every period, young women had on average a slightly higher chance than men of being downwardly mobile and a lower chance of being upwardly mobile. The gap in upward mobility chances widened from 2.1 percentage points at the time of the 1991 Census to 4.8 points at the 2021 Census and the gap in downward mobility chances widened from 1.9 points to 4.1 points.
Figure 2.11: There were low rates of downward housing mobility in 1991 and 2001, but rates of downward mobility increased after that.
Probability of becoming a renter among those who had been in owner-occupied accommodation as children (expressed as percentages), men and women aged 28 to 37 years and 38 to 47 years.
Source: ONS-LS.
Note: This chart tracks mobility trends over time by year of destination (the census year in which the mobility outcome was observed). Each destination year corresponds to specific birth cohorts as defined in figure 2.1. The error bars show 95% confidence intervals.
While the likelihood of upward mobility out of renting was still slightly higher than the probability of downward mobility out of owner-occupation in 2021, there were many more people who had grown up in owner-occupied accommodation than in rented accommodation. As a result, the overall number of young people experiencing downward housing mobility was twice as large as the number experiencing upward mobility. In other words, downward housing mobility was a more common occurrence among young people overall than upward housing mobility. In contrast, at the time of the 1991 Census when the proportions who had been living in owned and rented accommodation as children were evenly balanced, upward housing mobility had been 3 times as common an experience as downward mobility.
Relative housing mobility
Given the rising cost of homeownership and increased intergenerational wealth transmission (parents passing on assets to children), we would expect to see an increase in intergenerational persistence of homeownership (adult children’s housing tenure being the same as their parents’). This is what we see in figure 2.12. Intergenerational persistence was low at the time of the 1991 Census. This was probably due to the 1980s Right to Buy scheme, allowing millions of council tenants to buy their homes at discounted prices.[footnote 36] There was little change in the decade to 2001, but then large increases in persistence in the following 2 decades.
Figure 2.12: Intergenerational persistence of housing status increased greatly after 2001, meaning people were more likely to be in the same housing status as their parents.
Relative housing mobility: owner:renter log odds ratios, men and women aged 28 to 37 years and aged 38 to 47 years.
Source: ONS-LS.
Note: This chart tracks mobility trends over time by year of destination (the census year in which the mobility outcome was observed). Each destination year corresponds to specific birth cohorts as defined in figure 2.1. The error bars show 95% confidence intervals.
Comparisons with previous research
These results are closely in line with those published by Bell and others (2023) using the ONS-LS up to 2011 and in State of the Nation 2023, which updated Bell and others’ results using the Wealth and Assets Survey (WAS – figure 2.13).[footnote 37] We also add to these earlier findings an analysis comparing women and men.
Figure 2.13: Previous research also shows that relative housing mobility has declined steadily since 1991.
Log odds ratios of the relationship in homeownership between people and their parents (UK, 1991, 2001, 2011 and 2016 to 2020 combined).
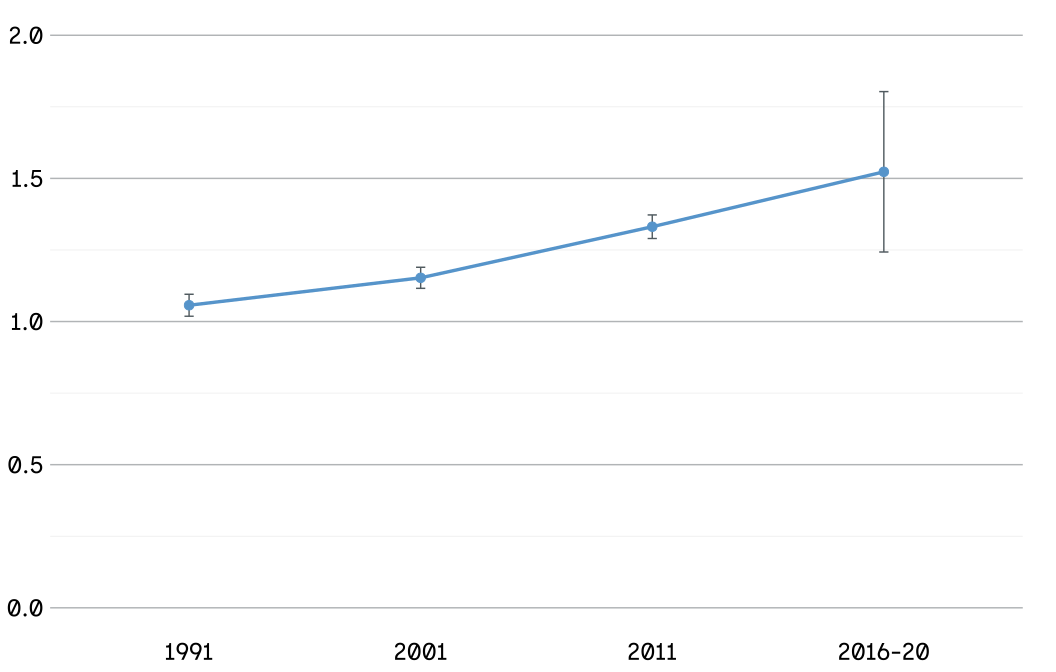
Source: SMC, ‘State of the Nation 2023’, page 94, figure 2.30.
Notes: The error bars show the 95% confidence intervals for each estimate. The odds ratio is a measure of relative mobility. It is the ratio of the odds (of owning a house or not) among those whose parents owned a house to the odds among those whose parents had not. The data used is weighted using the individual weights. Odds ratios have been log transformed for consistency with this year’s analysis.
Jo Blanden and others (2021) have also looked at trends in intergenerational persistence of homeownership (relative mobility) using the BCS and the WAS. They conclude: “There is evidence of a strong upward trend in the intergenerational persistence of homeownership status which increased substantially between 2000 and 2015. At the same time there is evidence of strong empirical relationships between measures of wealth and homeownership of parents and children. Combining these in a model calibration to derive upper and lower bounds on the intergenerational transmission of wealth over time, the principal finding is that intergenerational wealth transmission strengthened over time in Britain at the start of the 21st century.”[footnote 38]
Conclusion
Looking back to 1991 and earlier, we see that, although absolute and relative mobility are different concepts, in practice they move together over time. When absolute mobility (roughly, the overall amount of opportunity) has increased, relative mobility (equality in the uptake of that opportunity) has tended to increase as well.
The most striking example of this is in HE. With the expansion of places, opportunities for access to universities have greatly increased. This has coincided with an improvement in relative education mobility; in other words, parental education has become a much weaker driver of children’s education. Of course, we should not ignore the growing differences within the HE sector. It may be that differences in prestige among universities, or perhaps the difference between an undergraduate degree and a higher degree (for example, a bachelor’s versus a master’s), have started to take the place of the difference between graduates and non-graduates.
Housing is an example of a one-off increase of opportunities through the Right to Buy programme, followed by a slowdown and increasing inequalities of opportunity, particularly as housing costs have risen in real terms far faster than wages. This slowdown is a serious concern because, for many people, the bulk of their wealth is tied up in their housing. Our results on relative housing mobility suggest that parental ownership of the family residence has become a more important influence on whether children will go on to own their own home. As a result, it is likely that intergenerational transmission of wealth (inheritance) is now becoming more important to people’s life chances, a result that should be of some concern.
Occupational mobility lies somewhere in between education and housing: there has been a continuing but slow increase in opportunities for upward mobility, but little change in relative mobility over the decades.
For occupational-wage mobility, we cannot observe absolute mobility with this dataset, but we have seen that relative mobility has slightly decreased over time, despite the slight improvement over the last decade for those in early career.
Increasing educational equality of opportunity could partially explain the increasing equality of opportunity for early-career people between 2011 and 2021 with respect to occupational and wage mobility.
Case study: Tunde Okewale OBE, age 42, London

I am the oldest of 4 children, born to parents who were first-generation migrants in the UK from Africa. My father worked on the London Underground and my mother was a machinist tailor. I grew up on a council estate in Hackney, before it became considered ‘posh’ and ‘trendy’.
Growing up, the sorts of opportunities I’m often asked to speak about now simply didn’t exist. There wasn’t a strong push towards professional careers and many of the brightest students I went to school with didn’t pursue them. This was sometimes a consequence of the soft bigotry of low expectations and sometimes because of a lack of family expectations.
Even while I was at university, there wasn’t the emphasis on high aspirations that exists today. It felt like a conveyor belt. Students went through the system and were largely left to decide their own paths without much structured support or guidance.
I was fortunate to have parents with high expectations. They believed in me and pushed me. My parents were very keen for me to take advantage of the opportunities they didn’t have. If there were any moments where it appeared I didn’t have opportunities, I would be reminded in the strongest terms that I did!
While studying law at university, one of my lecturers played a pivotal role. In my penultimate year he told me, “I can see you being a barrister.” Until then, I hadn’t seriously considered that path. It took one person, someone who had been a barrister himself, to say, “I think you can do it, and I can help.”
While a student, I was working at my local Sainsbury’s. Like many working-class households, especially as the oldest child, I was expected to contribute financially to our household finances. While many of my better-off postgraduate peers could focus solely on their studies, I was working around 16 hours a week, often in the evenings and then attending lectures in the morning. Naturally, this affected my performance and I graduated with a 2:2.
While working at Sainsbury’s I asked everyone I encountered, customers and colleagues alike, whether they knew anyone working in law. Eventually, someone in the meat and fish aisle mentioned a friend’s dad was a barrister. That chance connection led to work experience with a barrister. That experience was transformative. He was also an example of social mobility .Coming from an Irish background, he had little formal education early on, worked on the roads and later returned to education as an adult, becoming a barrister in his 40s. He spoke openly about the barriers he had faced and helped prepare me for the challenges ahead. Through him, I was introduced to a wider network of barristers who had similar backgrounds. They reviewed my applications, helped me prepare for interviews and trained me up in the law profession etiquette.
When I applied for pupillage, the vocational training required to become a barrister, around 100 chambers rejected me, likely due to my undergraduate grades. However, one set of chambers gave me an opportunity, impressed by the on-the-job experience I had gained through my networking. After a few years of performing well, I was then headhunted by another chamber. Today, I am a barrister specialising in serious crime, including white-collar fraud, anti-bribery, corruption and misconduct. I also chair Sport England’s Talent Inclusion Advisory Group and work with Urban Lawyers, a charity I founded to improve access to the legal profession. In 2023, I received an OBE for services to social mobility and the criminal justice system.
When it comes to social mobility, I think there’s too much focus on lifting a small number of exceptional individuals up the ladder. That’s why the democratisation of knowledge is so important. Many people assume they cannot pursue certain careers simply because they don’t understand the process, not because they lack ability. Fortunately, this is improving, with more initiatives aimed at increasing social mobility and access to information.
-
To calculate these national estimates, the raw Office for National Statistics Longitudinal Study (ONS-LS) sample counts of 11,918 (downward) and 5,959 (upward) are scaled up using a 0.7% scaling factor to arrive at 1.7 million and 850,000 people respectively. This scaling factor is lower than the study’s standard 1% census sample because the analysis only includes individuals who could be successfully linked back to their childhood homes. ↩
-
Preliminary trends on wealth were also examined. ↩
-
The ONS-LS securely tracks a representative 1% sample of the population of England and Wales, meaning it is based on records for over 500,000 people. ↩
-
We have used the New Earnings Survey (NES) to estimate wages from employment for the 1971 and 1981 cohorts, and the Annual Survey of Hours and Earnings (ASHE) for later cohorts. It was not possible to estimate income from other sources. ↩
-
In addition to limitations connected with timing of the censuses, there are 3 further important issues. First, because we link people with the parents identified in a previous census of England and Wales, the ONS-LS excludes recent migrants. Second, ONS emphasises that the National Statistics Socio-Economic Classification system (NS-SEC) – the basic building block of the analysis of occupational mobility – is not strictly comparable over time because of the regular re-coding of occupations. Finally, NS-SEC could not be fully constructed for parents in the 1971 and 1981 Censuses, and this may have introduced bias as self-employed parents with working-class occupations were coded as working class, whereas in later censuses, they would have been coded as belonging to the intermediate class. ↩
-
The 1971 figures are for men in work at the time of the census – reported in figure 7.3 of Anthony Heath and others, ‘Social progress in Britain’, 2018. Published on GLOBAL.OUP.COM. ↩
-
‘Higher education: report of the committee appointed by the prime minister under the chairmanship of Lord Robbins 1961–63’, 1963. Published by HMSO. ↩
-
Vikki Boliver, ‘How fair is access to more prestigious UK universities?’, 2013. Published on ONLINELIBRARY.WILEY.COM. ↩
-
Brian Bell and others, ‘Where is the land of hope and glory? The geography of intergenerational mobility in England and Wales’, 2023. Published on RESEARCHONLINE.LSE.AC.UK. ↩
-
Social Mobility Commission, ‘State of the Nation 2023: people and places’, 2023. Published on GOV.UK. ↩
-
The 1971 figures are for men in work at the time of the census – reported in figure 7.3 of Anthony Heath and others, ‘Social progress in Britain’, 2018. Published on GLOBAL.OUP.COM. ↩
-
John Goldthorpe, ‘Social class mobility in modern Britain: changing structure, constant process’, 2016. Published on THEBRITISHACADEMY.AC.UK. ↩
-
These 3 broad classes are based on the 5 occupational classes distinguished in previous State of the Nation reports, which are in turn based on the NS-SEC. However, ONS has emphasised that the NS-SEC classification is not strictly comparable over time due to the regular revision of the occupational codes from which it is derived. Using broader class categories has been found to improve over-time comparability and we have therefore amalgamated the higher with the lower professional class, and the higher with the lower working class. Note that we have to exclude the long-term unemployed and never worked group, which previous State of the Nation reports included in the lower working class, as this category is not available consistently in the censuses. Class origins are based on the father’s class, if available, otherwise on the mother’s. ↩
-
We should think of these as conditional probabilities. We can also calculate unconditional probabilities. These refer to the overall likelihood of someone being upwardly or downwardly mobile despite their class origin or the distance that they move. These measures are not, however, straightforward to interpret, as the overall value will depend on the sizes of the relevant ‘risk sets’. For example, in a population where everyone is professional, the only possible mobility would be downward. ↩
-
John Goldthorpe, ‘Social class mobility in modern Britain: changing structure, constant process’, 2016. Published on THEBRITISHACADEMY.AC.UK; Erzsébet Bukodi and John Goldthorpe, ‘Social mobility and education in Britain’, 2019. Published on CAMBRIDGE.ORG. ↩
-
‘Symmetrical’ here means that we’re considering professional and working-class origin, and also professional and working-class destination. So the origin and destination classes are symmetrical. ↩
-
Franz Buscha and Patrick Sturgis, ‘Declining social mobility? Evidence from five linked censuses in England and Wales 1971–2011’, 2018. Published on ONLINELIBRARY.WILEY.COM. ↩
-
Brian Bell and others, ‘Where is the land of hope and glory? The geography of intergenerational mobility in England and Wales’, 2023. Published on RESEARCHONLINE.LSE.AC.UK. ↩
-
Erzsébet Bukodi and John Goldthorpe, ‘Social mobility and education in Britain: research, politics and policy’, 2019. Published on CAMBRIDGE.ORG. ↩
-
Jo Blanden and others, ‘Intergenerational persistence in income and social class: the effect of within class heterogeneity’, 2013. Published on ACADEMIC.OUP.COM. ↩
-
We use ‘parents’ as a shorthand for who you grew up with at home, whether parents or other caregivers. ↩
-
The research was carried out by Emma Gorman, Franz Buscha and Min Zhang from the University of Westminster under ESRC grant ES/X012190/1. We are very grateful to them for making their results available to the Social Mobility Commission and for their helpful advice. ↩
-
In the study of income mobility, absolute mobility is usually interpreted as the proportion of adult children who have higher real incomes than their parents had at a similar stage of their career, but we cannot estimate this from the occupational earnings data. ↩
-
Checks were also carried out using alternative techniques such as log-log or standardised regressions. These yielded a very similar pattern of change over time for both young men and young women. ↩
-
Throughout the State of the Nation reports we have tended to describe results according to year or period of the survey/census rather than by birth cohort. The canonical economic theory of income mobility (Becker and Tomes 1979) focuses on parental investments in their children and on the credit constraints facing parents. Economists therefore tend to use a birth cohort approach to income mobility rather than a period approach. In contrast, sociological accounts of occupational mobility, especially those of absolute mobility, have focused on the differences in the labour market positions between parents and children (the differences in the marginals). This is why in the rest of this chapter we focus on the expanding or contracting opportunities for children compared with their parents. ↩
-
For occupational-wage mobility, the mid-career age range is slightly narrower (aged 40 to 46 years) to match the specific data models used for this part of the analysis already conducted by the researchers Franz Buscha, Emma Gorman and Min Zhang. ↩
-
Jo Blanden and others, ‘Changes in intergenerational mobility in Britain’, in Miles Corak (editor) ‘Generational income mobility in North America and Europe’, 2004. Published on CAMBRIDGE.ORG. ↩
-
Paul Gregg and others, ‘Moving towards estimating sons’ lifetime intergenerational economic mobility in the UK’, 2017. Published on ONLINELIBRARY.WILEY.COM. They also compared results using rank-rank regression and the intergenerational elasticity (IGE), which Jo Blanden and others had used. They show that the rank-rank regression is more robust to life-cycle biases than the IGE. They also check and correct for other sources of measurement error such as spells of worklessness. ↩
-
Brian Bell and others, ‘Where is the land of hope and glory? The geography of intergenerational mobility in England and Wales’, 2023. Published on RESEARCHONLINE.LSE.AC.UK. ↩
-
Two methodological differences may contribute to this gap: (a) the present study uses hourly wages rather than weekly wages and (b) in the present study we applied the dominance method (highest-class parent) rather than restricting to fathers. ↩
-
We use ‘homeowner’ to mean someone who owns the accommodation that they live in (including those who have a mortgage or loan as well as those who own outright). ↩
-
Anthony Holmans, ‘Historical statistics of housing in Britain’, 2005. Published on BLACKWELLS.CO.UK. ↩
-
Anthony Heath and others, ‘Social progress in Britain’, figure 5.2, 2018. Published on GLOBAL.OUP.COM. ↩
-
Jo Blanden and others, ‘Trends in intergenerational home ownership and wealth transmission’, figure 2, 2021. Published on CEP.LSE.AC.UK. ↩
-
Rebecca Tunstall, ‘Relative housing space inequality in England and Wales and its recent rapid resurgence’, 2015. Published on TANDFONLINE.COM. ↩
-
The Right to Buy scheme was introduced by the Housing Act 1980, giving council tenants the opportunity to buy their home at a significant discount. In England, the scheme continues, although the generosity of the discount and the number of eligible houses have fluctuated and reduced over time. The scheme was ended in Wales in 2019 and in Scotland in 2016. UK Parliament, ‘Comparing the Right to Buy in England, Scotland, Wales and Northern Ireland’, 2017. Published on COMMONSLIBRARY.PARLIAMENT.UK. ↩
-
Brian Bell and others, ‘Where is the land of hope and glory? The geography of intergenerational mobility in England and Wales’, 2023. Published on RESEARCHONLINE.LSE.AC.UK. ↩
-
Jo Blanden and others, ‘Trends in intergenerational home ownership and wealth transmission’, 2021. Published on CEP.LSE.AC.UK. ↩