Chapter 1: Introduction
Published 29 October 2026

© Crown copyright 2026
This publication is licensed under the terms of the Open Government Licence v3.0 except where otherwise stated. To view this licence, visit nationalarchives.gov.uk/doc/open-government-licence/version/3 or write to the Information Policy Team, The National Archives, Kew, London TW9 4DU, or email: psi@nationalarchives.gov.uk.
Where we have identified any third party copyright information you will need to obtain permission from the copyright holders concerned.
This publication is available at https://www.gov.uk/government/publications/state-of-the-nation-2026-whos-getting-ahead/chapter-1-introduction
Highlights
The Social Mobility Commission (SMC) monitors intergenerational social mobility across the UK. This means that we look at how many people are able to move upwards from their socio-economic background (SEB, the circumstances that they grew up in) and also at whether this background affects their chances of moving up.
Our Social Mobility Index is structured around 3 pillars: mobility outcomes (measured later in life), intermediate outcomes (measured at an earlier stage) and drivers (underlying conditions that help mobility). All outcome measures are broken down by a person’s SEB.
Mobility is quantified using absolute measures (the total number of people who have changed position) and relative measures (comparing chances between different groups, reflecting ‘stickiness’ or ‘fluidity’). Occupational class is a main metric and composite indices are used for more accurate geographical reporting.
The 2026 report incorporates major data improvements, including the Office for National Statistics Longitudinal Study (ONS-LS) and travel-to-work area (TTWA) analysis. But it still faces challenges due to data limitations, such as the lack of linked tax/educational records and the decreased reliability of the Labour Force Survey (LFS).
The Social Mobility Commission
The SMC exists to monitor social mobility across the UK and to make recommendations in England. We aim to understand how many people are socially mobile, which parts of the country see the most change and whether a person’s background is limiting opportunity. Social mobility is important because it means the circumstances of birth do not limit what someone can achieve – no matter what your starting point, you can go on to achieve positive life outcomes.
What is social mobility?
The term ‘social mobility’ can have many meanings. In this report, we use it to refer to intergenerational social mobility. This means that a person experiences social mobility when they have different life outcomes from their parents.
This could mean a different income level, a different occupational class or other differences such as housing or education. Mobility can be upwards or downwards. What all these approaches have in common is a concern with the chances of people shifting from where they started: moving up or down the social ladder to a higher or lower position than their parents, or staying in the same position.
For example, if you have a professional occupation and your parents had a working-class occupation, you have experienced upward occupational mobility. If you have a high income and your parents had a lower income at the same age, you have experienced upward income mobility.
The role of our Social Mobility Index
In 2022, we launched our Social Mobility Index to measure mobility clearly and systematically across a person’s lifetime. The Index includes over 40 indicators that cover early years through to late adulthood.
Figure 1.1: The updated Social Mobility Index.
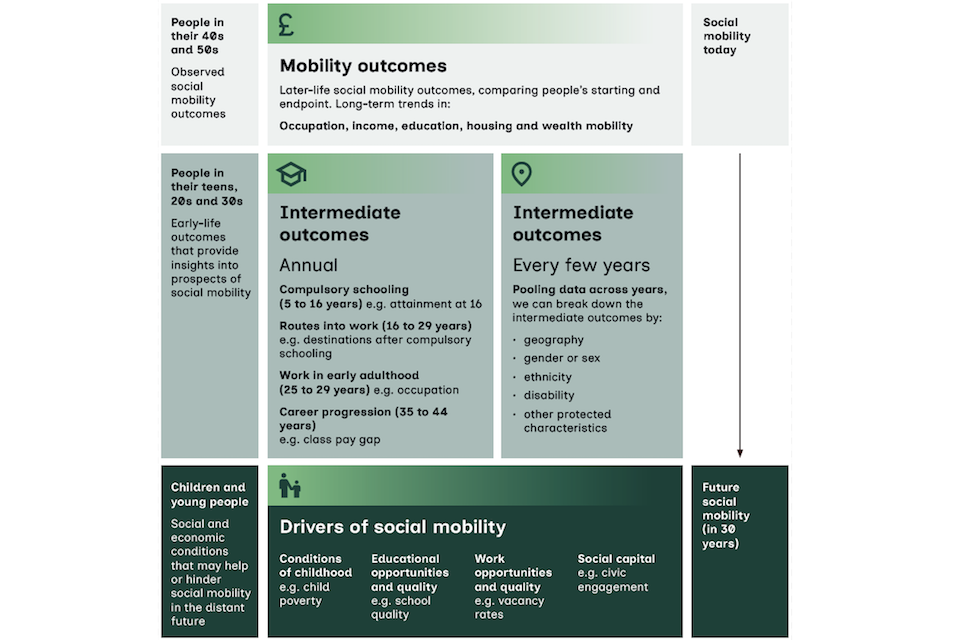
The Social Mobility Index includes social mobility outcomes, looking at people’s jobs and earnings at different life stages, in comparison with their parents’. It also reports on some drivers or background conditions that might help or hinder social mobility in the future.
What are mobility outcomes, intermediate outcomes and drivers?
Mobility outcomes show the changes that people make from their starting point in life to a later endpoint, such as employment or income when they are in their 40s.[footnote 1] We break outcome measures down by people’s socio-economic background (SEB), so that we can see how different starting points affect change to endpoints. Analysis of most mobility outcomes relies on data from panel or birth cohort studies, which aren’t always updated yearly. For this reason, we don’t update these figures annually.[footnote 2]
Intermediate outcomes show the development that people make from their start point to an earlier endpoint, such as employment in their 20s or educational attainment at age 16 years. We also break these down by SEB. We track these figures because a person’s early outcomes can be a very good indicator of how their later life will turn out. This gives us an early snapshot of mobility without having to wait to assess outcomes much later in life.
Drivers show the underlying social and economic conditions that make social mobility easier (or harder). For example, the availability of good education is a driver, because it helps people get better jobs and improve their circumstances (upward mobility). So our measures of drivers tell us about these nationwide background conditions. They do not tell us what the UK’s rates of mobility have been and they are not broken down by SEB.
These 3 categories of measures – mobility outcomes, intermediate outcomes and drivers – form the comprehensive framework of our Index, allowing for a more detailed assessment of mobility across a person’s lifespan.
Measures of social mobility
To effectively monitor and report on social mobility across the UK, the SMC employs a range of different measures. This section explains the building blocks of our measurement framework.
What is a social-mobility measure?
All measures of social mobility have to start with a measure of SEB. This is because, without knowing someone’s starting point, we cannot say what progress they have made. Once the SEB is determined, we can see where someone has ended up and measure the difference between the starting and finishing points.
This can present a challenge, because someone’s starting point can be decades in the past and finding appropriate data can be difficult. For this reason, we have to rely on a range of different measures of SEB, depending on the context, and some are better than others.
Once we have a measure of someone’s SEB, we can then go on to measure their current status, whether they are at an earlier point in their life (for intermediate outcomes) or a later one (for mobility outcomes).
When we do this for the whole population or for a sample representing the population, we get the social mobility rates that feature in this report. These rates can either be absolute or relative, a distinction that is explained below. Finally, we can combine several different measures into a ‘composite index’[footnote 3] to give us an overall picture of social mobility in a geographical area.
Understanding the full framework, from SEB determination to the use of absolute and relative rates, is important when interpreting the findings on social mobility. This is why we next turn our attention to the foundational concept of SEB.
Socio-economic background
SEB is the crucial starting point for any analysis of social mobility, as any mobility measure consists in looking at the difference between a person’s SEB and where they end up later in life. This section defines SEB and outlines the various data sources and proxies, such as parental occupation, income and education, that we use to capture this in our reporting.
What is socio-economic background and how do we measure it?
SEB is a person’s starting point, measured by their parents’ socio-economic situation when the person was growing up.
SEB is not just a matter of parental income and income is not the only thing that matters for a child’s life chances, although it has a critical role to play. That is why we also consider parental occupational class, income and education. For example, we might look at whether one or both parents had a degree when the person was a child. There are, of course, other elements that influence outcomes, like family dynamics, community structures, and culture, which we are unfortunately not able to measure.
Throughout our report, we often report SEB as it’s recorded in the Labour Force Survey (LFS), a representative sample survey that gives information on the UK’s labour market. In this survey, participants are asked about their current jobs and what job the main earner in the household did when they were aged 14 years. This enables us to look back at someone’s SEB without having to track the same individual across all the intervening years.
The LFS also covers the whole of the UK, in line with the Social Mobility Commission’s statutory obligations.
Sometimes, the LFS isn’t available, so we have to use other measures of SEB. For example, for children still in school, the only measure of SEB available is their eligibility for free school meals (FSM). This is a rough measure of family income, as children in low-income families are eligible for FSM.
Absolute and relative mobility
Social mobility measures can be categorised into 2 distinct types: absolute and relative. Both are essential for a complete picture, as they measure different things. This section explains the difference between absolute measures, which quantify the total number of people who have moved up or down the social ladder, and relative measures, which concentrate on the comparative chances between different groups.
What are absolute and relative mobility measures?
Absolute measures capture the number of people who have experienced mobility. They are usually expressed as percentages of the population. For example, the absolute occupational mobility rate is the percentage of people who are in a different occupational class from their parents. For income mobility, a common absolute measure is the percentage of people whose income is higher than their parents’ income was, at the same age. We can compare these rates across different regions of the UK.
We can think of it like escalators in a building: improving absolute mobility would be like adding more escalators, so that more people can get to the top floor.
Relative measures compare the chances that at least 2 groups have of reaching a particular outcome. It is this element of comparison that makes such measures relative. A relative mobility measure tells us that one group has better chances than another, rather than telling us the total number of socially mobile people. Low relative mobility means that those who start life in a particular position are more likely than others to be in the same position later in life. For that reason, low relative mobility can be thought of as ‘stickiness’, while high relative mobility can be thought of as ‘fluidity’.
To go back to the escalator analogy, improving relative mobility would mean giving people who start lower down access to faster escalators, so the floor they begin on doesn’t determine where they end up. In a society with perfect relative mobility, those starting at the bottom would have just as much chance as anyone else of reaching the top.
The distinction between absolute and relative mobility is vital for a complete assessment, as it allows us to track both the overall change in and the distribution of opportunity. There is an important policy question about where we should focus our efforts – will we increase societal welfare more by increasing the number of people who can move upwards, or by making the distribution of opportunity more even? However, in practice, the 2 types of measure are generally strongly correlated over time. That is to say, in periods where one improves, the other also tends to improve.
Composite indices for geographical reporting
To assess social mobility across different geographical areas of the UK with greater confidence, this report uses a set of composite indices. These indices are powerful tools that combine multiple individual measures – both drivers and intermediate outcomes – into a single summary score. This approach helps to reduce the risk of coming to conclusions based on random sampling errors in single-measure estimates. This provides a stronger picture of regional differences.
What are composite indices?
As in last year’s report, we feature 5 composite indices, covering some of our drivers and intermediate outcomes. We call them composite indices because they summarise multiple drivers or intermediate outcomes in a single score. They give us a summary of how different geographical areas of the UK compare on the main dimensions of mobility.
The composites also allow us to be more confident in coming to conclusions about differences between geographical areas. Estimates for individual areas often involve sampling errors (since they are based on sample surveys, like the LFS).[footnote 4] There is therefore always a risk that differences between areas on a single measure could be due to random sampling errors. To get around this inaccuracy, we summarise findings across multiple indicators that seem to be related. When multiple measures all give a similar picture, we can confidently say that there are real differences between the areas. We can then ask whether these differences are due to the areas themselves or the individuals living there. For example, the Conditions of Childhood index summarises a number of factors connected with the socio-economic situation of parents with dependent children.
By combining multiple indicators into composite indices, we are able to provide a stable, geographically detailed picture of mobility drivers and intermediate outcomes, a process that relies heavily on clear and consistent measures, such as the classification of occupational class.
Occupational class
Occupational class is one of the main things we track to find out an individual’s SEB and to measure their ultimate mobility outcomes. Table 1.1 details the framework we use to classify occupations throughout this report, which is based on a simplified 5-part grouping derived from the National Statistics Socio-economic Classification (NS-SEC).[footnote 5]
Table 1.1: Our 5-part grouping of occupational classes based on the NS-SEC.
| NS-SEC | Previous 3-part grouping | 5-part grouping | Example occupations |
|---|---|---|---|
| 1 | Professional and managerial | Higher professional including higher managerial, administrative and professional |
Chief executive officer of large firm, doctor, clergy, engineer, senior army officer |
| 2 | Professional and managerial | Lower professional including lower managerial, administrative and professional |
Teacher, nurse, office manager, journalist, web designer |
| 3 | Intermediate[footnote 6] | Intermediate including intermediate occupations, small employers and freelance workers |
Clerical worker, driving instructor, graphic designer, IT engineer, shopkeeper, hotel manager, taxi driver, roofer |
| 4 | Intermediate | Intermediate including intermediate occupations, small employers and freelance workers |
Clerical worker, driving instructor, graphic designer, IT engineer, shopkeeper, hotel manager, taxi driver, roofer |
| 5 | Working class | Higher working class including lower supervisory, technical and semi-routine workers |
Foreman, mechanic, electrician, train driver, printer, shop assistant, traffic warden, housekeeper, farmworker |
| 6 | Working class | Higher working class including lower supervisory, technical and semi-routine workers |
Foreman, mechanic, electrician, train driver, printer, shop assistant, traffic warden, housekeeper, farmworker |
| 7 | Working class | Lower working class and workless families |
Cleaner, porter, waiter, labourer, refuse collector, bricklayer |
| 8 | Working class | Lower working class and workless families |
Cleaner, porter, waiter, labourer, refuse collector, bricklayer |
The NS-SEC categorises individuals by economic security and workplace power rather than income. It looks at 2 areas. The first is labour-market situation, which includes source and form of income (for example, monthly salary or payment for hours worked), job security, predictability of earnings, career development, and long-term rewards. The second is the work situation, which includes whether the worker has authority over others, how closely they are monitored, and how much discretion and autonomy they have.
Two people doing the same type of work can be in different classes if one is an employee and the other is self-employed, since the self-employed tend to be classed as intermediate. For example, a bricklayer who is an employee would be in NS-SEC 7, lower working class, while a self-employed bricklayer would be in NS-SEC 4, intermediate class. The earned incomes in these 2 cases may also be very different.
Occupational class versus earnings
All of this means that occupational class is not about how much you earn. Sometimes people in lower occupational classes earn more than those in higher occupational classes. For example, speech and language therapists count as higher professionals, NS-SEC 1, because their job requires a first degree for entry, experience-related training and the practical application of a body of knowledge to instruct others. Yet their average salary is lower than that of many working-class occupations, including some routine manual occupations.
Example occupations, their NS-SEC classes and median salaries
Speech and language therapists – NS-SEC 1: Higher professional. Median salary: £31,932.
Train and tram drivers – NS-SEC 5: Higher working class. Median salary: £63,807.
Air conditioning and refrigeration installers and repairers – NS-SEC 6: Higher working class. Median salary: £39,818.
Large goods vehicle drivers – NS-SEC 7: Lower working class. Median salary: £36,847.[footnote 7]
Limitations of NS-SEC
While NS-SEC is a very powerful analytical tool, it has limitations and cannot capture every aspect of someone’s labour-market or work situation. These limitations fall broadly into 2 types: change over time and the breadth of the NS-SEC categories.
Change over time presents a particular challenge, because the nature of the work involved in certain jobs may change and new types of jobs will appear. Revisions are carried out every decade to take account of this, but that means that comparisons over time can be disrupted. For example, if a certain occupation is reclassified at a higher level, this could create an illusion of upward social mobility, as everyone who does that occupation is now reclassified.
The second challenge arises from the breadth of the categories. The professional and managerial classes (NS-SEC 1 and 2) have expanded dramatically and now contain a large proportion of the population. This broad category now conceals huge variations in pay, prestige and career trajectories, yet the social stratification taking place within the category may be missed. It also means that an individual might make significant progress within a category, which would also be missed, because their classification would not change. Finally, the classification of managers and professionals is vulnerable to job-title and educational qualification inflation, because it relies on subjective self-description in surveys.
Improvements to our reporting
Last year, we added 2 important elements to our Index: systematic international comparisons and a more thorough analysis of change over time. This allowed us to compare the UK with other countries and track how the UK has changed over time.
This year, we have made a major improvement by adding the ONS-LS to our data sources.[footnote 8] The ONS-LS, which uses data from the census, allows us to look in more geographical detail at changes in the drivers and also to check national trends in the mobility outcomes.
Improvements for 2026
We have made significant improvements across all 3 core components of the Index: mobility outcomes, intermediate outcomes and drivers.
In particular, the report has incorporated the ONS-LS as a major new data source for mobility outcomes. This has established national trends across occupational, educational, income and housing mobility, building on our past work of adding a more thorough analysis of change over time. Each section has also included comparisons with other authors and data sources to provide a richer picture.
The ONS-LS offers significant benefits. It uses a 1% sample of the census, a much larger sample size, with very few people dropping out over time. It also directly links children’s and parents’ census records, instead of relying on people remembering their parents’ jobs. We also have data every 10 years from 1971, which allows us to look at long-term trends. Finally, we can follow the same individuals over time, which allows us to track life-cycle effects (for example, how the same person’s income varies over their lifetime).
Regarding intermediate outcomes, we have updated the standard indicators as per usual. In addition, for the protected characteristics, we have broken down the LFS pooled data into 2 even time periods – 2014 to 2019 and 2020 to 2025 – to assess how outcomes for those groups have changed over time. This pooling approach has been necessary to address the challenges of the LFS’s significantly decreased reliability and falling response rates over the last decade. We discuss more in the section on data limitations.
Finally, the analysis of drivers has been enhanced in 2 significant ways. We have used census data from 2001 to 2021/22 to examine changes in occupational structures over time at the local authority (LA) level, which has allowed us to look at Northern Ireland LAs individually for the first time. Furthermore, we have introduced TTWA analysis to better understand local labour market opportunities for young people, and innovation and growth. This geographical approach supports our use of composite indices to draw more confident conclusions about real differences between areas.
What are travel-to-work areas?
Travel-to-work areas (TTWAs) are geographical units designed to represent self-contained labour market areas where the majority of people live and work. They are a valuable tool for labour-market analysis and planning.[footnote 9]
To be defined as a TTWA, an area must meet the following criteria: (1) at least 75% of the resident workforce must work within the area; (2) at least 75% of the people who work in the area must also live there (known as the “self-containment rate”); (3) the area must have a minimum economically active population of 3,500. For areas with a working population over 25,000, a self-containment rate as low as 66.7% is accepted as a compromise.
This definition results in some areas being significantly larger than others. For example, much of London and its surrounding area is grouped into a single TTWA.
TTWAs are useful because they reflect the real geographical clustering of work.
Data limitations in the UK
Tracing trends over extended periods offers deeper insights into how social mobility has evolved. However, analysing such changes at a granular level, for instance by protected characteristics or by area, remains challenging due to data limitations.[footnote 10] This highlights the need for better data to support social mobility analysis and broader discussions on data improvements for informing future reports. This need for better data was previously explored in detail in the SMC’s 2022 report, Data for social mobility.[footnote 11]
Linking parents’ outcomes with children’s
Linking parents’ and children’s tax records and educational records would give us a much more detailed and refined picture of mobility. The records already exist, but are not linked across generations. Without this linkage, researchers cannot look at the earnings or education of today’s adults and compare them with the earnings or education of their parents. Countries such as Sweden and the USA already have linked tax records, enabling pioneering work on the causes of mobility.[footnote 12] While the ONS-LS gives us some linking across generations, it is not administrative data and is therefore still based on a sample of the population. Furthermore, the ONS-LS is based on decennial data from the census (collected every 10 years), so we cannot use it to track annual changes.
A household-level dataset
Household-level data would help us understand the socio-economic circumstances of schoolchildren more clearly. At the moment, administrative data generally views people as individuals, rather than as belonging to a household. For example, an administrative household-level dataset would help target children who are most in need, rather than relying on the current, rather basic, FSM eligibility marker.
Occupational data
There is currently no administrative data on people’s occupation type in the UK. His Majesty’s Revenue and Customs collects data on income, but not on occupation, although it has consulted on this.[footnote 13]
Birth cohort studies
There have only been 4 major birth cohort studies in the UK since 1945, leaving gaps of up to 30 years between studies. The most recent one, the Millennium Cohort Study, began fieldwork 25 years ago. The Centre for Longitudinal Studies manages most of these studies. Gaps have occurred because maintaining long-term studies over decades is expensive.
The Labour Force Survey
As in the previous State of the Nation reports, we rely on the LFS to understand trends in intermediate outcomes and drivers because it is the only UK data source that collects people’s socio-economic backgrounds and other relevant labour market information. However, the reliability of this data has significantly decreased over the last 10 years. The number of people surveyed has roughly halved, falling from about 99,300 in 2014 to 50,800 in 2025. This is largely due to a decline in the survey’s response rate, which dropped from 48% in 2014 to 39% in 2019, and further dropped to just 17% by early 2024.[footnote 14] To make our analysis stronger, we have used a 3-year rolling average to increase the effective sample size and smooth out large swings in the data. We have also carried out specific statistical checks that account for the smaller sample size to ensure that any observed changes are genuinely meaningful and not just random variations.
The problems with the LFS are now partially improved by the publication of the latest ONS-LS data, but the ONS-LS is only updated once every 10 years (because it is based on the census). For annual updates, we still rely on the LFS.
-
We use this age range because people have generally reached occupational maturity, meaning that their career has stabilised. At this stage, their job title more accurately reflects their long-term socio-economic position. Different studies use varied age ranges for this measurement, but a typical range is 37 to 44. Data availability may also be important. In this report, when using the Office for National Statistics Longitudinal Study (ONS-LS), we examine 2 age ranges: 27 to 36 and 37 to 46. ↩
-
We last updated these figures in the State of the Nation 2023. That report covered education, income, housing and wealth data up to 2020 and occupational data up to 2022. For this year’s report, we use ONS-LS data, which covers outcomes up to 2021. ↩
-
A composite index is an analytical technique that allows you to group several measures together to create a composite score. ↩
-
The Labour Force Survey (LFS) is a study of the employment circumstances of the UK population. It is the largest household study in the UK and provides the official measures of employment and unemployment. Office for National Statistics (ONS), ‘Labour force survey’, 2021. Published on ONS.GOV.UK. ↩
-
The ONS collects, analyses and shares statistics about the UK’s economy, society and population. ONS, ‘The national statistics socio-economic classification (NS-SEC)’, 2021. Published on ONS.GOV.UK. ↩
-
Some routine occupations can count as intermediate if the worker is self-employed. ↩
-
ONS, ‘Earnings and hours worked, occupation by four-digit SOC: ASHE table 14a’, 2023. Published on ONS.GOV.UK. ↩
-
ONS, ‘About the ONS Longitudinal Study’. Published on ONS.GOV.UK. ↩
-
ONS, ‘Travel to work area analysis in Great Britain: 2016’, Published on ONS.GOV.UK. ↩
-
Analysis of intermediate outcome trends is exclusively reliant on the UK LFS. Due to limited sample sizes, ranging from 30,000 to 90,000 respondents depending on the annual iteration, it’s not possible to break down the data by year and demographic characteristics (for example, sex, ethnicity, disability) or geographical area (for example, local authority). Such granular analysis would give statistically unreliable estimates with high levels of uncertainty. ↩
-
Social Mobility Commission, ‘Data for social mobility: improving the collection and availability of data across government’, 2022. Published on GOV.UK. ↩
-
Raj Chetty and others, ‘Is the United States still a land of opportunity? Recent trends in intergenerational mobility’, 2014. Published on NBER.ORG. ↩
-
See His Majesty’s Revenue and Customs (HMRC) consultation ‘Improving the data HMRC collects from its customers’, 2023. After the consultation HMRC decided against the collection of Standard Occupational Classification codes. These are four-digit numbers which categorise jobs based on skills, qualifications and responsibilities. ↩
-
Office for National Statistics, ‘Labour Force Survey performance and quality monitoring report: January to March 2025’. Published on ONS.GOV.UK. ↩