Chapter 1: Introduction
Published 18 December 2025

© Crown copyright 2025
This publication is licensed under the terms of the Open Government Licence v3.0 except where otherwise stated. To view this licence, visit nationalarchives.gov.uk/doc/open-government-licence/version/3 or write to the Information Policy Team, The National Archives, Kew, London TW9 4DU, or email: psi@nationalarchives.gov.uk.
Where we have identified any third party copyright information you will need to obtain permission from the copyright holders concerned.
This publication is available at https://www.gov.uk/government/publications/state-of-the-nation-2025-the-evolving-story-of-social-mobility-in-the-uk/chapter-1-introduction
Highlights
This State of the Nation report updates our Social Mobility Index – the most comprehensive summary of social mobility statistics in the UK.
Over the past year, we have continued to improve and update the Index, which helps us report a consistent set of social mobility statistics over time.
To better understand how well the UK is doing in social mobility, we have carried out an extensive review of international comparisons on occupational, income, educational, housing and wealth mobility outcomes. This allows us to learn from the best and understand where we need to improve.
For similar reasons, we have taken a much more systematic approach to measuring change over time. This helps to realise one of the important benefits of the Index – providing early signs of success and problems that need to be addressed.
The Social Mobility Commission
Social mobility is important because it means the circumstances of your birth do not limit what you can achieve – no matter what your starting point, you can go on to lead a fulfilling life. The Social Mobility Commission (SMC) monitors social mobility across the UK and makes recommendations for England. We want to understand how many people are socially mobile, in what parts of the country, and to what extent a person’s background limits their opportunity.
What is social mobility?
Social mobility is a broad concept that can be measured across many different outcomes. In this report, we concentrate on intergenerational social mobility. This means that a person experiences social mobility when they have different life outcomes from their parents.
This could mean a different income level, a different occupational class or other differences, such as housing or education level. Mobility can also be upwards or downwards. But what all these approaches have in common is a concern with the chances for people born and brought up in one kind of situation to move up or down the social mobility ladder to a higher or lower position than their parents, or to stay in the same position.
For example, if you have a professional occupation and your parents had a working-class occupation, you have experienced upward occupational mobility. Or if you have a high income and your parents had a lower income at the same age, you have experienced upward income mobility.
The role of our Social Mobility Index
In 2022, we launched the Social Mobility Index to measure mobility clearly and systematically across a person’s lifetime. The Index shows where people end up in comparison with where they started, across a range of outcomes, including occupational class, income, education, wealth and housing.
Figure 1.1: The updated Social Mobility Index.
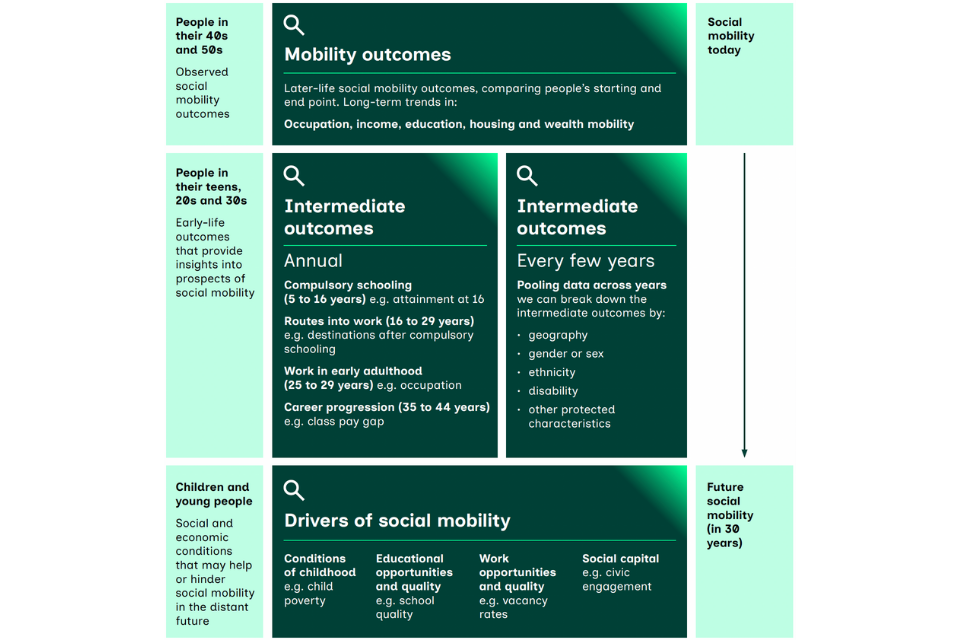
Note: ‘Social capital’ refers to the social connections and the relationships that come from them, which enable a society to function well. Social capital’s role in social mobility is less well understood than that of education or work. However, it has been suggested that it can promote a more dynamic economy and society.
Mobility outcomes are outcomes at a later stage in life, typically the 40s and 50s, while intermediate outcomes look at an earlier stage in life, typically when people are in their teens, 20s or 30s. We look across the life course to better understand both short and long-term mobility. Meanwhile, the drivers examine any UK-wide factors with evidence to show that they enable or slow down social mobility.
Measures in the Social Mobility Index
Mobility outcomes show the progress that people make from their starting point in life to a later endpoint, such as employment or income when they are in their 50s. We break outcome measures down by people’s socio-economic background (SEB), so that we can see how different starting points affect progress to endpoints. Analysis of most mobility outcomes relies on data from panel or birth cohort studies, which aren’t always updated yearly. For this reason, we don’t update these figures annually.
Intermediate outcomes show the progress that people make from their start point to an earlier endpoint, such as employment in their 20s, or educational attainment at age 16 years. We also break these down by SEB. We track these figures because a person’s early outcomes can be a very good indicator of how their later life will turn out. This gives us an early snapshot of mobility without having to wait to assess outcomes much later in life.
Drivers are the underlying social and economic conditions that make social mobility easier (or harder). For example, the availability of good education is a driver, because it helps people get better jobs and improve their circumstances (upward mobility). So our measures of drivers tell us about these nationwide background conditions. They do not tell us what the UK’s rates of mobility have been, and they are not broken down by SEB.
Aside from looking at different stages in life, we also break the UK down geographically into upper-tier local authorities (LAs).[footnote 1] This gives us 203 geographical areas, the same as last year, allowing us to see regional patterns of mobility.
Measures of social mobility
All measures of social mobility have to start with a measure of socio-economic background (SEB). This is because, without knowing someone’s starting point, we cannot say what progress they have made. This can present a challenge, because someone’s starting point can be decades in the past, and finding appropriate data can be difficult. For this reason, we have to rely on a range of different measures of SEB, depending on the context, and some are better than others.
Once we have a measure of someone’s SEB, we can then go on to measure their current status, whether they are at an earlier point in their life (for intermediate outcomes) or a later one (for mobility outcomes). When we do this for the whole population, or for a sample representing the population, we get the social mobility rates that feature in this report. These rates can either be absolute or relative, a distinction that is explained on page 24. Finally, we can combine several different measures to give us an overall picture of social mobility in a geographical area.
Socio-economic background (SEB)
SEB is a person’s starting point. This is measured by looking at their parent’s socio-economic situation when they were growing up. For example, this might be the parents’ occupational class, income or education. We might, for instance, look at whether one or both of the parents had a degree when the person was a child.
How do we measure SEB?
Throughout our report, we often report on SEB as it’s recorded in the Labour Force Survey (LFS) – a representative sample survey to provide information on the UK’s labour market. In this survey, participants are asked about their current jobs, but also what job the main earner in the household did when they were 14 years old. This enables us to look back at someone’s SEB without having to track the same individual across all the intervening years. The LFS also covers the whole of the UK, in line with the SMC’s statutory obligations.
Sometimes, the LFS isn’t available, so we have to use other measures of SEB. For example, for children still in school, the only measure of SEB available is their eligibility for free school meals.
While most of our social mobility measures use parents’ occupational class as someone’s SEB, not all do. It is important to consider other important aspects of SEB, like what parents earned or what level of education they had. For example, in some families, parents may be educated to university level but working in a routine job – this has historically been true in some immigrant communities, for instance.[footnote 2][footnote 3] In some cases, parents’ occupational class simply isn’t available, so we have to use other measures of SEB.
Occupational class
Where possible, we measure occupational class using the same 5-part grouping that we introduced in 2023.[footnote 4] This grouping uses the occupational classes in the Office for National Statistics’ (ONS) National Statistics Socio-Economic Classification system (NS-SEC).[footnote 5] There are 8 ‘analytic’ classes in the NS-SEC and we have grouped them into 5 categories: ‘higher professional and managerial’, ‘lower professional and managerial’, ‘intermediate’, ‘higher working class’ and ‘lower working class’.
We use this grouping to look not only at a person’s socio-economic or occupational background – in other words, what job a person’s parents did – but also what jobs people are currently doing. For example, if we say that someone has a ‘higher professional background’, this means that their parents had a higher professional or higher managerial occupation.[footnote 6]
Previous groupings included only 3 categories – ‘professional and managerial’, ‘intermediate’ and ‘working class’. However, these categories were broad and did not provide enough information to understand short-range mobility. Using 3 categories also meant that there was considerable variation within each category.
Table 1.1: Our 5-part grouping of occupational classes based on the NS-SEC.
| NS-SEC | Previous 3-part grouping | 5-part grouping | Example occupations |
|---|---|---|---|
| 1 | Professional and managerial |
Higher professional including higher managerial, administrative and professional |
Chief executive officer of large firm, doctor, clergy, engineer, senior army officer |
| 2 | Professional and managerial |
Lower professional including lower managerial, administrative and professional |
Teacher, nurse, office manager, journalist, web designer |
| 3 and 4 | Intermediate[footnote 7] |
Intermediate including intermediate occupations, small employers and freelance workers |
Clerical worker, driving instructor, graphic designer, shopkeeper, hotel manager, taxi driver, self-employed roofer |
| 5 and 6 | Working class |
Higher working class including lower supervisory, technical and semi-routine workers |
Foreman, mechanic, electrician, train driver, printer, shop assistant, traffic warden, housekeeper, farmworker |
| 7 and 8 | Working class |
Lower working class and workless families |
Cleaner, porter, waiter, labourer, refuse collector, bricklayer |
Occupational class versus earnings
Sometimes people in lower occupational classes earn more than those in higher occupational classes. For example, speech and language therapists count as higher professionals, NS-SEC 1, because their job requires a first degree for entry and experience-related training, and the practical application of a body of knowledge to instruct others. Yet their average salary is lower than that of many working-class occupations, including some routine manual occupations.
Example occupations, their NS-SEC classes and median salaries
Speech and language therapists: NS-SEC 1 – higher professional. Median salary: £31,938.
Train and tram drivers: NS-SEC 5 – higher working class. Median salary: £63,853.
Air conditioning and refrigeration installers and repairers: NS-SEC 6 – higher working class. Median salary: £40,564.
Large goods vehicle drivers: NS-SEC 7 – lower working class. Median salary: £38,353.[footnote 8]
Also, 2 people doing the same type of work can be in different classes if one is an employee and the other is self-employed, since the self-employed tend to be classed as intermediate. For example, a bricklayer who is an employee would be in NS-SEC 7, lower working class, while a self-employed bricklayer would be in NS-SEC 4, intermediate class. The salaries in these 2 cases may also be very different.
Absolute and relative mobility measures
Absolute measures capture the number of people who have experienced mobility. They are usually expressed as percentages of the population. For example, the absolute occupational mobility rate is the percentage of people who are in a different occupational class from their parents. For income mobility, a common absolute measure is the percentage of people whose income is higher than their parents’ income was at the same age. We can compare these rates across different regions of the UK.
Relative measures tell us the strength of the link between origin and destination. For example, with occupational class mobility, relative measures compare the chances that at least 2 groups have of reaching, versus avoiding, a particular outcome. It is this element of comparison that makes such measures relative. A relative mobility measure tells us that one group has better chances than another, rather than telling us the total number of socially mobile people. Low relative mobility means that those who start life in a particular position are more likely than others to be in the same position later in life. For that reason, low relative mobility can be thought of as ‘stickiness’, while high relative mobility can be thought of as ‘fluidity’.
Geographical analysis using composite indices
Looking at geographical breakdowns of single indicators, like unemployment or highest qualification, could be misleading for 2 reasons. Firstly, results have to be estimated from sample surveys and sample sizes at a regional or local level can be small. Secondly, we need to take a holistic view of conditions in an area, rather than using only one indicator, no matter how reliable.
To deal with these problems, we introduced summary measures, or composite indices, in 2023. These provided a snapshot of how regions performed across a range of indicators. In this and last year’s State of the Nation reports, we have 4 indices, one which is based on intermediate outcomes and the remaining 3 on drivers, with each index composed of 3 underlying measures. For example, the measure ‘Promising Prospects’ looks at qualifications, occupational level and the earnings of young people, and takes into account their SEB. These give a much more reliable picture of what is going well, and what could be improved, across the UK.
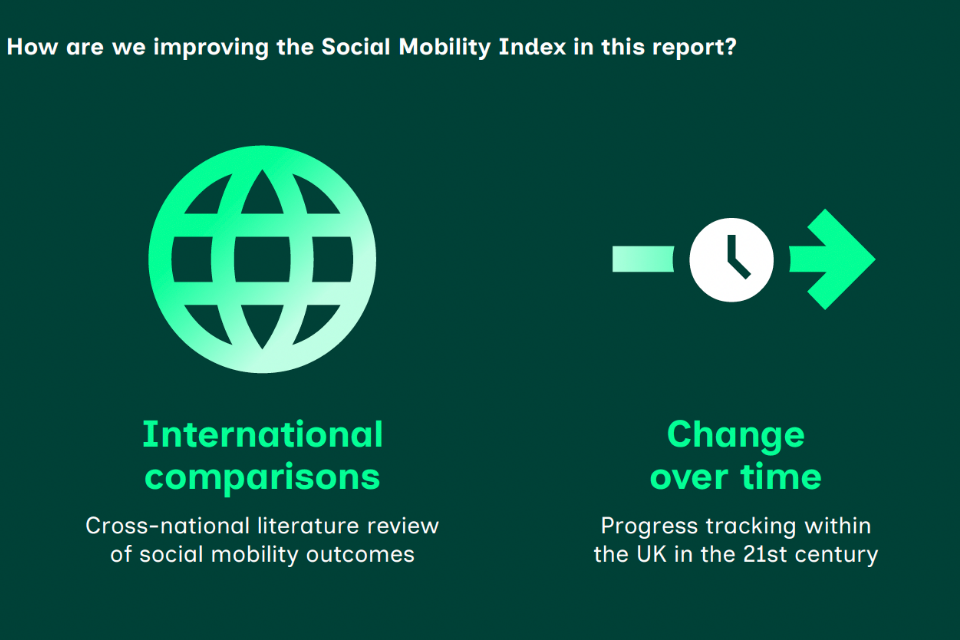
Improvements in 2025
In 2025, we have added 2 important elements to our Index: systematic international comparisons and a more thorough analysis of change over time.
As we continue to monitor social mobility across the UK, we need to ask what a good level of social mobility is. In other words, what should the country be aiming for? We think there are 2 ways that we can check how the UK is doing on social mobility: first, we can compare ourselves with other countries; and second, we can compare the UK with itself over time.
International comparisons
International comparisons are important because they allow us to see what is achievable by other countries. There is no reason that the UK should not aspire to the highest levels of social mobility seen in other advanced economies around the world, and also, a careful look at these countries may give ideas about how to achieve the best results possible.
Change over time
Comparison over time is also vital, especially looking at social mobility for younger people. This is because it gives us early signs of where there is improvement and early warning of decline, so that we have the chance to take action.
By examining which cohorts have experienced greater or lesser mobility, researchers can identify potential factors contributing to these trends. This understanding helps to pinpoint areas and issues that have seen progress, and guide future policymaking to increase social mobility further.
Figure 1.2: State of the Nation 2025 improvements.
Data limitations in the the UK
Tracing trends over extended periods offers deeper insights into how social mobility has evolved. However, analysing such changes at a granular level, for instance by protected characteristics or by area, remains challenging due to data limitations.[footnote 9] This highlights the critical need for better data to support social mobility analysis and broader discussions on data improvements for informing future reports.
Linking parents’ outcomes with children’s
Linking parents’ and children’s tax records and educational records would give us a much more detailed and refined picture of mobility. Without this, researchers cannot look at the earnings or education of today’s adults and compare them with the earnings or education of their parents. Countries such as Sweden and the USA already have linked tax records, enabling pioneering work on the causes of mobility.[footnote 10]
A household-level dataset
Similarly, household-level data would help us to understand the socio-economic circumstances of schoolchildren more clearly. For example, an administrative household-level dataset would help target support on children who are most in need, rather than relying on the current, rather basic, free school meal (FSM) eligibility marker.
Occupational data
There is currently no administrative data on people’s occupation type in the UK. His Majesty’s Revenue and Customs (HMRC) collects data on income, of course, but not on occupation, although it has consulted on this.
Birth-cohort studies
There have only been 4 major birth-cohort studies in the UK since 1945, leaving huge gaps of up to 30 years between studies.[footnote 11]
The Labour Force Survey (LFS)
As in the previous State of the Nation report, we rely on the LFS to understand trends in intermediate outcomes and drivers because it is the only UK data source that collects people’s socio-economic backgrounds and other relevant labour market information. However, the reliability of this data has significantly decreased over the last 10 years. The number of people surveyed has roughly halved, falling from about 99,300 in 2014 to 50,800 today. This is largely due to a sharp decline in the survey’s response rate, which dropped from 48% in 2014 to 39% in 2019, and further dropped to just 17% by early 2024.[footnote 12] To make our analysis stronger, we have used a 3-year rolling average to increase the effective sample size and smooth out large swings in the data. We’ve also carried out specific statistical checks that account for the smaller sample size to ensure that any observed changes are genuinely meaningful and not just random variations.
-
In some areas of the UK, local government is divided between a county council (upper-tier LA) and a district council (lower-tier LA), which are responsible for different services. In other areas, there is a single-tier (or ‘unitary’) LA instead. ↩
-
Yaojun Li and Anthony Heath, ‘Class matters: a study of minority and majority social mobility in Britain, 1982–2011’, 2016. Published on JOURNALS.UCHICAGO.EDU. ↩
-
Carolina Zuccotti and Lucinda Platt, ‘The paradoxical role of social class background in the educational and labour market outcomes of the children of immigrants in the UK’, 2023. Published on ONLINELIBRARY.WILEY.COM. ↩
-
Social Mobility Commission, ‘State of the nation 2023: people and places’, 2023. Published on GOV.UK. ↩
-
The Office for National Statistics collects, analyses and shares statistics about the UK’s economy, society and population. ONS, ‘The national statistics socio-economic classification (NS-SEC)’, 2021. Published on ONS.GOV.UK. ↩
-
The LFS asks respondents what the occupation of the main earner in the household was when the respondent was aged 14 years. This is what we use when reporting SEB using the LFS. ↩
-
Some routine occupations can count as intermediate if the worker is self-employed. ↩
-
Office for National Statistics,‘Earnings and hours worked, occupation by four-digit SOC: ASHE table 14.7a’, 2024. Published on ONS.GOV.UK. ↩
-
Analysis of intermediate outcome trends is exclusively reliant on the UK Labour Force Survey. Due to limited sample sizes, ranging from 30,000 to 90,000 respondents depending on the annual iteration, it’s not possible to break down the data by year and demographic characteristics (for example sex, ethnicity, disability) or geographical area (for example, local authority). Such granular analysis would give statistically unreliable estimates with high levels of uncertainty. ↩
-
Raj Chetty and others, ‘Is the United States still a land of opportunity? Recent trends in intergenerational mobility’, 2014. Published on NBER.ORG. ↩
-
The Centre for Longitudinal Studies manages most of these studies. But the gaps are because maintaining long-term studies over decades is resource-intensive. ↩
-
Office for National Statistics,‘Labour Force Survey performance and quality monitoring report: January to March 2025’, 2025. Published on ONS.GOV.UK. ↩