Chapter 1: Introduction
Published 12 September 2023

© Crown copyright 2023
This publication is licensed under the terms of the Open Government Licence v3.0 except where otherwise stated. To view this licence, visit nationalarchives.gov.uk/doc/open-government-licence/version/3 or write to the Information Policy Team, The National Archives, Kew, London TW9 4DU, or email: psi@nationalarchives.gov.uk.
Where we have identified any third party copyright information you will need to obtain permission from the copyright holders concerned.
This publication is available at https://www.gov.uk/government/publications/state-of-the-nation-2023-people-and-places/chapter-1-introduction
1. Highlights
A person experiences social mobility – by which we mean intergenerational social mobility – when they have different life outcomes from their parents. This could mean a different income level, a different occupational class, or other differences, such as housing or education. Mobility can also be upwards or downwards.
Much existing research focuses on occupational mobility (what job we do) and income mobility (how much we earn). These are important signs of the equality of opportunity in a society.
Our work on public opinions about social mobility suggests that we need to take a broader view. Survey evidence shows that, when people think about what it means to have a ‘better life’ than the last generation, it is better health, happiness and education that are seen as more important than more money or a better job.
But even using a small number of measures to monitor social mobility can be difficult. The new Social Mobility Index, first published in 2022, provides a framework for measuring mobility clearly and systematically across a person’s lifetime.
Our index includes social mobility outcomes, looking at people’s jobs and earnings at different life stages, in comparison with their parents’. We also report on some drivers, or background conditions, that might help or hinder social mobility in the future.
We have made significant improvements to our annual report this year. We have deepened our analysis to show how social mobility outcomes and drivers vary by region and across different groups. We have also added more drivers.
We will continue to work on and improve the index, as well as supplementing it with separate research. For example, into the role of childhood experiences.
2. Social mobility and the Index
Social mobility is important because people should be able to fulfil their potential, without being limited by the environment they were born into. Our circumstances shouldn’t limit us – instead, everyone should have a fair chance to succeed.
The Social Mobility Commission (SMC) monitors social mobility across the UK. We aim to understand how many people are socially mobile, in what parts of the country, and whether a person’s background is limiting opportunity.
But monitoring social mobility is complex and difficult. Data can be hard to get hold of or may not exist at all, such as income records linked across generations. Where data does exist, it can be very hard to interpret. This is why we created the new Social Mobility Index (the index), first published in 2022. We took the best available advice from academics, policymakers, and charities working in the field of social mobility.
Figure 1.0: The new Social Mobility Index
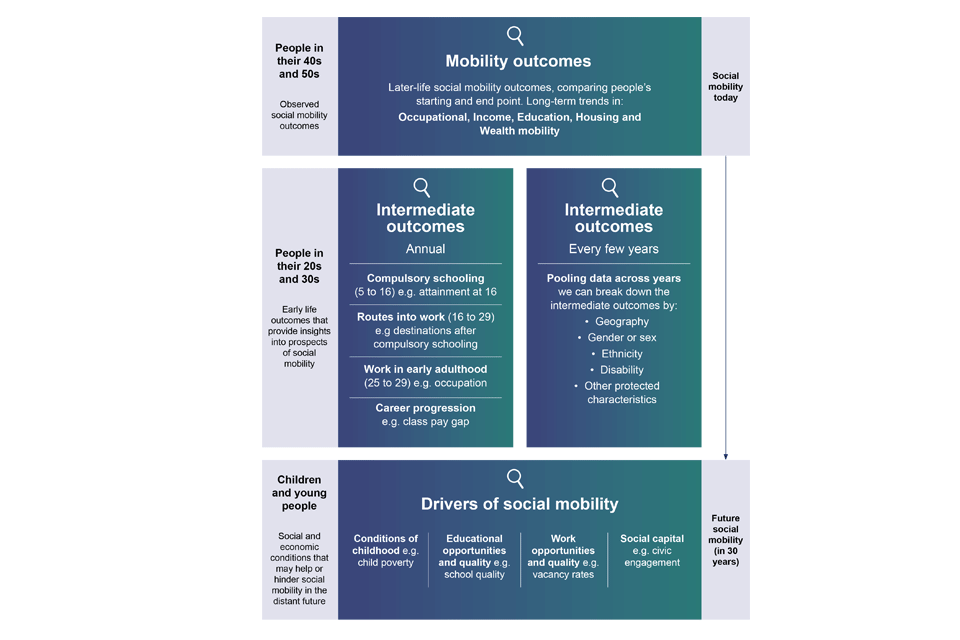
This new framework gives us a much more systematic and comprehensive approach. In our 2022 annual report, we published:
- occupational and income mobility outcomes, looking at people’s jobs and earnings later in life, in comparison with their parents’
- a range of intermediate outcomes, focusing on younger people’s education and employment
- drivers of social mobility, giving us an idea of the background conditions that might help or hinder social mobility in the future
In this year’s report, we deepen the analysis by splitting outcomes and drivers by geography and by protected characteristics, where the data allows.[footnote 1] This gives us much greater insight into where social mobility is and isn’t working, and for whom. It allows us to explore the relationship between the drivers and the outcomes, to better understand how they are related. And finally, it allows us to focus policy recommendations and future research on where it will really make a difference.
2.1 What is social mobility?
The term ‘social mobility’ can have different meanings, but in this report we use it to mean intergenerational social mobility – the difference between your life outcomes and those of your parents. For example, if you have a professional occupation and your parents had a working-class occupation, you have experienced upward occupational mobility. Or if you have a high income and your parents had a low income, you have experienced upward income mobility.
Most sociologists have tended to focus on mobility between occupational classes – the type of jobs people do. Economists have recently turned their attention to income mobility. There are also studies of educational mobility, housing mobility and wealth mobility. What all these approaches have in common is a concern with the chances for people born and brought up in one kind of situation to move up or down the social ladder to a higher or lower position than, or to stay in the same position as, their parents.
The Social Mobility Index continues to enrich and improve the evidence base. It goes well beyond solely reporting on the drivers of mobility. For the first time, we take an in-depth look at both outcomes and drivers split by geography and various characteristics. This is critical for understanding where and for which groups mobility is going well and where we need to improve it.
3. The index in detail
3.1 Outcomes and drivers
The new framework that we introduced last year has 2 types of measure: outcomes and drivers.
Mobility outcomes
Mobility outcomes are about making progress from your parents’ position to your own eventual position as an adult. For example, we might compare the income of a person’s parents with the person’s own income around the age of 50 years. Last year, we reviewed some of the important academic work on income and occupational mobility outcomes. This year, we have produced our own statistics from the most recent available data. We have also covered wealth, education, and housing mobility.
Intermediate outcomes
Intermediate outcomes are similar, but we look at people’s progress from their parents’ position to their own position at an earlier point in life, such as employment in their 20s or educational attainment at age 16 years. This is important, because a person’s outcomes in their 20s can be a very good indicator of how their later life will turn out. It also means that we don’t have to wait 30 or 40 years for full mobility outcomes.
What mobility and intermediate outcomes have in common is that we break outcome measures down by people’s socio-economic background (SEB), so that we can see how different starting points might affect progress to later points.
Drivers
Drivers are the background conditions that make social mobility easier or more challenging. We have included things as drivers if we think they may affect aggregate social mobility rates. For example, the availability of good schools is a driver, because it helps people who wouldn’t otherwise have had an opportunity to be upwardly mobile. Our drivers tell us about these nationwide and regional background conditions.
However, the drivers do not tell us what the UK’s rates of mobility currently are, and they are not broken down by SEB. The question of what is or is not a driver is also distinct from the question of what might help someone achieve upward mobility (like getting a good degree, for example).
3.2 Socio-economic background
In our reporting, a person’s SEB means the socio-economic situation of their parents. For example, this might be the parents’ occupational class, income or education. So for instance, when we talk about someone with a “higher professional background”, we mean that at least one of their parents had a higher professional occupation when this person was a child.
Socio-economic background in the Labour Force Survey
The Labour Force Survey (LFS) asks what job the main earner in the household did when the respondent was 14.[footnote 2][footnote 3] This enables us to look back at someone’s SEB without having to track the same individual across all the intervening years.
3.3 Geography
Geographical regions outlined by the Office for National Statistics
In 2023, we have broken some indicators down by geography. The regions that we use are part of a system developed by the Office for National Statistics (ONS), known as International Territorial Levels (ITLs).[footnote 4] The level of the system we use, ITL2, divides the UK into 41 regions. Each region has between 800,000 and 3,000,000 inhabitants and contains about 4 upper-tier local authorities (LAs).[footnote 5]
In our previous index, published in 2016, we used local administrative data (which covers every individual) to divide the UK into over 300 lower-tier LAs. While this approach was much more geographically detailed, it had 2 major drawbacks: firstly, it only covered England, and secondly, the only measure of SEB available was eligibility for free school meals. This meant that we could report only on educational outcomes.
For the new index, our most important data source, the LFS, has a very large sample size of over 100,000, giving us enough data for the 41 regions. We would like to break down into smaller regions – upper-tier LAs, for example – but we are limited by the sample size available. In the future, by pooling together more years of the LFS data, or by combining indicators into summary formulas, we may be able to publish separate figures for each individual upper-tier LA.
In the meantime, using the LFS has greatly improved the power of our analysis. We can report not only on educational outcomes, but also on occupations and incomes. The LFS also gives us much better insight into people’s SEB and covers the whole of the UK, in line with the SMC’s statutory obligations.
Moreover, by breaking down both the drivers and the outcomes into 41 regions, we can start to look at how drivers and outcomes are related to each other. For example, we have found that, as expected, areas with a lot of professional jobs for young people (a driver) also tend to be areas where the people that grow up there are more likely to earn high salaries and do professional jobs, regardless of their background (an outcome). Yet in contrast, the availability of professional jobs is not correlated with low unemployment – the fact that one is high doesn’t mean the other will be low. We say more about these findings when we discuss the intermediate outcomes in chapter 3.
Figure 1.1: The 41 international territorial levels 2 regions of the UK in our analysis

Table 1.2: The 41 regions of the UK in our analysis
-
Inner London – West (London)
-
Inner London – East (London)
-
Outer London – South (London)
-
Outer London – East and North East (London)
-
Outer London – West and North West (London)
-
Bedfordshire and Hertfordshire (East of England)
-
Berkshire, Buckinghamshire and Oxford (South East England)
-
Cheshire (North West, England)
-
Cornwall and Isles of Scilly, (South West England)
-
Cumbria (North West England)
-
Derbyshire and Nottinghamshire (East Midlands, England)
-
Devon (South West England)
-
Dorset and Somerset (South- West England)
-
East Anglia (East of England)
-
East Yorkshire and Northern Lincolnshire (Yorkshire and the Humber, England)
-
Essex (East of England)
-
Gloucestershire, Wiltshire and Bristol and Bath area (South West England)
-
Greater Manchester (North West England)
-
Hampshire and Isle of Wight (South East England)
-
Herefordshire, Worcestershire and Warwickshire (West Midlands, England)
-
Kent (South East England)
-
Lancashire (North West England)
-
Leicestershire, Rutland and Northamptonshire (East Midlands, England)
-
Lincolnshire (East Midlands, England)
-
Merseyside (North West, England)
-
North Yorkshire (Yorkshire and the Humber, England)
-
Northern Ireland (Northern Ireland)
-
Northumberland and Tyne and Wear (North East England)
-
Shropshire and Staffordshire (West Midlands, England)
-
South Yorkshire (Yorkshire and the Humber, England)
-
Surrey, East and West Sussex (South East England)
-
Tees Valley and Durham (North East England)
-
West Midlands (England)
-
West Yorkshire (Yorkshire and the Humber)
-
West Wales and The Valleys (Wales)
-
East Wales (Wales)
-
Highlands and Islands (Scotland)
-
Eastern Scotland (Scotland)
-
West Central Scotland (Scotland)
-
Southern Scotland (Scotland)
-
North Eastern Scotland (Scotland)
Quintiles
To make things easier to interpret, we present our geographical results by ordering the regions from best to worst, and then dividing them into 5 tiers of equal size, known as quintiles. We use a consistent colour coding across all of our quintile maps, going from dark blue (best) to dark red (worst). We should emphasise that these are purely descriptive statistics and that we are not yet in a position to claim any causal effects of regions on outcomes. And because these statistics are based on sample surveys, they are affected by sampling error.
Data constraints
When doing regional, rather than national, analysis, we need a much larger sample size to be able to draw reliable conclusions. When using surveys other than the LFS, or when using a narrow age range from the LFS, the available sample size leads to imprecise estimates. To deal with this, we have grouped some drivers and intermediate outcomes together to create ‘composite indices’ for regional analysis.[footnote 6] This is explained further below. For the occupational mobility outcome, since this uses the LFS and doesn’t have a narrow age range, this approach wasn’t needed, so we have produced a full regional analysis of occupational mobility in chapter 2.
3.4 Composite indices for geographical analysis
Why composite indices are needed
We have developed composite indices for some of our drivers and intermediate outcomes this year. These are measures that add and summarise a few drivers, or a few intermediate outcomes, into one score.
This is needed because the estimates for individual areas in most cases involve sampling errors (since they are based on sample surveys) and therefore need to be treated with caution.[footnote 7] The sample surveys, such as the LFS, on which we place most reliance, contain relatively small samples within each area. The problem is worse when we focus on results for specific age groups (as with the intermediate outcomes).
The imprecision of the survey-based statistics means that we cannot confidently draw conclusions about the differences in outcomes between geographical areas. Indeed, very few areas prove to be significantly different from the national average when single indicators are used, such as unemployment or earnings.
What the composite indices do
To get around this problem of imprecision, we have constructed composite indices, by combining results from several different individual indicators. These new indices give a summary of how different geographical areas of the UK compare on the main dimensions of mobility that we have identified from the data. This is useful because there’s always a risk that differences between areas in respect of a single measure could be due to random sampling error. But when multiple measures all give a similar picture, we can be more confident that there are real differences among the areas.
Three indices relate to the drivers of mobility, that is to say, the conditions that are believed to promote, or hinder, upward mobility for the people who grew up in the area. We have termed these 3 indices ‘childhood poverty and disadvantage’, ‘sociocultural advantage’ and ‘research and development (R and D) environment’.
There are also 2 indices relating to intermediate outcomes – the measures of how well young people from different areas of the UK are doing with their education and entry into the job market. We have termed these ‘precarious situations’ and ‘promising prospects’. We also hope to develop an additional index summarising school attainment, but this will cover only England, not the whole of the UK.
3.5 Protected characteristics and their intersection with socio-economic background
As well as geographical breakdowns, the LFS has allowed us to break outcomes down by people’s protected characteristics, such as ethnicity. Last year, we only published some limited breakdowns by gender.[footnote 8] This year, we have gone much further, by looking at more protected characteristics, and by carrying out intersectional analysis of these characteristics with SEB.
For reasons of space and readability, not every possible breakdown is featured in this report. We have focused on those breakdowns that may have policy implications. We go into more detail about breakdowns by protected characteristics in chapter 3.
3.6 More detailed occupational classes
Our occupational classes are based on the National Statistics Socio-Economic Classification (NS-SEC) which is the official socio-economic classification of the UK, as set by the ONS.[footnote 9] There are 8 ‘analytic’ classes in the NS-SEC, and in our 2022 report we grouped them into 3. The 3 categories – ‘professional and managerial’, ‘intermediate’ and ‘working class’ – are those set by the ONS and used widely to understand the structure of socio-economic positions in society. This year, we’ve improved on this by grouping them into 5, giving us a more granular analysis. This new grouping allows us to see short-range mobility and differences within the existing professional and working classes.
Table 1.3: The National Statistics Socio-economic Classification (NS-SEC).
| NS-SEC | Our 2022 report | This year’s report | Example occupations |
|---|---|---|---|
| 1 | Professional and managerial | Higher professional, including higher managerial, administrative and professional | Chief executive officer of large firm, doctor, clergy, engineer, senior army officer |
| 2 | Professional and managerial | Lower professional, including lower managerial, administrative and professional | Teacher, nurse, office manager, journalist, web designer |
| 3 and 4 | Intermediate[footnote 10] | Intermediate, including intermediate occupations, small emplovers and freelance workers | Clerical worker, driving instructor, graphic designer, IT engineer, shopkeeper, hotel manager, taxi driver, roofer |
| 5 and 6 | Working class | Higher working class, including lower supervisory, technical and semi-routine workers | Foreman, mechanic, electrician, train driver, printer, shop assistant, traffic warden, housekeeper, farmworker |
| 7 and 8 | Working class | Lower working class and workless families | Cleaner, porter, waiter, labourer, refuse collector, bricklayer |
We use this 5-part grouping to classify both what jobs people are currently doing and their ‘occupational background’ – the jobs that their parents did. For example, if we say that someone has a ‘higher-professional background’, this means that their parents had a higher-professional or higher-managerial occupation.[footnote 11]
By breaking down SEB into 5 categories, we can start to look at important differences within the old professional and working-class groups. For example, we have found that young people from a higher working-class background are no more likely to be not in education, employment or training (NEET) than anyone else. Yet young people from a lower working-class background are much more likely to be NEET. We say more about these findings in chapter 3.
The way that occupational class is defined affects the level of occupational mobility that we measure. The larger the number of occupational groups, the greater mobility will inevitably be, as each group is smaller.[footnote 12]
It is important to highlight that occupational class is not about salary. People in lower occupational classes can sometimes earn more than people in higher occupational classes. There can also be great variation in earnings within a class. The point in a person’s working life at which they reach peak earnings also varies, with the peak typically coming later for professional jobs. Finally, 2 people doing the same type of work – plumbing, for example – can be in different classes if one is an employee and the other is self-employed, since the self-employed tend to be classed as intermediate.
The speech therapist and the metal worker
Higher occupational class does not always mean higher salary. For example, speech and language therapists count as higher professionals, NS-SEC1, because their job requires extensive professional training and accreditation, and they have a high level of autonomy. Yet their average salary is lower than that of many routine manual occupations.
Speech and language therapists: NS-SEC1 – higher professional. Average salary: £28,179[footnote 13]
Metal plate workers and riveters: NS-SEC7 – lower working class. Average salary: £31,247[footnote 14]
3.7 Other changes from the 2022 report
Our index remains comparable with the one we published last year. But we have updated several indicators and added new ones. We have also incorporated other technical changes to improve the robustness of the index. A more detailed explanation of our methodology can be found in the technical annex.
New mobility outcomes
Mobility outcomes – looking at people at a later stage of life – are the core of social mobility analysis, because they show the most reliable estimate of the state of social mobility in the UK. In 2023, we include more types of mobility outcomes beyond income and occupation. We have added education, housing and wealth outcomes, and will keep our list of outcomes under review to make sure that we are capturing what matters.
New drivers
We have included drivers of social mobility in our index if evidence suggests that they affect overall mobility rates at a national or local level. This year, we have added 3 more drivers related to innovation and entrepreneurship, as there are reasons to think that this may increase mobility. In chapter 4, we set out in detail our measures of broadband speed, business spending on research, and numbers of university research students.
In some cases, such as various types of parenting activities, there is no annual data source for us to use, so we have not been able to include it.[footnote 15] We will look into publishing separate reports on drivers like this. In other cases, such as levels of innovation, there is currently no good data at all. We will continue to monitor the situation and add or remove drivers as evidence suggests and data allows.
New data sources
In a few cases, we have changed the data source that we are using to measure a concept. For example, in June 2022, we used the UK Household Longitudinal Survey (UKHLS, also known as Understanding Society) to report the number of parents with degrees and other qualifications.[footnote 16] This year, to take advantage of its larger sample size, we are using the LFS.
3.8 Data quality and missing data
Data gaps
There are still significant data gaps in the analysis of social mobility in the UK. This isn’t a headline-grabbing issue, but it is fundamental for good analysis and good policy. Without the correct data, expensive and lengthy policy interventions can end up being misdirected.
In December 2022, we published a report detailing these gaps and calling for action.[footnote 17] We will publish updates on progress in future annual reports.
Table 1.4: Examples of data gaps in the analysis of social mobility
Socio-economic background of children in school: Eligibility for free school meals (FSM) is still the only measure in use.[footnote 18] It has different eligibility criteria across the UK, and eligibility has changed over time, so meaningful comparisons are difficult. Since it’s a binary measure (eligible or not eligible), we cannot focus on the very worst off or those just above the FSM threshold.
Household income: Relatedly, there is still no administrative dataset giving a household picture of income, as children are not linked with their parents in the existing data. Instead, we have to use rather small and irregular longitudinal studies that, for example, follow children from birth to adulthood. This means that we have a limited understanding of the economic circumstances of children, especially concerning its geographical distribution.
Occupational data: There is very limited administrative data on occupations, so occupational mobility has to be estimated from surveys, with consequent limitations on geographical detail.
Cross-generational linking of income: Unlike, for example, the US, the UK doesn’t link tax records across generations. The UK has no official data source for the reliable measurement of income mobility.
There continue to be surprising gaps in the data and a lack of harmonisation in some measures across England, Northern Ireland, Scotland and Wales. These challenges tend to arise when devolved governments adopt different systems and measures, such as on education. So we will advocate for the efforts of the UK and devolved governments to agree on harmonised data and methodologies to make possible consistent comparisons across the UK nations.
Limitations of the Labour Force Survey
While the LFS is an incredibly useful tool, it still does not allow us to get reliable estimates from small geographical areas, such as lower-tier local authorities.[footnote 19] This is unfortunate because there may be very notable differences, for example, between different areas of large conurbations or different parts of a county.
We also know that, as with any survey, some groups of people are less likely to respond. While the ONS takes measures to avoid such sampling bias, it can cause particular problems for the analysis of social mobility.[footnote 20] This is because the groups least likely to respond tend to be those from more disadvantaged areas and have the most problems with social mobility.
4. Public perceptions of social mobility
Conversations in the media and among politicians about social mobility may be very different from those taking place among the public. For that reason, we used our findings from the 2022 British Social Attitudes Survey and follow-up focus groups to find out what “social mobility” means to some members of the public, and how they think the UK is doing.
Our survey of 3,389 UK adults gave us a timely snapshot of people’s thoughts on social mobility after 2 years of the COVID-19 pandemic. It revealed that most people think that having a better life than your parents is best described as being healthier (57%), happier (52%) or having a better education (44%). Material circumstances, like earning more (18%), a better job (15%), or a better home (14%) were seen as less important.
People still think that there are large differences between social classes in the UK. 91% of all surveyed adults believed that these differences are wide (with 56% describing them as ‘very wide’ and 35% as ‘fairly wide’). 4% said they were ‘not very wide’ and 2% stated that there were ‘no differences between classes’.
In follow-up discussions, there was general agreement that access to a good education is important, as well as knowledge of the work opportunities that exist. Participants also agreed that everyone needs a mixture of self-motivation and the right conditions to succeed, with governments playing an important role in the latter.
“My parents would say – we have to go to university. There were 5 of us but we all had to go. There was no choice. If you don’t have qualifications, how are you going to succeed?” Focus group member
“The individual has got to want to change in the first place. You have to be resilient – you will always get knockbacks in life.” Focus group member.
A finding that was perhaps more surprising, and may be more significant, is that participants did not always rank wealth and money as the most important outcomes. Other important attributes of a “good life” included good health, access to quality education and, perhaps, good emotional or psychological elements. Respondents referred to strong family relationships, stability, being happy, being content with your life, and having the sense of living a fair and equal life.
“People think of success as being at the top and having lots of money. But, for me, it’s not really about that. It’s about having enough money not to worry about money.” Focus group member
It may be that, once a reasonable level of income, wealth and housing are reached, these things matter less than health, education or happiness. This is consistent with standard economic thinking – once we have a reasonable level of any material thing, acquiring more of it might matter less.
Participants also described disadvantage in a nuanced way. Factors mentioned as contributing to disadvantage included: living on benefits or minimum wage, poor housing, lack of access to good healthcare, low level of literacy, lack of employment prospects, and lack of emotional stability growing up. Interestingly, good personal relationships were seen as just as important as access to services and resources for tackling disadvantage.
“Good relationships – with your parents, your partners, your neighbours. A good support network for when times go bad.” Focus group member.
As we take forward our programme of research into social mobility, we will revisit this topic to ensure that we capture what really matters to the people behind the statistics.
5. Summary of improvements and future work
This year’s report is a significant step forward from last year, which in turn built on previous work. Our index is more systematic and brings more insights than before, but there is still room for improvement. No single publication could ever be the last word on this topic. As the evidence base develops, we expect to modify our selection of drivers. And as more and better data becomes available, we can attempt more sophisticated analysis.
5.1 Strengths of this year’s approach
Our development of the index from last year has brought many improvements:
- we have added new drivers, intermediate outcomes, and mobility outcomes to the index, making it more comprehensive and giving a fuller picture
- we have broken down several outcomes by geography, showing where social mobility is working relatively well and where it may need improvement
- our new geographical approach has allowed us to start to investigate how outcomes might be related to drivers, by checking how drivers and outcomes correlate across regions
- breakdowns by protected characteristics mean we can understand how differences between groups and how they are treated may affect mobility
- our new 5-part division of SEB gives a much more detailed look at the very top and bottom, revealing important new findings
- we have used more sophisticated techniques, such as multilevel modelling, to take account of how people are clustered within different areas
- when using sample surveys, we have taken account of sampling error and the resulting imprecision of the estimates
5.2 Selection of drivers
As we did last year, we have included drivers that we think may have a causal influence on rates of social mobility. The evidence will always evolve, so we may include further drivers (such as digital connectivity or crime), or remove some that are already included if this is appropriate.
5.3 Analysis of causes
While we have chosen drivers thought to be causally related to social mobility, none of the indicators reported here have a causal design. This means that we cannot infer cause and effect, or the size of effects, from the statistics reported here.
Yet descriptive statistics can help to narrow the search for causes. They can identify where particular problems warrant further investigation. From this starting point, we – and, we hope, others – can conduct further research. This might look at an individual’s chances of mobility, what governments can do to raise mobility rates, what parents can do to help their children, and what people can do to help themselves.
-
According to the Equality Act 2010, protected characteristics are age, disability, gender reassignment, marriage and civil partnership, pregnancy and maternity, religion or belief, sex, sexual orientation, and race (including colour, nationality, and ethnic or national origin). It is against the law to discriminate directly against someone with any of these characteristics. ↩
-
“The Labour Force Survey is a study of the employment circumstances of the UK population. It is the largest household study in the UK and provides the official measures of employment and unemployment.” (Office for National Statistics website). ↩
-
Office for National Statistics, ‘Labour Force Survey, user guide volume 3 – details of LFS variables 2021. Version 1 – April to June 2021’, 2021. Published on ONS.GOV.UK. ↩
-
Office for National Statistics, ‘Territorial levels UK, international territorial levels’, 2021. Published on ONS.GOV.UK. ↩
-
In some areas of England, local government is divided between a county council (upper tier) and a district council (lower tier), which are responsible for different services. In other areas, there is a single unitary authority instead. ↩
-
A composite index is an analytical technique that allows you to group several measures together to create a composite score. ↩
-
Sampling errors are a common feature of survey design and cannot be completely avoided. They occur because no 2 random samples, even when taken from the same population, will be exactly alike. A population will never be perfectly represented by a sample, because the population is larger and more complete. ↩
-
We use the terms “gender” and “sex” throughout this report depending on the data source and variable of measurement in respective datasets. ↩
-
The Office for National Statistics collects, analyses and shares statistics about the UK’s economy, society and population. ↩
-
Some routine occupations can count as intermediate if the worker is self-employed. ↩
-
The Labour Force Survey (LFS) asks respondents what the occupation of the main earner in the household was when the respondent was aged 14 years. This is what we use when reporting socio-economic background using the LFS. ↩
-
Between 2014 and 2022, our sample from the Labour Force Survey has the following composition by occupational class: higher professional (14.1%), lower professional (23%), intermediate class (19.5%), higher working class (16.8%) and lower working class (26.5%). ↩
-
Office for National Statistics, ‘Earnings and hours worked, occupation by four-digit SOC: ASHE table 14’, 2021. Published on ONS.GOV.UK. ↩
-
Office for National Statistics, ‘Earnings and hours worked, occupation by four-digit SOC: ASHE table 14’, 2021. Published on ONS.GOV.UK. ↩
-
Social Mobility Commission, ‘The childhood origins of social mobility’, 2016. Published on GOV.UK. ↩
-
Social Mobility Commission, ‘State of the Nation 2022: A fresh approach to social mobility’, 2022. Published on GOV.UK. ↩
-
Social Mobility Commission, ‘Data for social mobility: improving the collection and availability of data across government’, 2022. Published on GOV.UK. ↩
-
For some disadvantage measures the Department for Education includes children who have been in care. ↩
-
A specified by the Office for National Statistics (ONS). A lower-tier local authority can consist of: local authority districts, unitary authorities, metropolitan districts, London boroughs. For more information, see ONS, Lower-tier local authority to upper-tier local authority (April 2019) lookup in England and Wales’, 2019. Published on DATA.GOV.UK. ↩
-
See the Labour Force Survey – user guidance document on background and methodology for more information. Published on ONS.GOV.UK. ↩