State of the Nation 2022: Chapter 1 – The new Social Mobility Index
Updated 21 July 2022

© Crown copyright 2022
This publication is licensed under the terms of the Open Government Licence v3.0 except where otherwise stated. To view this licence, visit nationalarchives.gov.uk/doc/open-government-licence/version/3 or write to the Information Policy Team, The National Archives, Kew, London TW9 4DU, or email: psi@nationalarchives.gov.uk.
Where we have identified any third party copyright information you will need to obtain permission from the copyright holders concerned.
This publication is available at https://www.gov.uk/government/publications/state-of-the-nation-2022-a-fresh-approach-to-social-mobility/state-of-the-nation-2022-chapter-1-the-new-social-mobility-index
1. Key insights
‘Social mobility’ refers to the link between our starting point in life, and where we end up. When our starting point strongly determines where we end up, mobility is low. But if people from all starting points and backgrounds have a good chance of achieving any outcome, then mobility is high.
The term ‘social mobility’ has been widely used, with a range of different meanings. But to have a useful basis for public discourse and policy, we have to look at a range of clearly defined social mobility outcome measures, consistently over time.
We have developed a new and improved measurement framework that goes well beyond reporting on the drivers of mobility.
Our new index provides, for the first time, a systematic look at social mobility outcomes themselves, and a critical starting point to improve the evidence base. We will focus on the mobility outcome of occupational class, and add further outcomes like income, wealth, education and housing, as the data allows.
We have identified important data gaps, which make reporting on social mobility, and targeting policies on those most in need, more difficult. For example, there is no administrative dataset covering income at the family level.
By reporting mobility measures clearly and up front, we can better define the state of social mobility in the UK and understand where we are doing well, and where we need to improve.
2. Introduction
Social mobility is for everyone, not just a few. It is about every single person having the chance to succeed. It is the idea that where you start in life may help to shape your opportunities, but should not determine where you end up. It is about ensuring that your own potential, individual choices, and merit determine your outcomes. Your background, such as the place you grew up in or your family circumstances, should not limit your options or future.
The Social Mobility Commission (SMC) monitors progress in social mobility across the UK. However, progress can be difficult to track, and change will also be slow – there is often a time lag of an entire generation before the impact of any intervention becomes clear. We need the right tools to get an accurate picture of the state of social mobility now, and what the prospects are for the future. Without this clarity, we cannot focus on what needs to change.
Our new, improved Social Mobility Index is an innovative long-term measurement framework for social mobility in the UK. It replaces the Commission’s original Social Mobility Index, launched in 2016. This helped us to understand geographic disparities in some of the ‘drivers’, or enablers, of social mobility in England alone, but it didn’t report social mobility outcomes.
The new framework we introduce in this report is much bolder. While it is still a work in progress, it sets out a long-term vision for measuring and monitoring actual social mobility outcomes, over the next 30 years and across the whole UK.
To develop our new and more comprehensive index, we have conducted an extensive review of the literature on social mobility. We have also consulted a wide range of experts from different disciplines such as economics, geography, psychology, and sociology, and stakeholders from government, business, education, and third-sector organisations.
What is social mobility?
The term ‘social mobility’ can have different meanings, but in this document, we use it to mean intergenerational social mobility – the difference between your life outcomes, and those of your parents. For example, if you have a professional occupation and your parents had a working-class occupation, you have experienced upward occupational mobility. Or if you have a high income and your parents had a low income, you have experienced upward income mobility.
Most sociologists have tended to focus on mobility between occupational classes, while economists have recently turned their attention to income mobility. In this report, we have provided a greater focus on occupational mobility, because it has the most extensive data at present.
There are also studies of educational mobility, housing mobility and wealth mobility. What all these approaches have in common is a concern with the chances for individuals born and brought up in one kind of situation to move up or down the social ladder to a higher or lower position, or to stay in the same position as their parents.
The new index provides a critical starting point to improve the evidence base. It goes well beyond solely reporting on the drivers of mobility. For the first time, we take a systematic look at social mobility outcomes themselves. Although not perfect, this is critical for understanding where and for which groups mobility is going well, and where we need to improve it.
3. Outcomes and drivers
The previous Social Mobility Index focused on differences in children’s educational performance across English local authorities, together with some measures of social conditions such as poverty. It did not include any final social mobility outcomes. In other words, it did not examine where those children ended up in life, to understand how their starting conditions might have harmed or helped them. We want to improve on this with the new index, and to distinguish clearly between mobility measures and drivers of mobility. By reporting mobility measures clearly and up front, we can better define the state of social mobility in the UK and understand where we are doing well and where we need to improve. Therefore, our new framework has 2 types of measure: drivers and outcomes.
Drivers are the background conditions that make social mobility easier. For example, the availability of good education is a driver, because it helps people to be upwardly mobile. So our measures of drivers tell us about these nationwide background conditions. They do not tell us what the UK’s rates of mobility have been, and they are not broken down by socio-economic background.[footnote 1]
Intermediate outcomes are the progress that people make from their start point to an early end point, such as employment in their 20s, or educational attainment at 16. We break outcome measures down by people’s socio-economic background, so that we can see how different starting points affect progress to end points.
Mobility outcomes are similar, but they are about progress to a later end point, such as employment or income when people are in their 50s. We have only included a few illustrative measures of mobility outcomes this year.
4. How we have structured the new index
Our social mobility outcome measures show where people end up in comparison with where they started. This is across a range of outcomes, including occupational class, income, education, and either at an earlier stage in their lives in their 20s and 30s (intermediate outcomes), or a later stage in their 40s and 50s (mobility outcomes). We look at this across the life course to understand both short and long-term mobility, while the drivers look at UK-wide factors with evidence to show that they enable or impede social mobility.
4.1 Mobility outcomes – looking backwards
In future publications, the new index will allow us to measure mobility outcomes at a later stage in life, typically when people are around 50 years old. These measures will compare people’s starting point in life (for example, their parents’ occupation or income) with where they have ended up later in life (for example, their own occupation or income at age 50 years).
These measures are necessarily backwards looking, because a person’s eventual life outcomes are influenced by their circumstances while they were growing up. For example, the effects of educational interventions in early life would not show up in such measures for over 40 years, and if we are looking at the outcomes of people who are now in their 50s, they were in primary school in the 1970s.
But looking backwards can help us define and understand the problem. If we can see that social mobility has not been in decline over the past decades, and that changes in the labour market have provided much of the upward opportunity in that time, it may lead us to very different policy conclusions from a narrative of long-term decline, with education as the only solution. We will examine the evidence on mobility outcomes in chapter 2.
4.2 Intermediate outcomes – looking at the present
Intermediate outcomes are measured at an earlier stage, when people are still in education or their early working life. These measures, like the mobility outcomes, will compare people’s starting point with their current situation. For example, we look at the current occupational class of young people from different socio-economic backgrounds. Such measures give us an early indication of where young people may end up, allowing us to get a sense of the current state of social mobility.
By pooling data on these intermediate outcomes over several years, we can get large enough sample sizes for detailed breakdowns. This will be both by geography, and by protected characteristics, like sex, ethnicity, and disability, where the datasets allow this. For example, the data will help to tell us how mobility chances vary across the UK and how we might consider improving chances in some areas to make them more equal. We expect to be able to do this with 5 years’ worth of data.
4.3 Social mobility drivers – looking at the future
As well as monitoring these social mobility outcomes, we also want to have forward-looking indicators, so that further research (and, ultimately, policy adjustments) can be considered sooner rather than later.
The drivers are those factors, like educational opportunity or social capital, with good evidence to show that they can help increase rates of upward mobility for groups with historically lower rates. These factors will also reduce the influence of parental circumstances on children’s social mobility chances; see the methodology for more information. The evidence is not always clear cut, and further evidence may emerge in the future that would allow us to include other drivers, like culture or parenting.
We can use the drivers and outcomes to make comparisons over time and between different areas of the UK to understand where problems may be emerging. Of course, the data alone cannot explain these trends or tell us how to change them, and many potentially important drivers are not available as datasets. Further work would be needed to understand why some areas, or some groups of people, may be doing better or worse than others, and to make recommendations on how to address this. A separate area of study is those who go against the norm or “buck the trend”, for example, those who succeed despite coming from lower socio-economic backgrounds. It’s important for us to understand why this happens.
4.4 Summary of the index
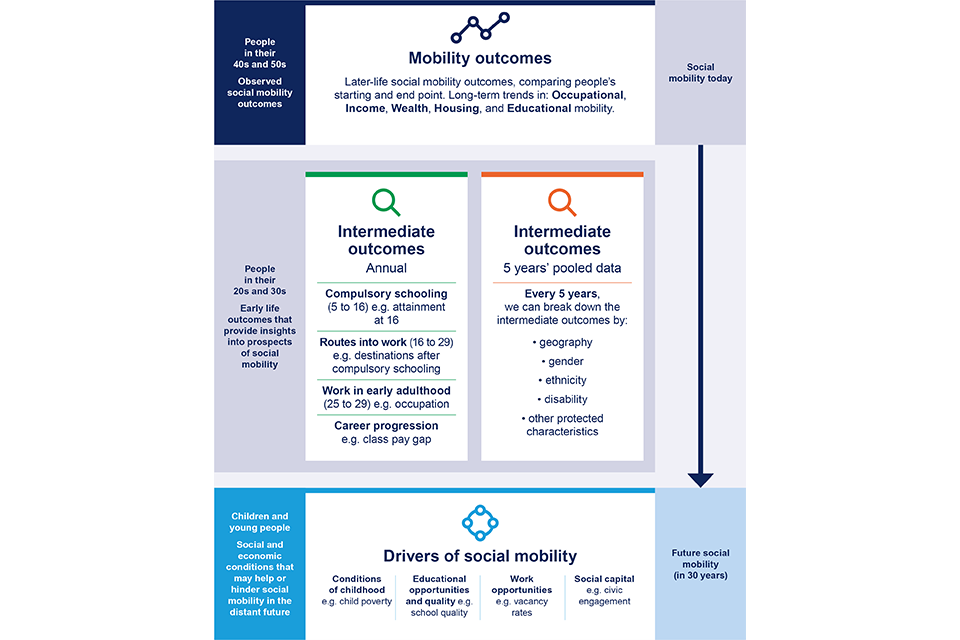
The new index includes a range of measures, capturing mobility across a person’s life. As shown in figure 1.0, these include:
-
mobility outcomes in the adult population, covering primarily occupational mobility, as well as income, wealth, housing, and educational mobility
-
5-yearly measures of the intermediate outcomes, based on pooled data of intersectionality between socio-economic background and other characteristics (such as sex, ethnicity, disability, and place)
-
annual measures of intermediate outcomes such as educational attainment and post-school transitions into the labour market
-
drivers of social mobility, including conditions of childhood, educational and work opportunities, and social capital, to understand what the future social mobility trends might look like – we look at these conditions across the UK as whole, and not by socio-economic background
Figure 1.0: The new Social Mobility Index
5. How the index will evolve
This new framework significantly builds on existing work. It fulfils our statutory reporting obligations to Parliament and helps us to hold the government to account on the effectiveness of their policy interventions for driving social mobility across all parts of the UK. However, it is not designed to be exhaustive. As research in this area develops and the evidence base improves, we expect that new concepts will be added (see sections below), and that existing ones could be dropped. So the index will evolve over time, both as our understanding improves and as new data becomes available.
5.1 Selection of drivers
To select the drivers for our index, we conducted a thorough review of the literature and consulted with experts. Drivers were included if there was good enough evidence that the concept in question had a causal influence on rates of social mobility (as opposed to a “spurious correlation”; see methodology for more information).[footnote 2] Of course, in any scientific field, evidence evolves over time. We may include further drivers (such as digital connectivity or crime), or remove some that are already included, if the evidence suggests that this is appropriate.
5.2 Hidden drivers
It is likely that there are other drivers of social mobility that we were unable to include due to lack of data. Many of these ‘hidden drivers’ may be personal and cultural, such as work ethic, perceptions of success, parenting styles and the home learning environment.
This means that, like the previous index, the new one currently focuses on showing who is experiencing mobility, with a view to the actions that the government and other bodies can undertake to promote aggregate rates. We will conduct further research to address the issue of an individual’s chances of mobility, and what parents can do to help their children’s chances. If we identify ways to measure hidden drivers, and the evidence is strong enough to justify their inclusion, then we may add them to the index. This will give us a more comprehensive insight into how social mobility outcomes may be trending in the future.
5.3 Data gaps and data advocacy
We are also constrained by the availability of reliable and representative national or local data on a regular basis. There are many surprising gaps in the current data. Gaps exist for a variety of reasons, including a lack of harmonisation in some of our measures of interest across England, Northern Ireland, Scotland and Wales. These challenges tend to arise when devolved governments adopt different systems and therefore measures, such as on education. So we will advocate for the efforts of the UK and devolved governments to agree on harmonised data and methodologies to enable the making of consistent comparisons across the UK nations.
Table 1.1: Examples of data gaps in the analysis of social mobility
| Issue | Data gaps |
|---|---|
| Socio-economic background of children in school | The only measure is eligibility for free school meals (FSM), a binary measure, with completely different eligibility criteria across the UK. For example, this doesn’t allow us to focus on the very worst off, or those just above the FSM threshold. The eligibility criteria for FSM have also expanded recently, making comparison over time more difficult. |
| Family income | Relatedly, there is currently no administrative dataset giving a family-based picture of income, as children are not linked with their parents in the existing data. This limits our understanding of the conditions of childhood in the UK. |
| Occupational data | There is very limited administrative data on occupations, so occupational mobility has to be calculated from surveys, with consequent limitations on geographical detail. |
| Parent-child linking of income | Unlike in the USA, the tax records of parents and children are not linked, making measurement of income mobility more difficult. |
This may seem a dry and technical issue, but it is fundamental for social mobility analysis. If we cannot collect the right data, too much of this work can become elaborate guesswork. We need to think through what this means in terms of the government collecting the data that is needed to shape good policy.
For example, to the best of our knowledge, there is no UK-wide and regularly-updated database showing how young people’s educational achievements are related to their social backgrounds. The closest we can get is a half-measure in England, free school meals (FSM), which captures approximately the poorest 15% of students. This reduces the nuance in how we can compare outcomes and creates a binary result, where we are forced to report on those poorest of students compared to all others. This is a serious limitation, although one which efforts are currently being made to remedy, by developing improved measures.
6. What we will report on this year and next
We expect to be able to present full mobility outcomes in 2023. For this year’s report, we begin by presenting recent evidence of long-term mobility outcomes using wider academic sources to set the context around social mobility in the UK in recent years. We then present our set of intermediate outcomes, and finally the drivers.
We also plan to commission work on how the general public perceive social mobility, what they think works well, what they value, and what they think needs to change. This is not to say that we think perception is better than quantitative data. Comparing the 2, however, is a useful exercise, particularly if we want to understand where the focus of policy should be – we need to hear from the very people who we are serving.
As we more fully operationalise the index in 2023, we will analyse how outcomes are associated with socio-economic background, geography and personal characteristics (such as sex, ethnicity, and disability). This will provide a much more nuanced and richer picture of mobility in the UK, to inform both policymakers and the public.
7. Case studies
7.1 Case study: Charlotte Amy Louise Muir, age 29, from London

A photograph of Charlotte Muir, who is smiling and standing outside her workplace, Pimlico Plumbers.
My parents broke up when I was younger. I grew up in Brixton with my mum. My dad was a carpenter by trade. My mum worked in a bank, but then gave that up to become a special needs coordinator when I was around 5 or 6 to spend more time with me and my sister. As a single-parent family, we didn’t have a lot. It was month by month. My nan and grandad used to help us out. Growing up, it wasn’t easy.
From an early age, I struggled with school. My mum would find different ways of teaching me spelling and maths, like combining spelling with pictures and colouring-in. Still, I used to be in trouble quite a bit and in year 11, I only passed 2 or 3 of my classes.
My mum knew I needed a bit more oomph to get in gear. She said apply yourself and we’ll be here to support you. So I thought about what I wanted to do and picked textiles, information and communications technology (ICT) and woodwork. Also, I got really involved in the Cadets. I always liked to have some structure in life and I think that’s something I’ve carried into adulthood too.
My textiles teacher was brilliant. Even when I was doing GCSEs and felt like the world was against me, she was there. If I had a week off, she would invite me to come in and use the facilities to work on my project. She always gave me the time of day, and I felt I owed it back to her to get good grades. In the end, I did really well in my A levels. I realised that my mum was right, if I applied myself I could do better. That followed me into my working career in electrical installation.
I was working in retail when I had a conversation with my cousin who was an electrician. He said to get into a trade because the money’s good and you can learn a lot. It appealed because I wanted to do something that channelled my brain. I think it’s really important to be challenged.
I did a level 1 electrical installation apprenticeship to see if I liked it. Because I still had a job in retail, it meant working weekends. Obviously, it hindered my personal life but I believe sometimes you have to sacrifice to get to the end goal. It was tough, but I didn’t give up. When I started my apprenticeship, I worked a weekend job for 2 years to pay the bills. I worked hard from day one, but I knew it would be worth it.
In the end, I found an apprenticeship at Pimlico Plumbers and haven’t looked back. Every job is different, every customer is different. I like identifying a problem and fixing it and a trade in general is something which gets the mind going.
Because I’m a woman, sometimes people aren’t expecting me. We’re still in a stage of transition where more women are getting involved in the trades. They say things like, “when they said to me ‘her’ on the phone I was like are you sure?” But it’s funny. I’ve never had a bad experience. I think I get a warmer welcome.
One day, I would like to move into management and colleges have asked me to go in and talk to girls about working in the trades. I could see myself doing that down the road, but at a later date when I can’t lift up my tools anymore!
7.2 Case study: Kayley Curtis, age 23, from Newry in County Down, Northern Ireland
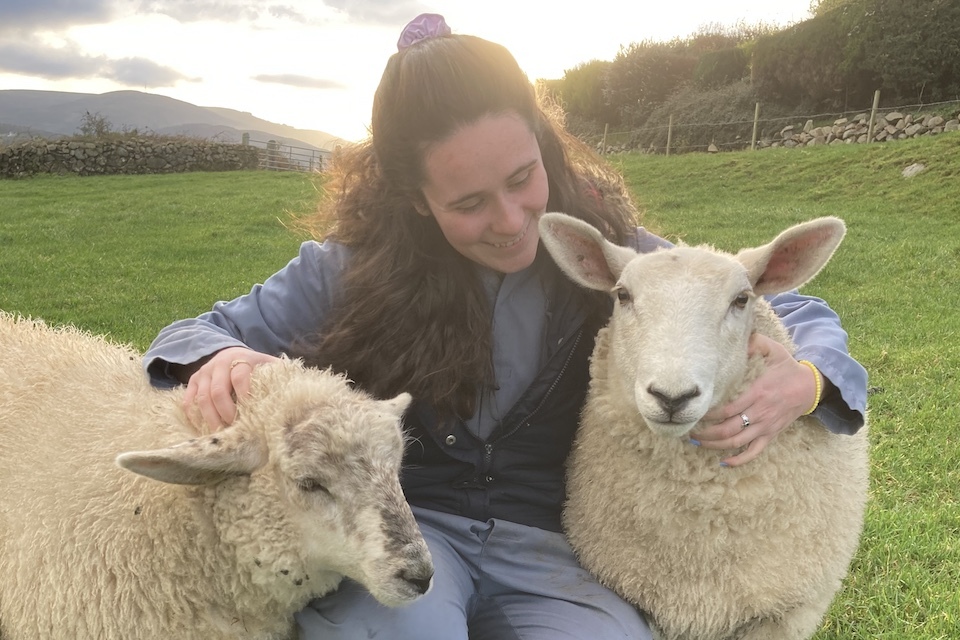
A photograph of Kayley Curtis, who is kneeling down and stroking two sheep on the farm where she lives.
I grew up and still live on a farm. As a child, I used to walk to primary school half a mile away through the fields. Whenever I looked out of the window, I was reminded of farm life, and that formed my attitude. My dad used to go to bed at 2:30am and get up at 4am when the cows were calving. Having a strong work ethic was always built in.
As well as running the farm, my dad looked after me and my brothers. Every morning, he got up before any of us to do his chores, then he’d come into the house and get us ready for school. He had to work really long hours because he wanted to make time for us. That became my motto in life. There’s no such thing as “not having time”, you make time.
My mum has 3 GCSEs and did the same job for 40 years. My dad has never written a CV because he never had to. Because they could see how hard life was without those qualifications, they really pushed me and my brothers academically.
Every evening, regardless of what the teacher told us, my dad would make us read the books we’d brought home cover to cover. He used to send me to school with an adult animal encyclopaedia so that if I had any down time, I could learn. His attitude was: you make the most of your free time, you teach yourself.
Newry, the city I lived near, has some of the best schools in the UK. I was fortunate to get into a really good local school. Because you were surrounded by such good teachers and such intellectual, smart girls, you had to really up your game.
Their career guidance was excellent and one teacher in particular stood out, as she could pick up on everyone’s talents. I was surrounded by people from better-off backgrounds, whose parents often worked in the professions. At times, I felt I was missing the kind of clear career guidance they got at home.
But my teacher gave me tailored support. When I got accepted onto a very competitive Sutton Trust programme, she jumped up and down. She gave me the feeling that I wasn’t just a number.
After A-levels, I went and studied commerce in Dublin. While there, I spent a year working as a supply chain manager for Microsoft and a summer in operations with Amazon. Now I work in the trading team at Applegreen, the second biggest service station provider in the UK.
I still live on the farm and a typical day is manic. I work from home and lunchtimes are spent feeding the sheep. Work finishes at 5pm, then in the evening I volunteer with Comhaltas, an organisation that promotes Irish culture. I’m also training to be a mental health counsellor.
It’s hectic, but in a really good way. Having a multifaceted life means you can pursue lots of different passions. You’re being stretched and thinking in different ways instead of being siloed into one career, one path, one interest.
-
Some concepts could be viewed as both driver and outcome. For example, when we look at educational outcomes split by parental class background, it is a mobility measure, since we have a start point (the family background) and an end point (the educational outcome). But when we look at the quality of education across the whole UK, it is a driver. ↩
-
This type of spurious correlation occurs when 2 variables are associated not by casual association but by coincidence or another factor. ↩