SPI-M-O: Summary of further modelling of easing restrictions – roadmap step 3, 5 May 2021
Updated 13 May 2022

© Crown copyright 2022
This publication is licensed under the terms of the Open Government Licence v3.0 except where otherwise stated. To view this licence, visit nationalarchives.gov.uk/doc/open-government-licence/version/3 or write to the Information Policy Team, The National Archives, Kew, London TW9 4DU, or email: psi@nationalarchives.gov.uk.
Where we have identified any third party copyright information you will need to obtain permission from the copyright holders concerned.
This publication is available at https://www.gov.uk/government/publications/spi-m-o-summary-of-further-modelling-of-easing-restrictions-roadmap-step-3-5-may-2021/spi-m-o-summary-of-further-modelling-of-easing-restrictions-roadmap-step-3-5-may-2021
Summary
1. R in England is estimated to be between 0.8 and 1.0 nationally, the same as that estimated on 7 April 2021 (between 0.8 and 1.0). The impact of relaxations from 12 April 2021 can be seen in these estimates, but the return of schools after the Easter holidays has not yet been fully reflected.
2. There is considerable uncertainty about behaviour, and therefore transmission, at each step of the Roadmap.
3. Modelling presented in these central scenarios is more optimistic than those in SPI-M-O’s previous Roadmap modelling. This is primarily due to recent evidence that vaccines significantly reduce onwards transmission from people who have been vaccinated but nevertheless become infected then symptomatic. This suggests that if baseline policies to reduce transmission are kept in place at the end of the Roadmap, behaviour does not return to pre-pandemic levels, and vaccine roll out progresses, there is an opportunity to keep the next resurgence very small.
4. Neither waning immunity[footnote 1] nor the future emergence or dominance of variants of concern are accounted for in these central scenarios. Depending on its characteristics, a variant either with increased transmissibility or which substantially evades immunity could easily cause a significant wave of hospitalisations or deaths of a similar or larger magnitude than that seen in January 2021.
5. Modelling results are always critically dependent on their input assumptions. While greater clarity has emerged for many of these assumptions, much uncertainty remains on factors such as the rate of transmission at each step as a result of behaviour changes; the extent to which behaviours and baseline measures continue to reduce transmission once restrictions are lifted after Step 4; the impact of seasonal changes in transmission; and future vaccine rollout speed. High vaccine coverage (90% in 30 to 49 year olds and 80% in under 30 year olds) is assumed in these central scenarios.
6. Any resurgence in hospital admissions and deaths following Step 3 of the Roadmap alone is highly unlikely to put unsustainable pressure on the NHS. It is likely, however, that Step 3 will lead to R greater than 1 in England.
7. It is highly likely that there will be a further resurgence in hospitalisations and deaths, however, the scale, shape, and timing of any resurgence remain highly uncertain; in most scenarios modelled, any peak is smaller than any previous wave seen in England. Some seasonal variation in transmission could also delay or flatten the resurgence but alone is unlikely to prevent it altogether.
Key changes since the paper of 31 March:
In previous roadmap modelling, SPI-M-O included the effect of vaccine-induced transmission reduction in several ways:
- preventing a large proportion of vaccinated people becoming infected (and therefore entirely preventing them from transmitting it onwards); in some instances by increasing the proportion of vaccinated but infected people who are asymptomatic (and thus less able to transmit infection onwards) or in sensitivity analyses that assumed a 30% drop in onward transmission from vaccinated but infected individuals.
- To reflect newly published data, 2 of the modelling groups now assume that onward transmission is reduced by up to a half in all people who are vaccinated but nevertheless become infected and as their central assumption.
Groups have considered potential implications of a variant of concern on the possible trajectory of the epidemic. These are illustrative but show that novel variants that either are highly transmissible or substantially escape immunity have the potential to lead to resurgences that are larger than those seen even in January 2021, without non-pharmaceutical interventions.
In previous iterations of modelling the Roadmap, SPI-M-O estimated R0 of SARS-CoV-2 (dominant strain B.1.1.7) to be approximately 4.0 to 5.0. As understanding of this variant has developed since its first emergence over the past 4 to 5 months, SPI-M-O groups now range their central estimates for R0 from 4.5 to 5.5.
London School of Hygiene and Tropical Medicine (LSHTM) now use vaccine effectiveness assumptions that are broadly in line with both Warwick and Imperial College.
Key assumptions in the central scenarios
Values here are for the central scenarios presented by Imperial, LSHTM, and Warwick. Assumptions for sensitivity analyses and other assumptions are given in Appendix 2.
Vaccine reduction in risk of infection
| AZ Dose 1 | AZ Dose 2 | Pfizer/Moderna Dose 1 | Pfizer/Moderna Dose 2 | |
|---|---|---|---|---|
| Imperial | 63% | 63% | 65% | 86% |
| LSHTM | 67% | 68% | 70% | 85% |
| Warwick | 60% | 65% | 60% | 85% |
Vaccine reduction in risk of infection of onwards transmission if infected
(in addition to transmission reduction from lower infection risk).
| AZ Dose 1 | AZ Dose 2 | Pfizer/Moderna Dose 1 | Pfizer/Moderna Dose 2 | |
|---|---|---|---|---|
| Imperial | 45% | 45% | 45% | 45% |
| LSHTM | 0% | 9% | 0% | 8% |
| Warwick | 40% | 50% | 50% | 50% |
Vaccine reduction in risk of symptomatic disease
| AZ Dose 1 | AZ Dose 2 | Pfizer/Moderna Dose 1 | Pfizer/Moderna Dose 2 | |
|---|---|---|---|---|
| Imperial | 63% | 63% | 65% | 86% |
| LSHTM | 67% | 78% | 70% | 89% |
| Warwick | 60% | 80% | 60% | 90% |
Vaccine reduction in risk of hospital admission
(or severe disease)
| AZ Dose 1 | AZ Dose 2 | Pfizer/Moderna Dose 1 | Pfizer/Moderna Dose 2 | |
|---|---|---|---|---|
| Imperial | 80% | 80% | 80% | 95% |
| LSHTM | 84.5% | 90% | 84.5% | 90% |
| Warwick | 80% | 90% | 80% | 90% |
Vaccine reduction in risk of death
| AZ Dose 1 | AZ Dose 2 | Pfizer/Moderna Dose 1 | Pfizer/Moderna Dose 2 | |
|---|---|---|---|---|
| Imperial | 80% | 80% | 80% | 95% |
| LSHTM | 84.5% | 90% | 84.5% | 90% |
| Warwick | 80% | 90% | 80% | 90% |
Coverage achievable
| Under 30s | 30- to 49-year olds | 50- to 79-year olds | 80 and over | |
|---|---|---|---|---|
| Imperial | 80% | 90% | 95% | 95% |
| LSHTM | 84.3% | 88.9-89.2% | 95.4-98.9% | 98.9% |
| Warwick | 80% | 90% | 95% | 95% |
Seasonality
Imperial: 20% peak (February) to trough (August) variation in transmission.
LSHTM: None in central scenario; 10% peak to trough in sensitivity analyses.
Warwick: 10% peak (February) to trough (August) variation in transmission.
Rollout speed
This is based on a scenario, provided by the Cabinet Office, that may not reflect the situation most likely to occur.
Central scenario: 2.7m per week in England until 19th July and then 2m per week thereafter.
The full set of assumptions along with details of the Roadmap are given in Appendices 2 and 3 respectively.
Current epidemic estimates
8. SPI-M-O’s best estimate for R in England is between 0.8 and 1.0 and the growth rate is between -3% and 0% per day, based on data available up to 30 April. These are indicators that lag by approximately 2 to 3 weeks. They cannot fully account for changes in transmission since schools returned after the Easter holidays.
9. On 7 April[footnote 2], before Step 2 of the Roadmap was taken, R in England was also estimated to be between 0.8 and 1.0 and growth rate was between -4% and 0% per day.
10. Estimates of R ranges (Table 1) have increased slightly over the past few weeks. They describe an epidemic that is either flat or slowly shrinking.
Table 1: Combined estimates of R values and growth rates in England, and NHS England regions (90% confidence interval)[footnote 3].
| Nation | R | Growth rate per day |
|---|---|---|
| England | 0.8 to 1.0 | -3% to 0% |
| NHS England region | R | Growth rate per day |
|---|---|---|
| East of England | 0.8 to 1.1 | -4% to +1% |
| London | 0.8 to 1.1 | -3% to +1% |
| Midlands | 0.8 to 1.0 | -3% to 0% |
| North East and Yorkshire | 0.7 to 1.0 | -4% to -1% |
| North West | 0.7 to 1.0 | -4% to 0% |
| South East | 0.8 to 1.1 | -3% to 1% |
| South West | 0.8 to 1.1 | -3% to 2% |
11. Although prevalence varies considerably between different local areas, the pattern of flat or slowly decreasing prevalence is relatively uniform across the country. As restrictions are lifted, local heterogeneity will increase markedly. A doubling time of say, 3 weeks, would have a far more serious result in a local authority which currently has 50 cases per 100,000 per week than in one with 5 cases per 100,000 per week.
12. Data from the Comix study (Figure 1) shows recent increases in the average number of contacts individuals have per day, with levels in adults commensurate with those seen in October 2020, but far below the pre-pandemic average of around 11. Note that the number of contacts remained low in 2020 until the start of August.
Figure 1: COMIX’s estimates for the mean number of daily contacts in the UK for adults and children (red) and for adults only (18 and over) (blue). Vertical grey bands show the dates of the UK’s lockdowns.
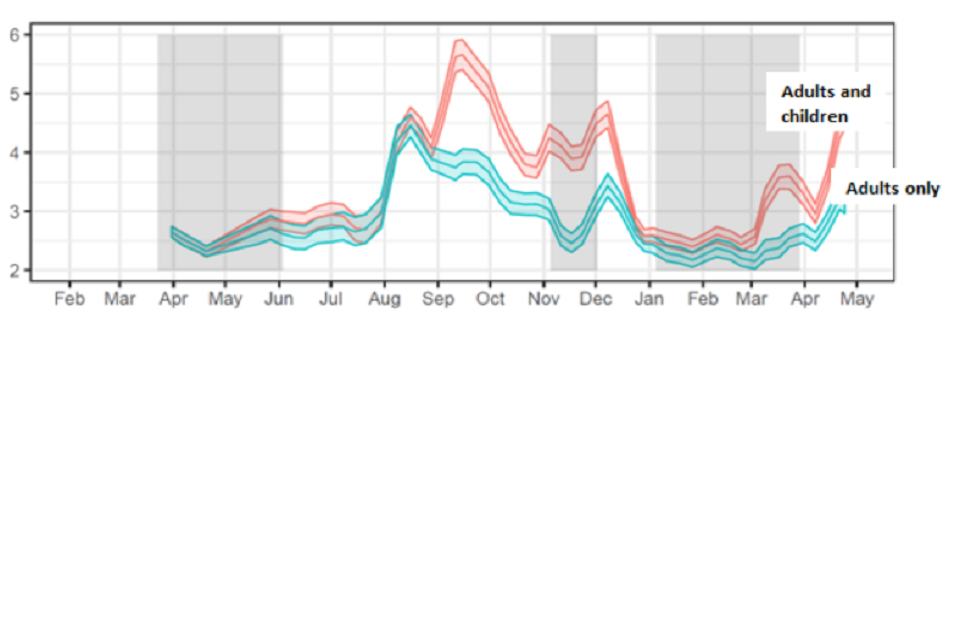
Line chart showing a rise in estimated mean daily contacts in CoMix since April, with a higher mean and larger increase for adults and children compared to adults alone. Estimated contacts have been lowest during previous lockdowns.
Medium term projections and scenarios
13. Each week, SPI-M-O combine estimates from several independent models to project the trajectory of the epidemic if no further changes in behaviour or policy take place. They represent what the trajectory might be if the epidemic continued to follow the trends seen in the latest available data (up to 30 April in this instance). These medium-term projections with, no future changes to R, can be found in SPI-M-O’s previous publications[footnote 4]. They are neither forecasts nor predictions and cannot fully reflect recent changes in transmission that have not yet filtered through into surveillance data.
14. Four of these models have been used to explore the potential impact of a range of scenarios following changes in transmission. These scenarios assume R changes to 0.9, 1.2, 1.5, or 1.8 on 17 May [footnote 5], and run for a further 6 weeks; SPI-M-O considers R equalling 1.8 after Step 3 to be highly unlikely (in the absence of the very rapid emergence of a new variant) but plausible. It also provides a guide for a scenario with a variant that escapes immunity or is more transmissible than the current dominant strain of SARS-CoV-2 in the UK, B.1.1.7.
15. These scenarios are shown on a logarithmic scale in Figure 2 (R equalling 0.9 – green; 1.2 – blue; 1.5 – yellow; 1.8 – red) for England’s hospital admissions alongside the latest medium-term projection of current trends (grey) for comparison.
16. A doubling time in infections of around 2 weeks is consistent with growth in hospitalisations akin to the blue line (R equalling 1.2) in Figure 2. Faster growth in infections will cause faster growth in hospitalisations a few weeks later.
17. Figure 2 shows that the ongoing vaccine rollout programme means that a period with R a little higher than 1 would result in only a very small increase in hospital admissions. An increase of R to 1.5 would result in substantial number of hospital admissions and deaths. Even in this scenario, however, the increase in admissions begin to slow by the end of June as a result of increased levels of immunity, even without the re-imposition of control measures.
Figure 2: Eight-week scenarios for daily hospital admissions in England over a range of R values (0.9 – green; 1.2 – blue; 1.5 – yellow; 1.8 – red) reflecting the possible impact of the easements from 17 May. The grey lines are SPI-M-O’s medium-term projection of current trends. All scenarios show interquartile ranges of model combinations as the shaded band. Note the log scale.
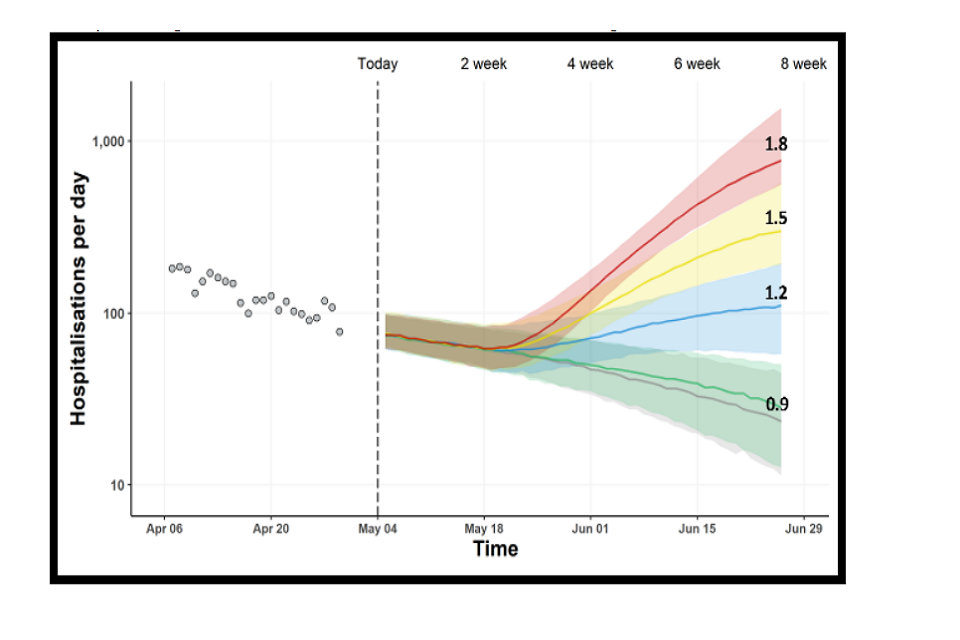
Fan chart showing rising admissions in scenarios where R exceeds 1 on 17 May with substantial rises when R=1.5 or 1.8. Admissions continue to fall in the R=0.9 scenario and medium-term projections. Interquartile ranges overlap for all scenarios until June
Estimated impact of Step 3 alone
Any resurgence in hospital admissions and deaths following Step 3 of the Roadmap alone is highly unlikely to put unsustainable pressure on the NHS, however, the full impact of Step 3 changes will not be seen in these data until at least mid-June.
18. SPI-M-O has considered the results from 3 academic groups that have independently modelled the effect of taking Step 3 of the Roadmap on 17 May but not Step 4. The scenario assumes that, after Step 3 is taken, population mixing is maintained at the same level indefinitely. This scenario has been modelled to allow for an assessment of whether taking Step 3 alone could lead to an unsustainable rise in hospital admissions and deaths.
19. The trajectories of infections, hospital occupancy, and deaths for a range of plausible R estimates resulting from Step 3 of the roadmap are given in Figure 3. Warwick estimate in their central scenario that Step 3 could increase R excluding the effect of vaccines or natural immunity (R_excluding_immunity) from 1.88 (95% CI 1.64 to 2.10) to 2.41 (95% CI 2.25 to 2.57); Imperial College London model a slightly smaller increase up to 2.20 (95% CI 1.83 to 2.62, assuming schools open). As this is R excluding immunity, the effective R would be lower in each case.
20. LSHTM use mobility, rather than step-changes in R, to model the impact of easing measures and their model also assumes waning in both natural and vaccine-induced immunity (15% reduction over 6 months). As a result, their trajectories are significantly higher, although these still do not reach levels that could put the NHS under unsustainable pressure.
Figure 3: England infections (top), hospital bed occupancy (middle), and deaths (bottom) in the Warwick (left – red), Imperial (middle – purple), and LSHTM (right – green) models, assuming central assumptions if Step 3 only is taken, including 80% to 90% uptake in the under 50-year olds. Shaded regions show the 95% credible intervals and lines indicate median of the distributions.
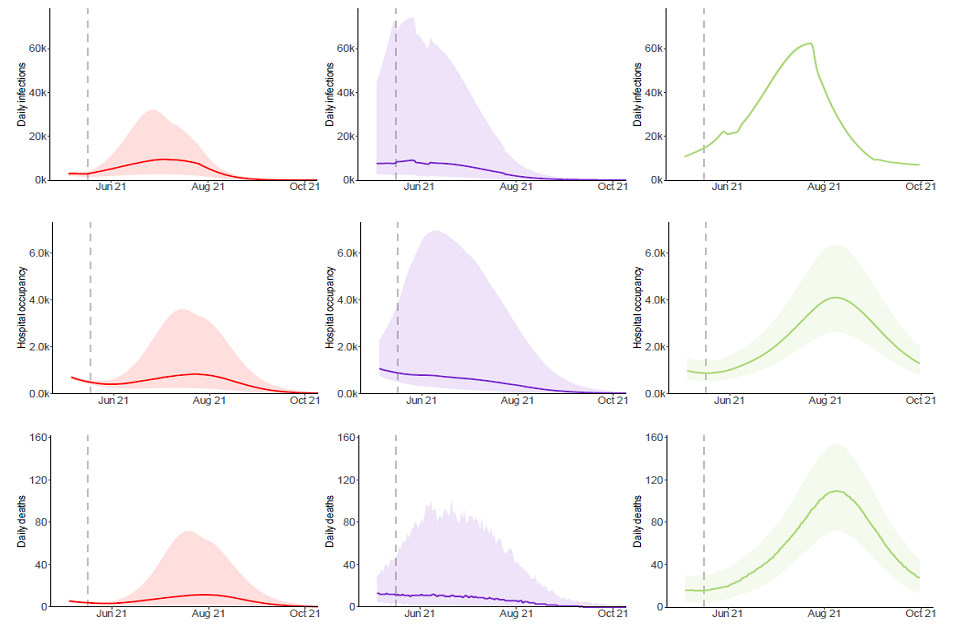
Three sets of line charts showing a potential resurgence in infections, hospital occupancy and deaths post-Step 3. Intervals for occupancy range up to 7,000, though median peaks are more modest in the Warwick and Imperial models and remain below 1,000.
21. The modelled increase in hospitalisations and deaths from Step 3 is expected to be modest. The fairly broad credible intervals encompass a range of possible outcomes that are consistent with Step 3 alone resulting in hospital occupancy reaching levels that range from very low numbers up to 7,000 (as seen in late May or mid-October 2020).
22. There is uncertainty around the scale of effect Step 3 may have on transmission. In addition to their central scenario, Warwick consider a range of sensitivity analyses for Step 3 alone (Figure 4). As expected, the higher R_excluding_immunity is during this time, the larger the resurgence, although in all scenarios considered this would likely be a substantially smaller peak than those seen in Spring 2020 or January 2021.
Figure 4: Sensitivity analysis from the Warwick model of Step 3 only, considering the different impacts of R on the scale of resurgence as a result. Shaded regions show the 95% credible intervals and lines indicate medians of the distributions.
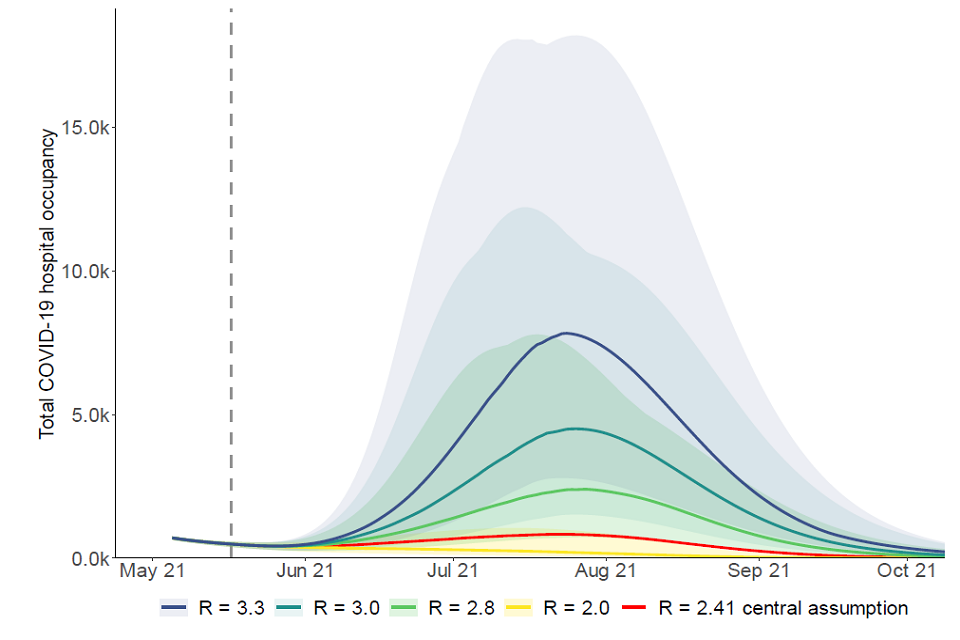
Fan chart showing the scale of resurgence in hospital occupancy following Step 3 alone increases with the level of R excluding immunity post-Step 3. Peak median occupancy rises over 9-fold between the default (Rei = 2.41) and highest scenarios (Rei=3.3).
Modelling of the whole Roadmap
23. The same 3 academic groups have also modelled the full Roadmap, with the assumption that each step of easing will be taken at the earliest possible date.
24. In the central analyses of the full Roadmap, the 3 groups made assumptions that include:
- There is significant transmission reduction as a result of baseline measures and behaviour change after Step 4;
- B.1.1.7 remains the dominant strain and other novel variants are not explicitly modelled;
- Immunity does not wane (neither vaccine- nor infection-induced) [footnote 6];
- Social distancing measures are never re-imposed.
- Vaccines reduce transmission from people who have been immunised but nevertheless become infected, as well as by preventing most recipients from becoming infected at all.
25. If any of these assumptions were changed, the results presented here may be very different. To investigate this, extensive sensitivity analyses have been conducted. These are discussed later in this paper.
26. All scenarios from the 3 groups lead to another wave, however these are considerably smaller than in SPI-M-O’s modelling at Step 2 of the Roadmap. This is primarily the results of new emerging evidence of the extent to which vaccines reduce onwards transmission from people who are vaccinated but nevertheless become infected.
27. For the central scenarios (with significant transmission reduction both due to vaccination and remaining measures after Step 4, very high vaccine uptake, and no waning immunity[footnote 6] or escape variant), the peaks are estimated to be much lower than those seen in either spring 2020 or January 2021 (Figure 5). This suggests that if baseline policies to reduce transmission are kept in place at the end of the Roadmap, behaviour does not return to pre-pandemic levels, and vaccine rollout is not substantially slowed, there is an opportunity to keep the next resurgence small.
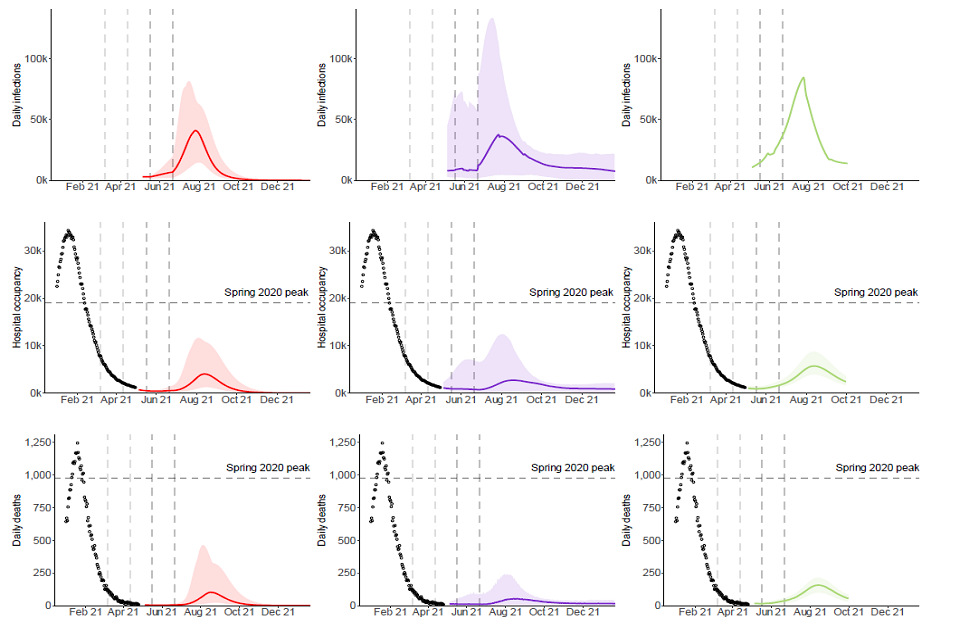
Three sets of fan charts showing a modest resurgence in infections, hospital occupancy and deaths if Steps 3 and 4 are taken in the Warwick, Imperial and LSHTM models. Occupancy/death peaks in July/Aug are similar across models and below Spring 20 levels.
Figure 5: England infections (top), hospital bed occupancy (middle), and deaths within 28 days of a positive test (bottom) in the Warwick (left – red), Imperial (middle – purple), and LSHTM (right – green) models, assuming central assumptions if Steps 3 and 4 are taken including 80% to 90% coverage in the under 50-year olds and significant reduction in transmission from baseline measures continue after Step 4. Peaks in occupancy and daily deaths from January 2021 and levels seen in Spring 2020 are shown by dashed horizontal lines. Vertical dashed lines show the dates at which each Roadmap step is taken. Shaded regions show the 95% credible intervals and lines indicate the medians of the distributions.
28. Any resurgence is due to some people (mostly children) being ineligible for vaccination; others choosing not to receive the vaccine; and others being vaccinated but not perfectly protected (including those who have only received one dose, rather than 2). Even in these small waves, both hospitalisations and deaths are dominated by those that have received 2 doses of the vaccine. This is attributable to the high levels of uptake in the most at-risk age groups, such that immunisation failures account for more serious illness than unvaccinated individuals. This is not the result of vaccines being ineffective, merely uptake being so high that there are relatively few unvaccinated individuals in the population.
29. It is noteworthy that in the models that assume no waning immunity (Warwick and Imperial) this resurgence is no longer anticipated to be accompanied by a very large number of infections over the modelled range (peak of around 40,000 infections per day). In the presence of waning immunity, this could double, as illustrated by the LSHTM modelling;this assumes a reduction in both natural and vaccine-induced immunity by 15% over 6 months and results in a peak of infections of approximately 85,000 per day. Table 2 shows comparisons of cumulative hospital admissions, peak hospital occupancy, and cumulative deaths across the 3 academic groups.
Table 2: Comparisons of cumulative metrics between the 3 academic groups for Step 3 only and Step 3 and 4.
Step 3 only
| Warwick (17 May 2021 to 30 June 2022) | Imperial (1 May 2021 to 9 August 2021) | LSHTM (12 May 2021 to 30 September 2021) | |
|---|---|---|---|
| Cumulative hospital Admissions | 9,100 (2,430 to 26,400) | 10,500 (2,000 to 46,900) | 36,200 (25,700 to 56,700) No waning immunity 12,700 (8,500 to 23,000) |
| Peak hospital occupancy | 1,150 (390 to 3,620) | 1,700 (1,000 to 6,900) | 4,100 (2,300 to 7,400) No waning immunity 1,300 (700 to 2,700) |
| Cumulative deaths | 1,160 (240 to 3,870) | 1,500 (400 to 6,200) | 8,200 (5,000 to 13,500) No waning immunity 2,600 (1,600 to 4,900) |
Step 3 and 4
| Warwick | Imperial (1 May 2021 to 1 June 2022) | LSHTM | |
|---|---|---|---|
| Cumulative hospital Admissions | 34,900 (10,100 to 96,400) | 54,900 (31,100 to 104,100) | 51,900 (28,700 to 99,200) No waning immunity 17,300 (8,500 to 42,400) |
| Peak hospital occupancy | 4,640 (1,270 to 11,700) | 4,200 (1,100 to 12,200) | 5,700 (2,900 to 12,100) No waning immunity 1,900 (900 to 5,600) |
| Cumulative deaths | 7,250 (1,450 to 24,300) | 9,000 (5,100 to 16,600) | 11,200 (6,100 to 23,900) No waning immunity 4,000 (1,800 to 9,400) |
30. There remain risks and uncertainties; the estimated impact on transmission of each step of easing remains unknown and will depend on how people act, and novel variants of concern could have greater effects than considered in these central scenarios. Further consideration of such impacts can be found from paragraph 52 onwards.
31. Sensitivity analyses around these central scenarios have been performed across a variety of factors. Appendix 1 shows box and whisker plots of how these different factors impact the subsequent epidemic trajectory. Sensitivities with significant impact on the size of any resurgence are speed and coverage of vaccine roll out, transmission after Step 3, and transmission after Step 4. Vaccine effectiveness at the lower bounds of current estimates would also lead to markedly poorer outcomes. The effect of increased vaccine effectiveness on blocking onwards transmission and seasonality are also uncertain, but results appear to be less sensitive to these.
32. These sensitivities suggest that, in order for a significant resurgence to materialise (in the absence of a variant of concern), 2 or more factors would need to be worse than the central assumptions made here, for example the combination of low vaccine uptake in the under 50-year olds and high transmission after Step 4. By keeping several policies in place, they act as an insurance against each other – if one fails, others will keep transmission under control. This is a more optimistic situation than previously the case, however, any complacency is not advisable.
Sensitivity to transmission after Step 3 is taken
Maintaining a higher level of control of transmission after Step 3 is taken significantly shrinks and delays the next surge as this reduces the level of infections at the point Step 4 is taken.
33. The size and scale of any resurgence is sensitive to the extent of control that can be achieved after Step 3, as shown in Figure 6. Maintaining a higher level of control after Step 3 reduces and delays the peak of the resurgence by allowing the vaccination programme to have a greater effect; this has a substantial effect on the subsequent increase in infections that happens when Step 4 is taken.
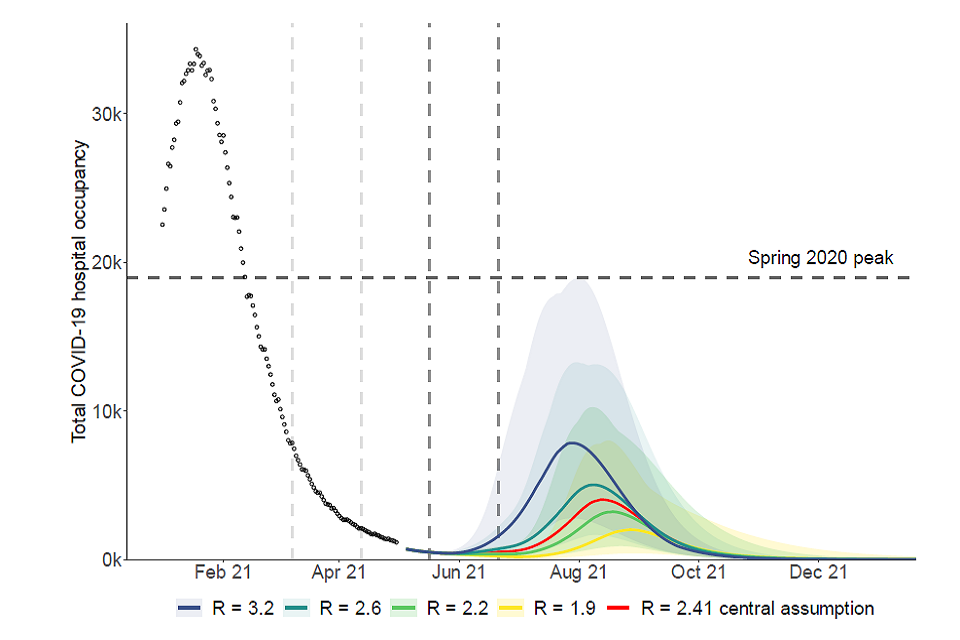
Fan chart showing the resurgence in hospital occupancy following Steps 3 and 4 rises with higher levels of R excl. immunity post-Step 3, with peak median occupancy almost doubling from the central scenario (R=2.41) if R=3.2. The wave also occurs earlier
Figure 6: England hospital bed occupancy in the Warwick model assuming different levels of reduction in transmission after Step 3 of the Roadmap is taken, and Step 4 is taken on 21 June 2021. The central scenario is shown in red, with increased (blue and dark green) and decreased R_excluding_immunity (light green and yellow) sensitivities. R_excluding_immunity after Step 4 is the same in all 4 scenarios and all other parameters are also in line with their central scenario, including 80% to 90% uptake in under 50-year olds. Shaded regions show the 95% credible intervals and lines indicate medians of the distributions.
Sensitivity to transmission once all restrictions are lifted after Step 4 is taken
Maintaining a significant reduction in transmission from baseline measures and behaviour change after Step 4 is taken is almost certain to reduce the size of any subsequent resurgence.
34. SPI-M-O does not know the extent to which transmission could be reduced by baseline mitigation measures after Step 4. Such measures could be partially or exclusively voluntary and / or reflect more permanent societal shifts, such as the extent of home working and the amount of work-related travel. The modelling discussed here does not consider particular initiatives or policies after Step 4, but instead compares levels of transmission reduction to previous time points in the epidemic, for example, pre-pandemic levels or lockdown transmission levels. It is not possible to precisely determine what set of policies would give the equivalent transmission reductions modelled here.
35. As previously advised by SPI-M-O[footnote 7], maintaining a large reduction in transmission from implementation of such measures after Step 4 is almost certain to reduce the size of the subsequent resurgence. SPI-M-O agrees that self-isolation on symptom onset would not, on its own, be sufficient to significantly reduce transmission, because current rates of self-isolation on symptom onset are too low. If, however, the majority of individuals were to fully self-isolate on symptom onset, the reduction of transmission could be large enough to prevent a summer wave.
36. Figure 7 shows Warwick’s central scenario and a sensitivity analysis, which assumes either only a modest reduction in transmission as a result of baseline measures remains once restrictions are lifted after Step 4 (green line in Figure 7) or stringent measures followed by a modest reduction (yellow line in Figure 7).
37. For their central scenario (red line in Figure 7), R_excluding_immunity is assumed to be 3.5 (CI 3.3-3.7), compared to around 4.7 (CI 4.3-5.3) if the country returned to pre-pandemic behaviours, indicating that a large reduction in transmission remains after Step 4. In the scenario analysis, there is only a smaller reduction in transmission as a result of baseline measures, with R_excluding_immunity returning to 4.1 (CI 3.8-4.4). In this situation, less reduction in transmission after Step 4 leads to a larger wave, pushing hospital occupancy and deaths into late autumn. In contrast, a gradual easing after Step 4, where NPIs are first moderately lifted (as the default scenario), then more comprehensibly lifted (as the smaller reduction in transmission scenario) 5 weeks later can lead to a significantly smaller wave than starting with fewer measures (yellow line in
Figure 7). Allowing the vaccination programme to catch up over these 5 weeks reduces the overall impact of releasing NPIs.
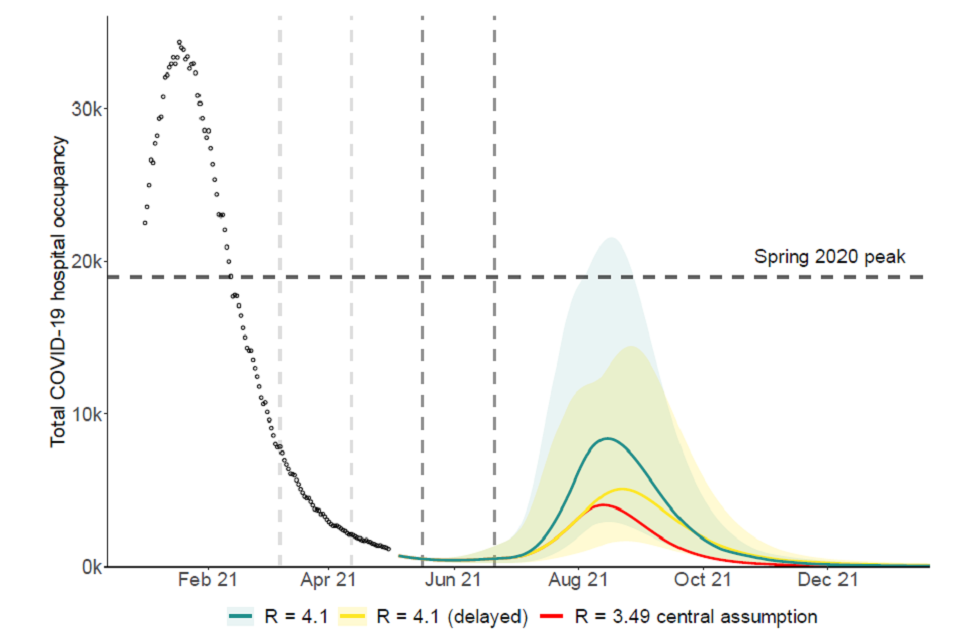
Fan chart showing peak median hospital occupancy doubles if R excl. immunity=4.1 relative to Rei=3.5 (central). If this higher level of relaxation is delayed, the rise in peak height relative to the central scenario is more modest (about 25%).
Figure 7: England hospital bed occupancy in the Warwick model assuming different levels of reduction in transmission as a result of baseline measures after Step 4 of the Roadmap; significant reduction (red), modest reduction (green), or significant followed by modest 5 weeks later (yellow). Other parameters in line with their central scenario, including 80% to 90% uptake in under 50-year olds. Shaded regions show the 95% credible intervals and lines indicate medians of the distributions.
- SPI-M-O’s estimates of R0 (R in the absence of any immunity or non-pharmaceutical interventions) range higher than in previous Roadmap modelling as more data have been generated, including the impact of the now dominant B.1.1.7.
Sensitivity to vaccine effectiveness against transmission
Vaccine effectiveness against infection and onward transmission have substantial impacts on any resurgence, however uncertainties are diminishing as evidence accrues.
39. Data on the real-world effectiveness of vaccination continue to emerge[footnote 8] and there is less uncertainty and differences in groups’ assumptions than in previous iterations of SPI-M-O’s Roadmap modelling (see Appendix 2 and accompanying papers).
40. SPI-M-O has previously included the effect of vaccine-induced transmission reduction in several ways: preventing a large proportion of vaccinated people becoming infected (and therefore entirely preventing them from transmitting it onwards); in some instances by increasing the proportion of vaccinated but infected people who are asymptomatic (and thus less able to transmit infection onwards); or in sensitivity analyses that assumed a 30% drop in onward transmission from vaccinated but infected individuals.
41. To reflect newly published data[footnote 9], 2 of the modelling groups now assume that onward transmission is reduced by all people who are vaccinated but nevertheless become infected and as their central assumption. This study only considered transmission reduction from people with symptomatic infections, but Imperial and Warwick have assumed the same holds for asymptomatically infected people too. This may mean the results here could change in the light of further new evidence.
42. Figure 8 shows that while the inclusion of the additional transmission reduction (solid line) significantly shrinks the peak of next surge, both scenarios show a substantial increase in admissions and deaths.
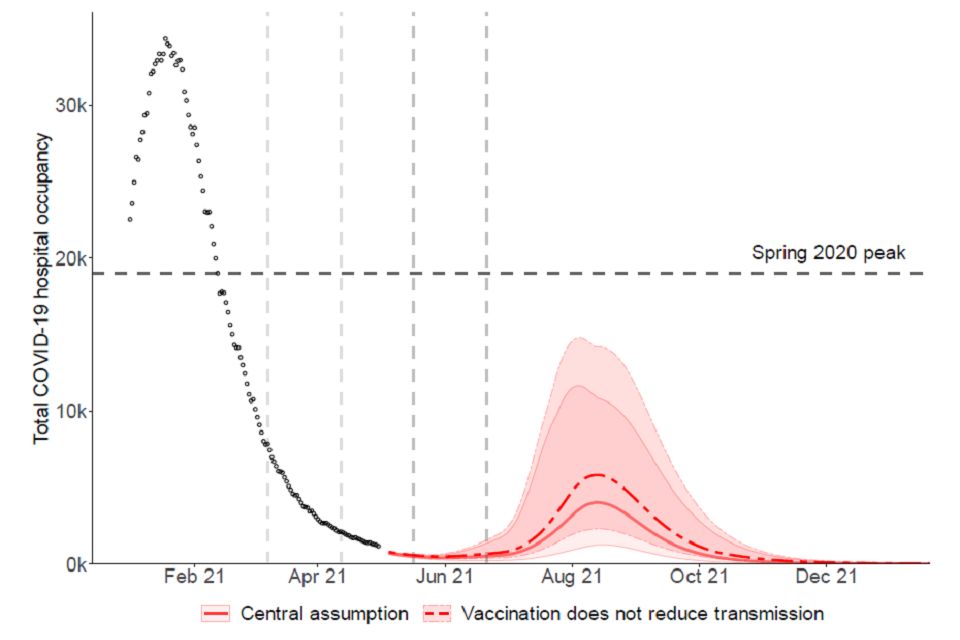
Fan chart showing that the scale of resurgence in hospital occupancy in England increases if vaccination does not reduce onwards transmission in the Warwick model, with peak median occupancy rising from approximately 4,000 to 5,800.
Figure 8: England hospital bed occupancy in the Warwick model assuming different levels of vaccine effectiveness against onwards transmission only. Other parameters in line with their central scenario, including 80%-90% uptake in under 50-year olds. Shaded regions show the 95% credible intervals and lines indicate medians of the distributions.
Sensitivity to rollout speed
Maintaining fast delivery of vaccines over the whole Roadmap period and beyond is vital as even small reductions could lead to increases in hospital admissions.
43. The central rollout scenario modelled here follows a scenario stipulated by Cabinet Office that assumes an average of 2.7 million doses per week are administered in England until 19 July and 2 million per week thereafter.
44.Warwick have considered how different speeds of faster and slower deployment of vaccines could affect the trajectory of the epidemic (Figure 9). With just 10% slower deployment (dark green line in Figure 9), peak hospital occupancy and deaths could be double those expected compared to if vaccine deployment were 10% faster (light green line in Figure 9) than in the Cabinet Office scenario shown here.
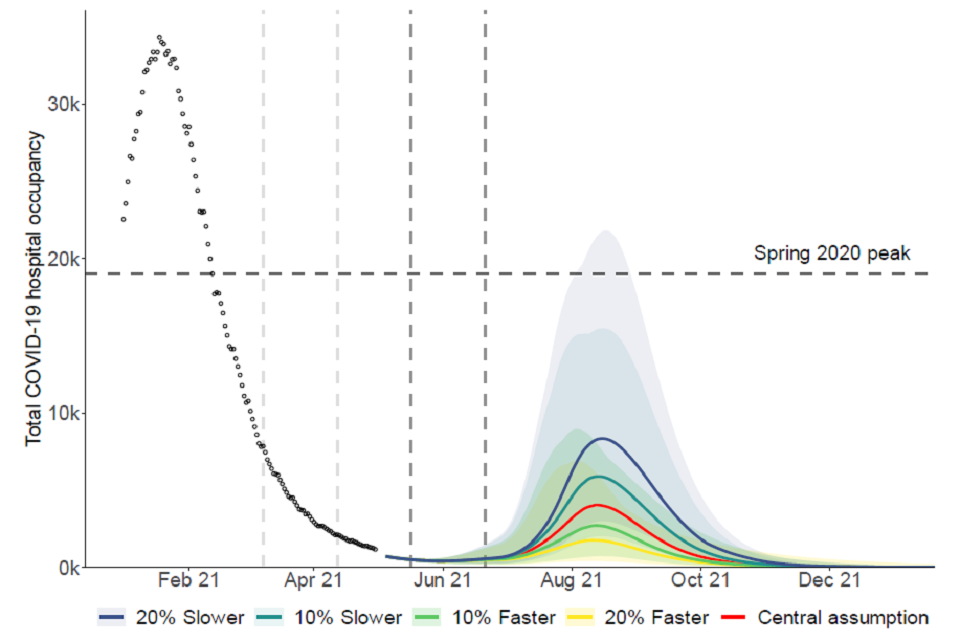
Fan chart showing that the scale of resurgence in hospital occupancy increases with slower vaccine roll out in the Warwick model. Peak median hospital occupancy is approximately double under a 10% slower rollout compared to 10% faster.
Figure 9: England hospital bed occupancy in the Warwick model assuming different vaccination roll out speeds for central assumption as per Cabinet Office scenario (red), 20% faster (yellow), 10% faster (light green), 10% slower (dark green), and 20% slower (blue). Other parameters in line with their central scenario, including 80% to 90% uptake in under 50-year olds. Shaded regions show the 95% credible intervals and lines indicate medians of the distributions.
Sensitivity to vaccine coverage in under 50-year olds
Very high vaccine uptake and coverage in those under 50 years old would keep any resurgence minimal.
45. Current observed uptake in those age groups who have been invited for vaccination is excellent. If this drops substantially, there is greater risk of much more transmission at each step and, therefore, more older people infected. This is particularly important as those younger people (under 40 years old) who are yet to be vaccinated have more contacts than those in older age groups.
46. Figure 10 show the results of the Imperial model with different assumptions for vaccine uptake in the under 50s. Compared to the central scenario (90% uptake in 30- to 49-year olds and 80% in 18- to 29-year olds), uptake of only 50% in the under 50s more than doubles peak hospital occupancy.
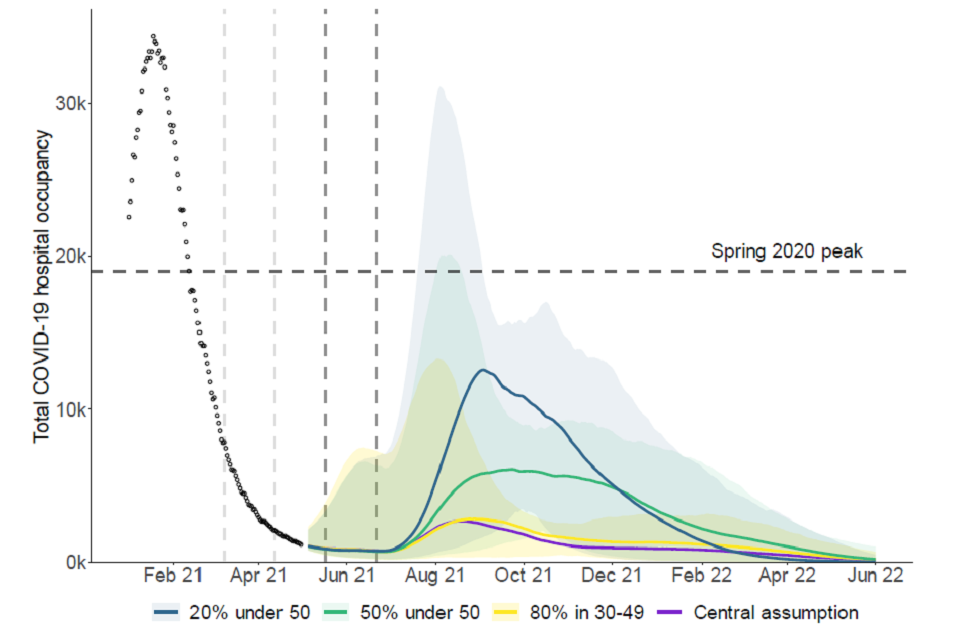
Fan chart showing the scale of resurgence in hospital occupancy increases with lower vaccine uptake in those under 50 in the Imperial model. Relative to the central scenario, uptake of 50% increases peak median occupancy from approximately 2,700 to 6,100.
Figure 10: England hospital bed occupancy in the Imperial model assuming different levels of coverage in those aged under 50; 20% coverage achieved (blue), 50% coverage achieved (green), or 80% coverage achieved in 30 to 49-year olds as well as 18- to 29-year olds (yellow). Other parameters in line with their central scenario (purple). Shaded regions show the 95% credible intervals and lines indicate medians of the distributions.
Sensitivity to seasonality
Seasonal variation in transmission could delay or flatten any resurgence but alone it is unlikely to prevent it altogether.
47. Work previously conducted by SPI-M-O groups has shown that seasonal variation in transmission could somewhat delay or flatten a peak of infections over the summer[footnote 10]. This could, however, mean infections increase more over the winter. SPI-M-O’s consensus is that the peak-to-trough seasonality in transmission is between 10% to 30% (±5% to 15% from the midline)[[footnote 11], although there is low confidence in this estimate.
48. Seasonality could give the UK the opportunity to build immunity through vaccination over the spring and summer before increases in transmission in autumn and winter, giving greater immunity when these increases happen and thus smaller disease burden and less mortality.
49. SARS-CoV-2 is a highly transmissible pathogen, irrespective of the time of year, and a resurgence in the summer is not out of the question, and this has been seen in other countries (for example, South Africa) and epidemics of other respiratory disease (for example the 2009 flu pandemic in the UK).
50. High seasonality combined with low transmission in Step 3 and high transmission in Step 4 promote a winter rather than a summer wave of infection; these first 2 suppress and delay any summer wave and high transmission in Step 4 allows for a large subsequent wave.
51. Many small changes combined could make the difference between a negligible wave and a resurgence similar to Spring 2020 or even the January 2021 peak. Monitoring the spread of infection and the rate of hospital admissions, along with an agile policy response, should it become necessary, are the only mitigations to this continuing uncertainty.
Illustrative scenarios for novel variants
Novel variants (both “under investigation” and “of concern”) of SARS-CoV-2 are a key consideration for Roadmap progress, but uncertainties are large and close monitoring is needed.
52. SPI-M-O has previously discussed the possible effect of novel variants of SARS-CoV-2 on transmission[footnote 12],[footnote 13]. The central scenarios presented here assume that the effectiveness of vaccines remains high and they do not consider the impact of new variants of concern. SPI-M-O has, however considered 2 different means by which a variant could warrant reconsidering the Roadmap.
53. A novel variant may cause concerns through either increased transmissibility, as seen with the emergence of B.1.1.7 in the UK in late 2020, or as a result of immune escape (both through evasion of infection- or vaccine-induced immunity).
54. Illustrative modelling has been conducted by the 3 academic groups. Warwick assume that the variant modelled was introduced into England at very low levels on 15 March 2021 and grows from this small seeding; Imperial assume there are currently 15 importations per day, and this increase to 150 from 17 May; and LSHTM assume 5 new variant infections each day from 1 January 2021. Further details on vaccine effectiveness against variants and their potential impact on transmissibility and immune evasion are available in the accompanying papers.
55. This modelling illustrates that a variant of concern that is as transmissible as B.1.1.7 but against which vaccines or prior infection yield less protection could easily lead to another peak of double or treble the size of that seen in January 2021 if no interventions were taken. A variant of concern with more substantial escape from immunity could be akin to an entirely new pandemic and would require the re-imposition of significant restrictions in order for NHS pressures to remain manageable. Even with rather moderate assumptions for variants of concern (some immune escape or with some immune escape but lower transmissibility), waves similar in magnitude to Spring 2020 or January 2021 are possible.
56. Novel variants remain a threat even if vaccine effectiveness is not reduced. Pathogenicity (severity) might be altered, and there is potential for variants to target unvaccinated sub-groups more aggressively in terms of transmission and pathogenicity. Variants of concern may also arise through routes other than importation and other than importation from countries on the “red list”. As prevalence increases within a vaccinated population, SARS-CoV-2 variants may also emerge within the UK itself as a result of new selection pressures.
57. These findings suggest variants remain a major risk to the progress of the Roadmap. The uncertainty surrounding the epidemiological characteristics of variants, however, means it is not possible to predict their impact before any such variant emerges. While the emergence and spread of variants with unfavourable characteristics could easily cause issues for future relaxation plans, the committee cannot say when or if any reconsideration of relaxations may be required. This would entirely depend on the characteristics of the variant of concern at the time.
58. SPI-M-O considers slowing importation of new variants into the UK a very important priority to allow for the next generation of vaccines to be developed. Measures to prevent and manage importation risks such as testing individuals, sequencing samples, and maintaining strict quarantine measures for those entering the country will remain important and may delay the spread of variants of concern. Focusing Test, Trace, and Isolate, surge testing and surge vaccination on areas with variants of concern may be beneficial.
59. Being able to observe a novel variant that is causing significant disease is the best guard against this risk, and is more effectively done if prevalence is low. Any border controls will also be most useful when prevalence is low. Allowing prevalence to rise to high levels, even with hospitalisations and deaths suppressed by vaccination, creates a greater risk that a novel variant could establish and grow initially unobserved and require significantly higher levels of intervention to control.
60. Any single cluster of infections with a variant of concern is most easily controlled whilst still small. The probability of extinction of a single cluster is a function in which the number of cases in the cluster when detected appears as a power: probability(extinction) = (1/R) a where a is the cluster size when it is found and R is the reproduction number for that variant. Finding clusters early is therefore paramount. The number of clusters to find is driven by the rate at with they arise – either de novo or through importation. If detecting and extinguishing clusters remains the aim, the effort to detect new clusters of variants of concern should rise as their rate of importation rises. If R increases as the Roadmap progresses, extinguishing each individual cluster becomes more difficult.
Waning immunity
61. The central scenarios for Warwick and Imperial modelled here assume that neither naturally acquired nor vaccine-induced immunity wane. This is likely to be an optimistic assumption as immunity to other coronaviruses is known to wane. Depending on the length of time immunity lasts, this has the potential to significantly exacerbate any resurgence beyond the analyses presented here.
62. LSHTM have included waning of both natural and vaccine-induced immunity in their central scenarios. They have modelled protection falling by around 15% in 6 months and. in the absence of evidence, assume that vaccine-induced immunity wanes in a way analogous to that of natural infection. As shown in Figure 11, if immunity remains high (dashed line), any peak in hospital occupancy could reduce by around two-thirds when compared with a situation with waning immunity (solid line).
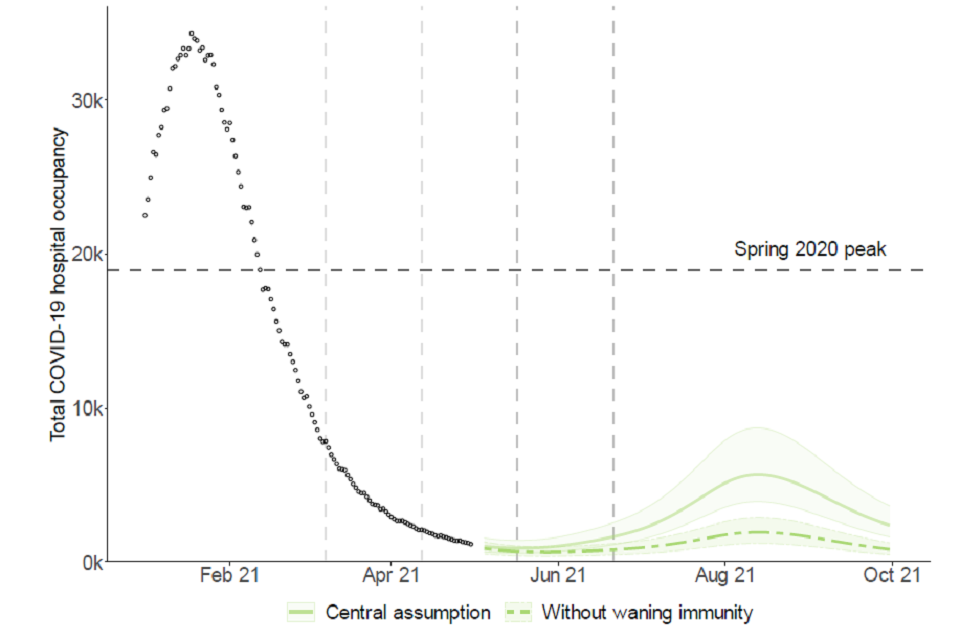
Fan chart showing that the peak median hospital occupancy in England approximately triples if waning of immunity is assumed, relative to no waning in the LSHTM model. The peak remains under the Spring 2020 and January 2021 peaks.
Figure 11: England hospital bed occupancy in the LSHTM model assuming that both natural and vaccine-induced immunity wane by 15% in 6 months (solid line), or no waning of any immunity (dashed line). Other parameters in line with their central scenario (solid line), including 80% to 90% uptake in under 50-year olds. Shaded regions show the 95% credible intervals and lines indicate medians of the distributions.
Appendix 1: Sensitivity analyses comparison
Comparison of all the uncertainties investigated (other than variants of concern) by the University of Warwick, impact on hospital admissions from 17 May to end of June 2022.
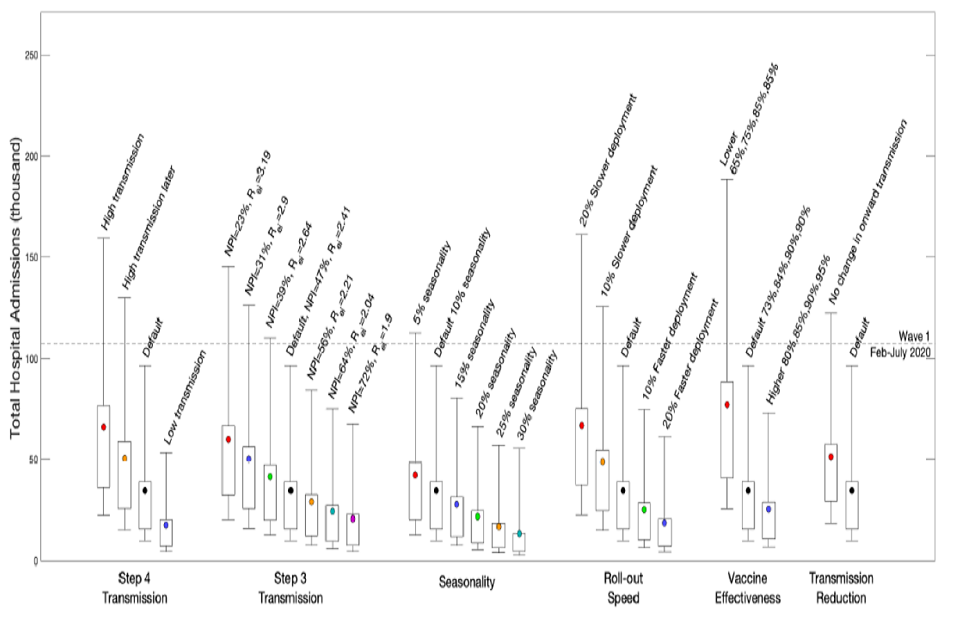
Box and whisker plots showing the impact on total COVID hospital admissions under sensitivity analyses in the Warwick model.
Comparison of all the uncertainties investigated by Imperial College London, impact on deaths from 1 May 2021 to 1 June 2022.
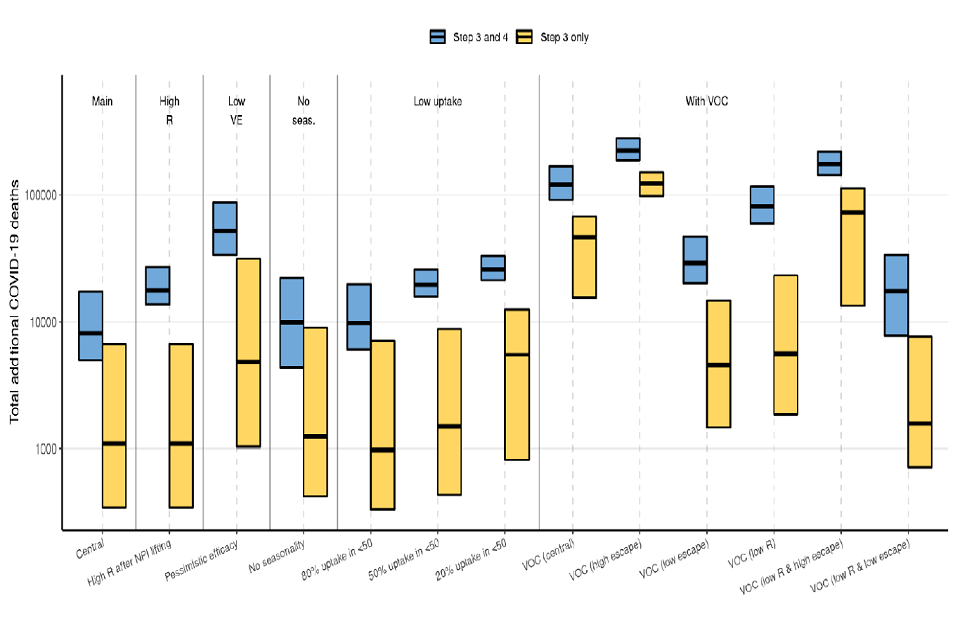
Box and whisker plots showing the impact on total COVID deaths under sensitivity analyses in the Imperial model.
Appendix 2: Model assumptions
Vaccine reduction in risk of infection
Imperial College
| Central | Pessimistic | |
|---|---|---|
| AZ 1 dose | 63% | 50% |
| AZ 2 dose | 63% | 50% |
| PF/MD 1 dose | 65% | 58% |
| PF/MD 2 dose | 86% | 76% |
LSHTM
| Central | Pessimistic | |
|---|---|---|
| AZ 1 dose | 67% | 50% |
| AZ 2 dose | 68% | 50% |
| PF/MD 1 dose | 70% | 55% |
| PF/MD 2 dose | 85% | 70% |
Warwick
| Central | Low | Higher | |
|---|---|---|---|
| AZ 1 dose | 60% | ||
| AZ 2 dose | 65% | ||
| PF/MD 1 dose | 60% | ||
| PF/MD 2 dose | 85% | ||
| Weighted average 2 dose | 73% | 65% | 80% |
Vaccine reduction in risk of onward transmission if infected
(additional to transmission reduction due to reduced infection risk)
Imperial College
| Central | Pessimistic | |
|---|---|---|
| AZ 1 dose | 45% | 0% |
| AZ 2 dose | 45% | 0% |
| PF/MD 1 dose | 45% | 0% |
| PF/MD 2 dose | 45% | 0% |
LSHTM
| Central | |
|---|---|
| AZ 1 dose | 0% |
| AZ 2 dose | 9% |
| PF/MD 1 dose | 0% |
| PF/MD 2 dose | 8% |
Reduction in infectiousness as a result of reduced risk of moderate-severe symptoms, and not applicable to asymptomatic infections.
Warwick
| Central | Low | Higher | |
|---|---|---|---|
| AZ 1 dose | 40% | ||
| AZ 2 dose | 50% | ||
| PF/MD 1 dose | 50% | ||
| PF/MD 2 dose | 50% | ||
| Weighted average 2 dose | 50% | 50% | 50% |
Vaccine reduction in risk of symptomatic disease
Imperial College
| Central | Pessimistic | |
|---|---|---|
| AZ 1 dose | 63% | 50% |
| AZ 2 dose | 63% | 50% |
| PF/MD 1 dose | 65% | 58% |
| PF/MD 2 dose | 86% | 76% |
LSHTM
| Central | Pessimistic | |
|---|---|---|
| AZ 1 dose | 67% | 60% |
| AZ 2 dose | 78% | 67% |
| PF/MD 1 dose | 70% | 55% |
| PF/MD 2 dose | 89% | 74% |
Warwick
| Central | Low | Higher | |
|---|---|---|---|
| AZ 1 dose | 60% | ||
| AZ 2 dose | 80% | ||
| PF/MD 1 dose | 60% | ||
| PF/MD 2 dose | 90% | ||
| Weighted average 2 dose | 84% | 80% | 85% |
Vaccine reduction in risk of hospitalisation admission
(or severe disease)
Imperial College
| Central | Pessimistic | |
|---|---|---|
| AZ 1 dose | 80% | 70% |
| AZ 2 dose | 80% | 70% |
| PF/MD 1 dose | 80% | 58% |
| PF/MD 2 dose | 95% | 76% |
LSHTM
| Central | Pessimistic | |
|---|---|---|
| AZ 1 dose | 84.5% | 80% |
| AZ 2 dose | 90% | 85% |
| PF/MD 1 dose | 84.5% | 80% |
| PF/MD 2 dose | 90% | 85% |
Warwick
| Central | Low | Higher | |
|---|---|---|---|
| AZ 1 dose | 80% | ||
| AZ 2 dose | 90% | ||
| PF/MD 1 dose | 80% | ||
| PF/MD 2 dose | 90% | ||
| Weighted average 2 dose | 90% | 85% | 90% |
Vaccine reduction in risk of death
Imperial College
| Central | Pessimistic | |
|---|---|---|
| AZ 1 dose | 80% | 70% |
| AZ 2 dose | 80% | 70% |
| PF/MD 1 dose | 80% | 58% |
| PF/MD 2 dose | 95% | 76% |
LSHTM
| Central | Pessimistic | |
|---|---|---|
| AZ 1 dose | 84.5% | 80% |
| AZ 2 dose | 90% | 85% |
| PF/MD 1 dose | 84.5% | 80% |
| PF/MD 2 dose | 90% | 85% |
Warwick
| Central | Low | Higher | |
|---|---|---|---|
| AZ 1 dose | 80% | ||
| AZ 2 dose | 90% | ||
| PF/MD 1 dose | 80% | ||
| PF/MD 2 dose | 90% | ||
| Weighted average 2 dose | 90% | 85% | 90% |
Rollout speed (England basis)
Per Cabinet Office scenario:
- Central: An average of 2.7m doses per week in England until week commencing 19th July and 2m per week thereafter. Sensitivities to 10% and 20% faster and slower rollout are explored by Warwick.
11-week period between doses.
Time to full vaccine protection
Imperial College
3 weeks (dose 1), 1 week (dose 2).
LSHTM
4 weeks (dose 1), 2 weeks (dose 2).
Warwick
2 weeks (dose 1), 2 weeks (dose 2).
Coverage achieved (all ages)
Imperial College
| Central | Scenarios | |
|---|---|---|
| 80 and over | 95% | 95% |
| 50-79 | 95% | 95% |
| 30-49 | 90% | 20%/50%/80% |
| 18-29 | 80% | 20%/50%/80% |
| Care home residents | 95% | 95% |
| Care home workers | 85% | 85% |
LSHTM
| Central | |
|---|---|
| 18-29 | 84.3% |
| 30-39 | 89.2% |
| 40-49 | 88.9% |
| 50-54 | 95.4% |
| 55-59 | 95.7% |
| 60-64 | 96.0% |
| 65-69 | 96.7% |
| 70 and over | 98.9% |
Warwick
| Central | |
|---|---|
| 70 and over | 95% |
| 50-69 | 95% |
| 30-49 | 90% |
| 18-29 | 80% |
R (excluding the effect of immunity) after each step of easing
Imperial College
Step 2: 1.05 (95% CI 0.86 to 1.46)
Step 3: 2.20 (95% CI 1.83 to 2.62)
Step 4:
- (central; higher impact from measures): 3.50 (95% CI 2.82 to 4.29)
- (lower impact from measures): 4.5 (95% CI 3.81 to 5.28)
R (excluding immunity) reduced by 0.3 during school holidays.
LSHTM
| Lower | Central | Higher | |
|---|---|---|---|
| Step 3 | 2.56 | 2.80 | 3.05 |
| Step 4 | 2.71 | 3.05 | 3.60 |
R (excluding immunity) reduced by 0.2 to 0.3 during school holidays in all scenarios.
Warwick
Step 1: 1.66 (95% CI 1.42 to 1.83)
Step 2: 1.88 (95% CI 1.64 to 2.10)
Step 3: 2.41 (95% CI 2.25 to 2.57)
Step 4:
- (central): 3.51 (95% CI 3.31 to 3.71)
- (higher transmission scenario): 4.11 (95% CI 3.79 to 4.39)
- (lower transmission scenario): 2.96 (95% CI 2.71 to 3.18)
Compared to a theoretical maximum of R (excluding immunity) of approximately 4.69 (95% CI 4.31 to 5.3) with pre-COVID-19 behaviours.
School holidays modelled by changing the mixing patterns for school-aged children.
Seasonality
Imperial College
20% peak (February) to trough (August) in central scenario. Other scenarios included in accompanying paper.
LSHTM
None in central scenario. 10% peak to trough considered in sensitivity analysis included in accompanying paper.
Warwick
10% (February) to trough (August) in central scenario.
Other scenarios included in accompanying paper.
Waning immunity
Imperial College
None over the timescale modelled.
LSHTM
Waning of natural and vaccine-induced immunity by 15% over 6 months. Sensitivity analysis with no waning also included.
Warwick
None over the timescale modelled.
Variants
None in the central case, but several scenarios have been modelled for sensitivity analyses. Details are given in full modelling papers.
Appendix 3: Scenarios modelled
Full details of the Roadmap for England are available [footnote 14]. The relaxations considered within the modelling described here are an approximation of those below, using the equivalent impact of previous measures during the epidemic that are closest to those described. The earliest possible date for these easings are also included.
Step 1a: 8 March
- Schools and colleges return
- Higher education on practical courses return
- Recreation and exercise outdoors with household or support bubble, or with one person from outside their household
- Care home residents allowed one regular visitor
Step 1b: 29 March
- Outdoor sport and leisure facilities
- Rule of 6 or 2 households outside
Step 2: 12 April
- Non-essential retail
- Personal care
- Public buildings.
- Indoor leisure facilities
- Outdoor attractions
- Outdoor hospitality
Step 3: 17 May
- Indoor hospitality
- Indoor entertainment
- Indoor leisure
- 30-person limit outside
- Rule of 6 or 2 households advised inside
- Return to face-to-face teaching for all higher education
- Large events (outdoor 50% capacity – limit of 4,000; indoor 50% capacity – limit of 1,000)
Step 4: 21 June
- Full unlock with long-term mitigations and guidance
-
Imperial and Warwick only; the central LSHTM scenario modelled includes waning immunity ↩
-
As published 9 April 2021 ↩
-
The estimate intervals for R and growth rate may not exactly correspond to each other due to the submission of different independent estimates and rounding in presentation. ↩
-
Scientific evidence supporting the government response to coronavirus (COVID-19) ↩
-
In each of these scenarios, R drops over time as vaccination and infection reduce the number of people who remain susceptible ↩
-
Imperial and Warwick only; the central LSHTM scenario modelled assumes a reduction in both natural and vaccine-induced immunity by 15% over 6 months. ↩ ↩2
-
SPI-M-O: Summary of modelling on scenarios for easing restrictions; SAGE 80 11 February 2021; SPI-M-O: Summary of modelling on roadmap scenarios; SAGE 81 18 February 2021; SPI-M-O: Summary of further modelling of easing restrictions – Roadmap Step 2; SAGE 85 31 March 2021; ↩
-
PHE monitoring of the effectiveness of COVID-19 vaccination ↩
-
Impact of vaccination on household transmission of SARS-CoV-2 in England; Dabrera and Dunbar et al. ↩
-
SPI-M-O: Summary of modelling on scenarios for easing restrictions; SAGE 80 11 February 2021; SPI-M-O: Summary of modelling on roadmap scenarios; SAGE 81 18 February 2021; SPI-M-O: Summary of further modelling of easing restrictions – Roadmap Step 2; SAGE 85 31 March 2021 ↩
-
Analysis from Baker et al (2020) suggest seasonality in the UK is between 6% and 14% based on the observed dynamics of coronavirus OC43, and coronavirus HKU1; although both higher and lower values are plausible depending on characteristics of SARS-CoV-2 and the weather during the 2021 summer. ↩
-
SPI-M-O: Consensus statement on COVID-19; SAGE 80, 11 February 2021 ↩
-
SPI-M-O: Summary of further modelling of easing restrictions – Roadmap Step 2; SAGE 85 31 March 2021 ↩
-
Further details can also be found at COVID-19 Response – Spring 2021 (Summary) ↩