Similar schools model for attainment: technical note
Updated 16 July 2026
Applies to England

© Crown copyright 2026
This publication is licensed under the terms of the Open Government Licence v3.0 except where otherwise stated. To view this licence, visit nationalarchives.gov.uk/doc/open-government-licence/version/3 or write to the Information Policy Team, The National Archives, Kew, London TW9 4DU, or email: psi@nationalarchives.gov.uk.
Where we have identified any third party copyright information you will need to obtain permission from the copyright holders concerned.
This publication is available at https://www.gov.uk/government/publications/similar-schools-model-for-attainment/similar-schools-model-for-attainment-technical-note
This document explains how the Department for Education (DfE) and Ofsted will identify groups of similar schools to support the interpretation of pupil attainment data with similar contexts, when this data is released in the autumn term.
These comparisons are designed to:
- provide contextual understanding of school performance (that is, informing considerations of how pupil characteristics, over which the school has less influence, relate to their performance) – a key interest for Ofsted, which plans to introduce similar schools data into the inspection data summary report (IDSR) from September 2026
- help schools benchmark their performance against schools with similar intakes through a new DfE digital platform, which will be rolled out in the autumn term
As a school-facing product, the platform will not be publicly accessible. It will help schools understand their strengths, identify areas for improvement and then connect with other schools, enabling a self-improving system. It will also signpost them to the resources available to support improvement.
Similar schools are identified using statistical modelling based on pupil characteristics and school context. These comparisons do not replace existing measures, but provide an additional layer of insight. Although this approach will not explain every factor that can affect performance, it aims to provide a shared awareness of how key factors can influence attainment. The information can inform inspections and, through benchmarking, support a self-improving system.
What similar schools are
A school is compared to a group of around 50 statistical ‘nearest neighbours’ – that is, schools with similar characteristics, including:
- prior attainment of pupils
- levels of disadvantage
- cohort size and stability
- proportion of pupils with:
- special educational needs or disability (SEND)
- English as an additional language (EAL)
These factors are chosen because they are strongly associated with attainment outcomes.
Why the similar schools model is useful
Comparing attainment to the national average shows where a school sits in the overall distribution for England, but does not account for context. Comparisons with similar schools allow users to:
- understand whether performance is above or below what might be typical, given a school’s intake
- identify schools facing similar challenges but achieving stronger outcomes
- provide relevant context for interpretation during inspection and self-evaluation
Rationale
Pupil attainment at school level is often compared with the national average. This can be useful to help understand where a school sits in the overall distribution of schools, but may be less useful in identifying areas where it can improve or where it is outperforming, given the likely starting points of its pupils. There may be many reasons why your school’s attainment differs from the national average, and not all of those are under your control.
Comparing your school’s attainment with similar schools will allow you to:
- understand whether your school’s attainment is generally higher or lower than other schools like yours
- identify cases where your similar schools have higher attainment than your school, and, through contact with them, where you might be able to make improvements
- identify areas where your school’s attainment is generally higher than your similar schools, and where your efforts to improve attainment have been successful
To ensure the matches in the model are as appropriate to attainment as possible, we have developed a model specifically for that purpose. This acknowledges that drivers of attainment are often not the same as drivers of other important issues for schools, such as attendance and financial health.
The similar schools model for attainment
As is common in approaches to identifying similar schools, the DfE and Ofsted attainment model is based on the statistical technique of regression analysis. This involves assessing data on a range of factors (or ‘independent variables’) for their ability to predict the outcome of interest (or the ‘dependent variable’) – in this case, pupil attainment as measured by average score in key stage 2 (KS2) reading and maths, and key stage 4 (KS4) Attainment 8 score. We then look for the combined shortest Euclidian distances[footnote 1] between the variables in the model to determine the most similar schools.
The pupil characteristic variables in the models are based on data for all the pupils[footnote 2] in primary and secondary schools for the calculation year (2025 for the initial model) rather than just those in the year group taking KS2 or KS4 tests. This is because:
- the groups of similar schools are more stable over time than if only the characteristics of exam cohorts are considered
- it ensures the model more genuinely reflects the similarity of schools, rather than a single year of pupils
- for 2025 and 2026 results, it allows a school-level measure of prior attainment to be included, even though KS2 prior attainment is unavailable for KS4 exam cohorts due to the COVID-19 data gap, and this is the single most influential predictive variable – when the necessary data is available, KS2 and KS4 progress measures focus exclusively on exam cohorts and fulfil a distinct and different purpose
Variables considered for the models
A wide range of variables was considered to produce a model that explains as much of the variation in attainment between schools as possible.
Using a statistical technique called dominance analysis (which is used to determine the relative importance of predictive factors in a statistical model – more technical detail is available), the set of predictors was reduced to a manageable number, with consideration of:
- the predictive power of variables, and whether they added distinct explanatory power over and above other variables[footnote 3]
- the exclusion of variables that will affect outcomes over which schools have some control (for example, an attendance and behaviour policy)
- reference to protected characteristics (meaning ethnic background was excluded, which added only modestly to the explanatory power of the model)
- future data availability
- whether the data are publicly available and regularly updatable
The full list of variables considered for inclusion in the models are included in Annex A.
It is not possible to account for all the variation in school attainment outcomes with contextual factors. Some of the data items with explanatory power may not affect attainment outcomes in their own right but, instead, are linked to other factors that do explain some of the variation.
We recognise that some factors may be more important to individual schools’ results than others, but our chosen method accounts for the variation in aggregate. We will keep the selection of variables under review in subsequent years to ensure we continue to have the most appropriate model for explaining differences in outcomes.
The final variable set
The final variables included in the models are:
-
prior attainment – the most influential in explaining variations in attainment between schools:
- the KS4 model includes a combined reading and maths score of pupils at KS2, which is the strongest predictor, but was only available for pupils in years 7 to 9 for this initial use of the model
- the KS2 model includes key stage 1 (KS1) test scores for pupils in years 4 and 5[footnote 4], the other years not having data due to the COVID-19 pandemic
-
disadvantage – the next most important set of predictors of attainment, with 3 measures of disadvantage included in the model:
- free school meals Ever 6 (FSM6) eligibility, which is eligibility for FSM at any time in the past 6 years
- the income deprivation affecting children index (IDACI), which is the average proportion of all children aged 0 to 15 living in income-deprived families in the areas in which pupils of the school reside
- the participation of local areas (fourth version) (POLAR4), which classifies local areas (middle layer super output areas, or MSOAs) into 5 quintiles based on the proportion of 18-year-olds who enter higher education, reflecting differences in educational opportunity and aspiration
-
pupil cohort information:
- pupil numbers, to recognise the different challenges faced by small and large schools
- stability (that is, the percentage of pupils who were admitted to the school at the standard time of admission), to recognise the challenge involved when schools have high volumes of in-year admissions and reflect how much of a cohort has followed their full curriculum journey at the school
-
inclusion, and the proportion of pupils with:
- SEND support and an education, health and care (EHC) plan
- EAL
These last 2 are included because they present, or have the potential to present, additional challenges to attainment.
Final input variable weightings
The following tables show the percentage of the variation in the outcome explained by each variable in the model and, subsequently, how much we relatively weight each factor when we calculate how similar one school is from another.
They add up to 1 (that is 100%), but there will be a variation in outcomes that we cannot explain using these variables or other data, as it will be a result of things that either cannot be measured or about which data is not collected.
Table 1: Input variables and weightings for KS2 similar schools model
| Variable | Weight |
|---|---|
| Combined average outcomes for KS1 reading, writing and maths | 0.38 |
| Total number of pupils | 0.02 |
| % pupil stability | 0.06 |
| % of pupils eligible for FSM6 | 0.13 |
| Pupil-based IDACI | 0.07 |
| Pupil-based POLAR4 | 0.17 |
| % of pupils with an EHC plan | 0.04 |
| % of pupils with SEND support | 0.09 |
| % of pupils with EAL | 0.04 |
Table 2: Input variables and weightings for KS4 similar schools model
| Variable | Weight |
|---|---|
| Combined average KS2 reading and maths scaled score | 0.46 |
| Total number of pupils | 0.02 |
| % pupil stability | 0.06 |
| % of pupils eligible for FSM6 | 0.14 |
| Pupil-based IDACI | 0.06 |
| Pupil-based POLAR4 | 0.11 |
| % of pupils with an EHC plan | 0.04 |
| % of pupils with SEND support | 0.09 |
| % of pupils with EAL | 0.03 |
Model fit and outputs
The models are designed to identify schools that are similar in their characteristics and context, rather than to identify schools with similar attainment outcomes. The quality of the matches is therefore assessed by how closely schools resemble one another on the factors included in the model.
The KS4 model explains around four-fifths of the variation in attainment outcomes between secondary schools, while the KS2 model explains around one third of the variation between primary schools. Differences of this kind are common in educational modelling and reflect the fact that outcomes at different key stages are influenced by different combinations of factors.
A lower level of predictive power does not mean the KS2 model is less useful or that its results are unreliable. It means that, while groups of similar primary schools will share many of the same characteristics, there may be greater variation in attainment outcomes within those groups than is typically seen for matched secondary schools at KS4.
To support appropriate interpretation, the outputs will include information on the strength of each school’s matches. This will allow users to understand how closely a school resembles the schools with which it has been matched and to take this into account when comparing outcomes.
Following the regression analysis, groups of similar schools are created by applying a weighted Euclidean distance calculation to identify each school’s nearest neighbours based on these variables.
The models produce a list of 50 similar schools for mainstream primary and secondary schools[footnote 5] (that is, excluding special schools, alternative provision (AP) and pupil referral units (PRUs)).
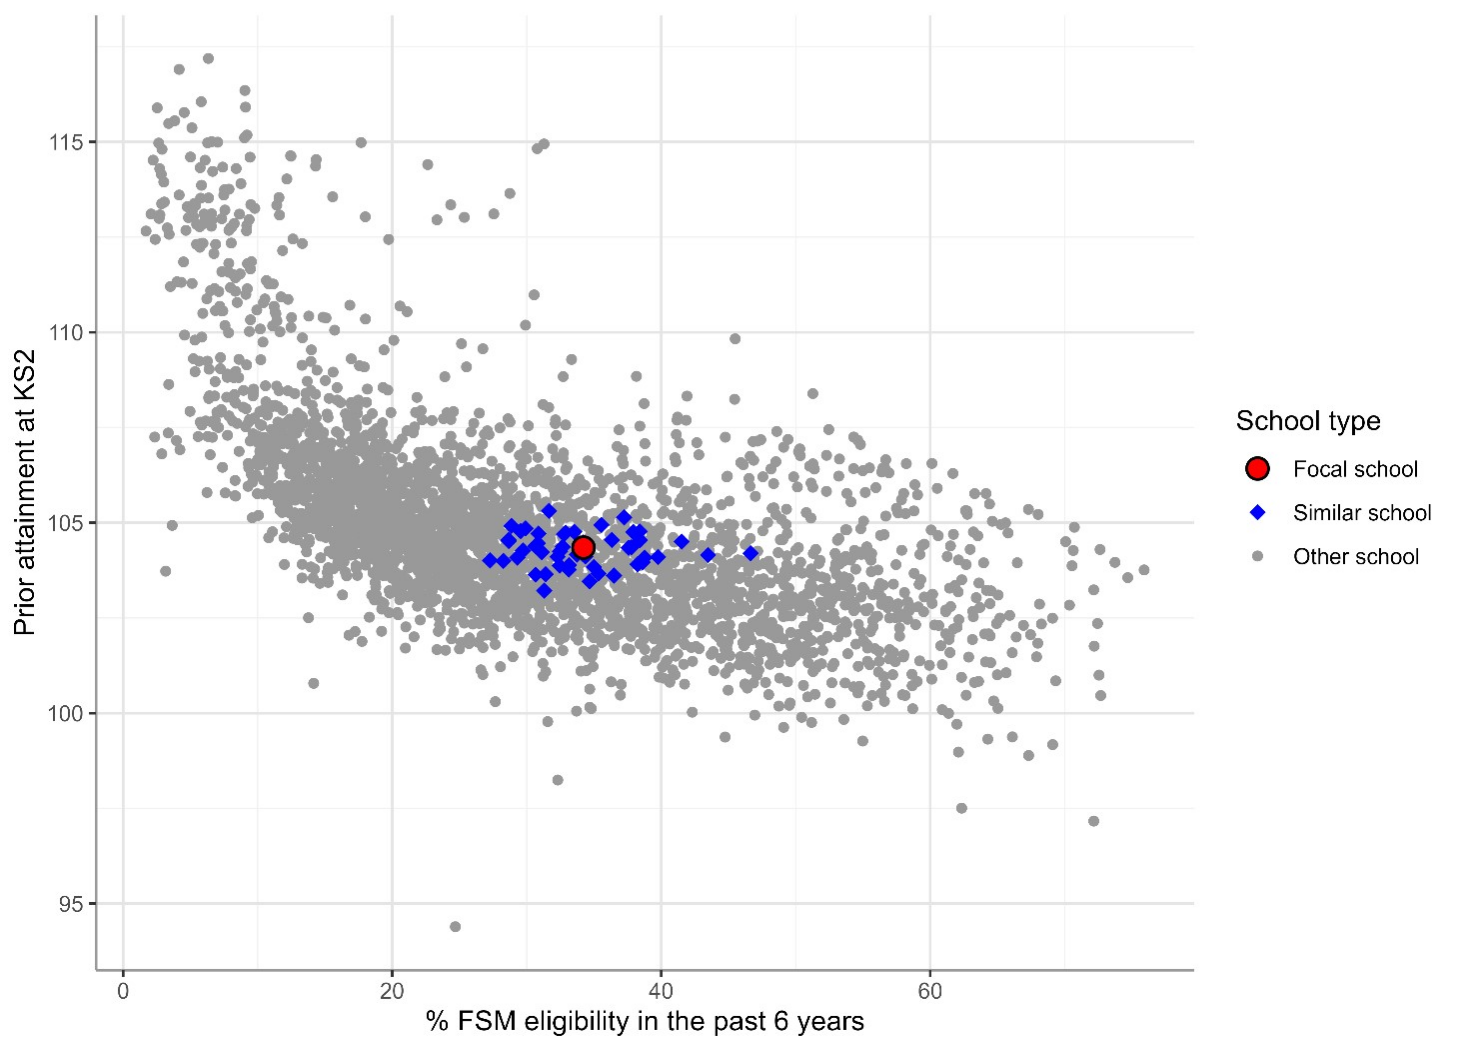
The distance metric allows us to assess how ‘similar’ a school’s group appears on the chosen variables. A visualisation of this for just 2 of the variables is shown in figure 1.
Figure 1: A visualisation of Euclidean distances for an example similar schools group: a 2-D comparison of KS2 performance vs % FSM6 eligibility
In this plot, a single red dot represents a focal secondary school and a cluster of blue diamonds represents schools in its similar schools group. A larger cluster of overlapping grey dots represents all other secondary schools. The plot shows only 2 of the 9 variables used to calculate distance, which, in this case, are prior attainment at KS2, and percentage FSM6 eligibility.
A worked example
Suppose we have 3 KS4 schools with the following characteristics:
Table 3: Example school data
| Variable | School A | School B | School C | National average (standard deviation) |
|---|---|---|---|---|
| Combined average KS2 reading and maths scaled score | 104 | 104 | 108 | 105 (2.55) |
| Total number of pupils | 836 | 1236 | 1590 | 1092 (392) |
| % pupil stability | 87.5 | 90.4 | 85.5 | 89.5 (6.86) |
| % of pupils eligible for FSM6 | 59.4 | 54.8 | 32.1 | 29.7 (14.6) |
| Pupil-based IDACI | 0.284 | 0.272 | 0.165 | 0.176 (0.0778) |
| Pupil-based POLAR4 | 3.83 | 3.66 | 4.78 | 2.96 (1.00) |
| % of pupils with an EHC plan | 5.02 | 4.85 | 2.33 | 3.24 (1.97) |
| % of pupils with SEND support | 12.7 | 12.0 | 16.2 | 14.0 (5.69) |
| % of pupils with EAL | 33.7 | 42.1 | 26.1 | 18.9 (18.1) |
The variables are first standardised by subtracting the national averages and dividing by the standard deviations. This means that the average value of every standardised variable is 0, and the standard deviation is 1, and, as such, all variables are on comparable scales, as in Table 4.
Table 4: Example school data after standardisation
| Variable | School A | School B | School C |
|---|---|---|---|
| Combined average KS2 reading and maths scaled score | -0.188 | -0.256 | 1.07 |
| Total number of pupils | -0.654 | 0.367 | 1.27 |
| % pupil stability | -0.300 | 0.122 | -0.589 |
| % of pupils eligible for FSM6 | 2.03 | 1.72 | 0.166 |
| Pupil-based IDACI | 1.39 | 1.22 | -0.143 |
| Pupil-based POLAR4 | 0.866 | 0.697 | 1.82 |
| % of pupils with an EHC plan | 0.905 | 0.819 | -0.465 |
| % of pupils with SEND support | -0.239 | -0.363 | 0.373 |
| % of pupils with EAL | 0.820 | 1.28 | 0.399 |
The squared weighted Euclidean distance between school A and school B is:
0.46 × (-0.188 – -0.256)² +
0.02 × (-0.654 – 0.367)² +
0.06 × (-0.300 – 0.122)² +
0.14 × (2.03 – 1.72)² +
0.06 × (1.39 – 1.22)² +
0.11 × (0.866 – 0.697)² +
0.04 × (0.905 – 0.819)² +
0.09 × (-0.239 – -0.363)² +
0.03 × (0.820 – 1.28)² +
= 0.06
And the final distance is the square root of this number, which is 0.245.
We can calculate the distances between each pair of schools in the same way, as in Table 5.
Table 5: Distances between pairs of schools
| Distance between schools | School A | School B | School C |
|---|---|---|---|
| School A | 0 | 0.245 | 1.28 |
| School B | 0.245 | 0 | 1.26 |
| School C | 1.28 | 1.26 | 0 |
A school’s nearest neighbours are those schools, apart from itself, which have the smallest weighted Euclidean distance to that school. So, for this example, school B is more similar to school A than school C.
The distance from school A to school B is the same as the distance from school B to school A. However, it does not necessarily follow that if B is the nearest school to A, then A is the nearest school to B.
Similarly, if B is one of A’s 50 similar schools, it does not follow that A is necessarily one of B’s 50 similar schools. The average Euclidean distance between 2 KS4 schools in the 2025 dataset is 1.26, so schools A and B are more similar than average. In addition to identifying similar schools, we will provide users with information on the strength of their match to each similar school.
Trends within groups of similar schools
Schools with high levels of FSM and special educational needs are likely to compare more favourably, in terms of attainment, with their similar schools than with national averages. This is because these factors tend to be correlated with lower performance, so those schools are more commonly below the national average.
By comparing them to schools with more similar percentages of pupils with these characteristics, the schools in question are more likely to appear closer to, or above, the average of their group than they are to the national average.
We have not applied particular restrictions on any admission criteria such as academic selection or faith, but our testing of the model showed that academically selective (grammar) schools’ groups will contain almost entirely other selective schools[footnote 6].
Likewise, the vast majority of non-selective schools’ groups will contain no selective schools[footnote 7], although a small number could contain some, if their intake has very high prior attainment. Prior attainment is the heaviest-weighted variable in the model and, as such, significantly accounts for the effects of academic selection when determining similar schools.
Annex A – Initial set of variables considered for inclusion
| Variable | Descriptor |
|---|---|
| Type of establishment code | Basic description of establishment type |
| Phase of education code | Basic description of education phase |
| Nursery provision name | Whether the school has nursery classes or not |
| Official sixth form code | Whether the school has a sixth form or not |
| Gender code | Whether the school is a single-sex boys’, girls’ or mixed school |
| % girls | Percentage of girls enrolled at the school |
| Religious character code | The religious character of the school |
| Admissions policy code | Whether the school is academically selective or not |
| Special classes code | Whether the school has special classes or not |
| Urban rural code | Indicator of the degree of rurality of the provider’s location, from urban major conurbation to rural hamlet |
| Rural | Indicator of whether the school is in a rural setting, based on the value of the urban rural code |
| IMD decile school | Index of multiple deprivation (IMD) decile associated with the school’s postcode |
| IDACI decile school | IDACI decile associated with the school’s postcode |
| IDACI score school | IDACI score associated with the school’s postcode |
| POLAR4 school | POLAR4 quintile associated with the school’s postcode |
| Total number of pupils | Number of pupils enrolled at the school |
| KS1 reading | The average KS1 reading outcome of pupils in the whole school for pupils who sat their KS1 in the 2015 to 2016 academic year or later, where pupil-level outcomes have been converted to ordinal variables from 1 (working below the standard of the test) to 4 (working at greater depth or higher than the expected standard) |
| KS1 writing | The average KS1 writing outcome of pupils in the whole school for pupils who sat their KS1 in the 2015 to 2016 academic year or later, where pupil-level outcomes have been converted to ordinal variables from 1 (working below the standard of the test) to 4 (working at greater depth or higher than the expected standard) |
| KS1 maths | The average KS1 maths outcome of pupils in the whole school for pupils who sat their KS1 in the 2015 to 2016 academic year or later, where pupil-level outcomes have been converted to ordinal variables from 1 (working below the standard of the test) to 4 (working at greater depth or higher than the expected standard) |
| KS2 reading | Percentage of the cohort with a KS2 reading outcome who met the expected standard in KS2 reading |
| KS2 writing | Percentage of the cohort with a KS2 writing outcome who met the expected standard in KS2 writing |
| KS2 maths | Percentage of the cohort with a KS2 maths outcome who met the expected standard in KS2 maths |
| KS2 reading scaled score | Average KS2 reading score of the cohort with a KS2 reading outcome |
| KS2 maths scaled score | Average KS2 maths score of the cohort with a KS2 maths outcome |
| Combined average KS2 reading and maths scaled score | The mean of 2 prior attainment measures: average KS2 reading score of the cohort with a KS2 reading outcome and average KS2 maths score of the cohort with a KS2 maths outcome |
| % FSM eligibility | Percentage of pupils currently eligible for FSM |
| % FSM6 eligibility | Percentage of pupils eligible for free schools meals at any time in the past 6 years |
| % disadvantage | Percentage of pupils eligible for FSM6 or who are looked-after children |
| % pupil premium eligibility | Percentage of pupils eligible for pupil premium funding (this is the deprivation premium, which provides funding for pupils who have had a recorded period of FSM6) |
| Pupil-based IDACI | Average IDACI score of the cohort, based on pupil postcodes (this provides a scaled measure of income deprivation at neighbourhood level) |
| IMD decile pupils | Average IMD decile of the cohort, as associated with pupil postcodes |
| IMD rank pupils | Average IMD rank of the cohort, as associated with pupil postcodes |
| Pupil-based POLAR4 | Average POLAR4 quintile of the school’s cohort, as associated with pupil postcodes (this provides a scaled measure of progression to higher education at the neighbourhood level) |
| % EAL | Percentage of the cohort whose first language is not English |
| % unclassified | Percentage of the cohort with first language unclassified |
| % SEND school support | Percentage of the cohort with SEND support |
| % EHC plan | Percentage of the cohort with an EHC plan |
| % overall absence | Percentage of overall pupil absence |
| % persistent absence | Percentage of the cohort who are persistent absentees |
| % permanent exclusion | Percentage of the cohort who have been permanently excluded |
| % fixed-term exclusion | Percentage of the cohort who have had at least one fixed-term exclusion |
| % pupil stability | Measure of how stable the pupil population attending a school is (high stability means not much movement of pupils into or out of the school) |
| Proportion moved | Proportion of the cohort in secondary schools who came off the roll between one school census year and the next |
| % ethnicity indicators | Percentage of pupils in each ethnicity category: Asian Bangladeshi, Asian Indian, Asian Pakistani, Other Asian, Chinese, Black African, Black Caribbean, Other Black, Mixed – white and Asian, Mixed – white and Black African, Mixed – white and Black Caribbean, Other Mixed origin, White British, White Irish, White traveller or Irish heritage, Gypsy or Romany, Other white, Other, Ethnicity information refused, Ethnicity information not yet obtained |
| % minority ethnic | Percentage of the cohort who belong to an ethnic minority group |
| % assistant teacher | Ratio of teaching assistants to teachers (a high number means a high volume of teaching assistants compared with teachers) |
| Teacher vacancy rate | Number of vacant teacher posts |
| Average days of sickness | Average number of days lost to teacher sickness absence |
| % sickness | Percentage of teachers with at least one period of sickness absence |
| Teacher turnover | School-level teacher turnover |
| Allocation per pupil | Funding allocation per pupil |
-
Essentially, the length of a straight line between 2 points. ↩
-
In the case of all-through schools, secondaries with sixth forms, and middle schools, pupils in all years present in the school will be included. ↩
-
Using ‘stepwise’ inclusion and rejection criteria. ↩
-
There has also been a move from KS1 tests to reception baseline assessment, and future inclusion of prior attainment in the KS2 model will be considered further. ↩
-
There is no ‘correct’ number of similar schools to meet the objectives of contextualising and benchmarking, and 50 represents a trade-off between smaller groups (which would likely have less variability, might change more over time and which might risk a lot of benchmarking against a small number of schools) and larger groups (likely to be more stable but less ‘similar’). ↩
-
Analysis suggests 94% of schools in selective schools’ groups are other selective schools. ↩
-
Analysis suggests over 98% of non-selective schools will have no selective schools within their groups. ↩