Sellafield Ltd Annual Review of Environmental Performance 2022/23
Published 7 November 2023

© Crown copyright 2023
This publication is licensed under the terms of the Open Government Licence v3.0 except where otherwise stated. To view this licence, visit nationalarchives.gov.uk/doc/open-government-licence/version/3 or write to the Information Policy Team, The National Archives, Kew, London TW9 4DU, or email: psi@nationalarchives.gov.uk.
Where we have identified any third party copyright information you will need to obtain permission from the copyright holders concerned.
This publication is available at https://www.gov.uk/government/publications/sellafield-ltd-annual-review-of-environmental-performance-202223/sellafield-ltd-annual-review-of-environmental-performance-202223
1. Introduction
Following publication of the 50th edition of Sellafield Ltd Discharges and Environmental Monitoring Report last year, we have revised the format of this report.
This new format publication outlines the variety of ways in which Sellafield Ltd. monitor our impacts on the environment, providing more balanced information across a range of impact types.
2. Carbon footprint 2022/23
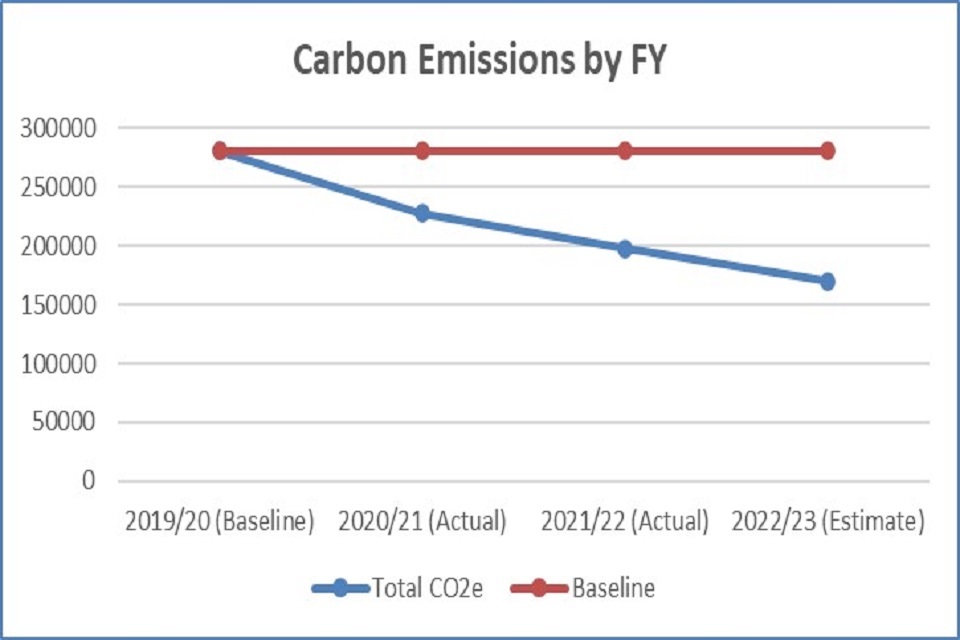
The Sellafield Ltd corporate carbon footprint for 2022/23 is in the region of 230,000 tonnes of CO2e. This includes approximately 172,000 tonnes of CO2e associated with electricity, steam, fuel consumption and process emissions (scope 1 and 2 emissions).
The remaining emissions are associated with a small proportion of our scope 3 emissions.
In common with other businesses, our reporting of scope 3 emissions is under development to increase the quality of data reported within the annual corporate carbon footprint to support our understanding of progress against our long-term carbon reduction targets.
Previously business travel and commuting have been reported annually; for this financial year well to tank, transmission and distribution and homeworking are also included.
Whilst we are still developing the quality of data in the remaining scope 3 categories, we have previously estimated the totality of our scope 3 emissions to be approximately 600,000 tonnes of CO2e.
It is anticipated that external verification of the corporate carbon footprint for 2022/23 will be completed in the summer of 2023/24.
3. Non-radiological impacts of discharges and monitoring of non-radiological pollutants in the environment 2022 (Calendar year)
The Installations Environmental Permit includes a requirement for a non-radiological monitoring programme.
Compared to the radiological environmental monitoring programme, its scope is limited and comprises local air sampling on the Sellafield site, water sampling from the rivers Calder and Ehen and seawater sampling from local beaches.
A more comprehensive summary of non-radioactive releases to air, controlled waters, land and off-site transfers of waste is given in the pollution inventory supplied to the Environment Agency each year and is available from their website.
Measurements of Nitrogen Dioxide concentrations in air (using passive diffusion tubes) are made at 5 locations on the Sellafield site. Air sampling results show very low concentrations well within the UK Air Quality Standard [1].
Water samples are obtained from the rivers Calder and Ehen at locations both upstream and downstream of the Sellafield site. The downstream samples are taken above the confluence of the 2 rivers, and at times which minimise contamination with seawater.
Seawater samples are obtained from the shoreline areas and confirm that the liquid discharges from Sellafield are not causing the Environmental Quality Standards and Environmental Assessment Levels [2] to be exceeded and therefore are of negligible impact.
Sellafield Ltd is committed to minimising the use of ozone depleting substances and fluorinated greenhouse gases and transitioning to more environmentally friendly alternatives where appropriate.
Routine releases are estimated from the amounts of refrigerants used to top-up systems on site. Releases from Sellafield Ltd between 2018 and 2022 of ozone depleting substances and fluorinated greenhouse gases are summarised in appendix A.
4. Monitoring of Sellafield’s landfill sites 2022 (Calendar year)
The waste management licences for the north landfill site and Calder floodplain landfill extensions require that environmental monitoring be carried out in the vicinity of the 2 sites.
The monitoring comprises water sampling from the River Calder and New Mill Beck upstream and downstream of the landfills and gas monitoring over their surfaces.
The results confirm that the impact of Sellafield’s landfill sites remains negligible.
5. Radiological dose impacts 2022 (Calendar year)
This report provides a summary of the comprehensive data that are available for inspection by members of the public on the public registers maintained by the Environment Agency.
There were no instances in 2022 of non-compliance with the numerical limits of permits regulating discharges and disposals of radioactive wastes at Sellafield.
Radioactive discharges (aerial and liquid) were well below the permitted limits and were generally lower than those in 2021.
The estimated radiological doses to members of the public in 2022 are summarised in the table below.
Doses to adult members of the marine critical group were estimated as 72 µSv, which is slightly higher than the dose estimated for 2021 (60 µSv) but in line with that in 2020 (70 µSv).
The most significant radionuclides contributing to this dose are plutonium-alpha and americium-241, with the environmental concentrations of these radionuclides being mostly due to historic discharges and therefore changes in dose year on year reflect natural environmental variations.
| Critical group doses from operations at Sellafield (µSv) | ||
|---|---|---|
| Pathway | 2021 | 2022 |
| Marine critical group (adults) | ||
| seafood consumption | 24 | 28 |
| aerial pathways | 1.5 | 1.6 |
| external radiation from beach occupancy (marine) | 35 | 42 |
| Total dose to marine critical group (adults) | 60 | 72 |
| Terrestrial critical group (adults) | ||
| inhalation | 0.52 | 0.6 |
| immersion | 0.03 | 0.005 |
| external radiation from beach occupancy (terrestrial) | 2.9 | 2.9 |
| terrestrial foodstuff consumption | 4.7 | 4.6 |
| marine foodstuff consumption | 0.58 | 0.55 |
| direct radiation | 2.9 | 3.0 |
| Total dose to terrestrial critical group (adults) | 12 | 12 |
The estimated dose in 2022 due to the consumption of terrestrial foodstuffs was about 5 µSv. Inclusion of dose contributions to this group from inhalation, immersion, external radiation from beach occupancy and marine.
The total dose to the terrestrial critical group (adults) was estimated as 12 µSv which is unchanged from the dose reported for 2021.
The range of doses estimated herein are comparable to those from regulators’ programme and consistent conclusions are made that doses are well below the legal limit of 1000 µSv [3].
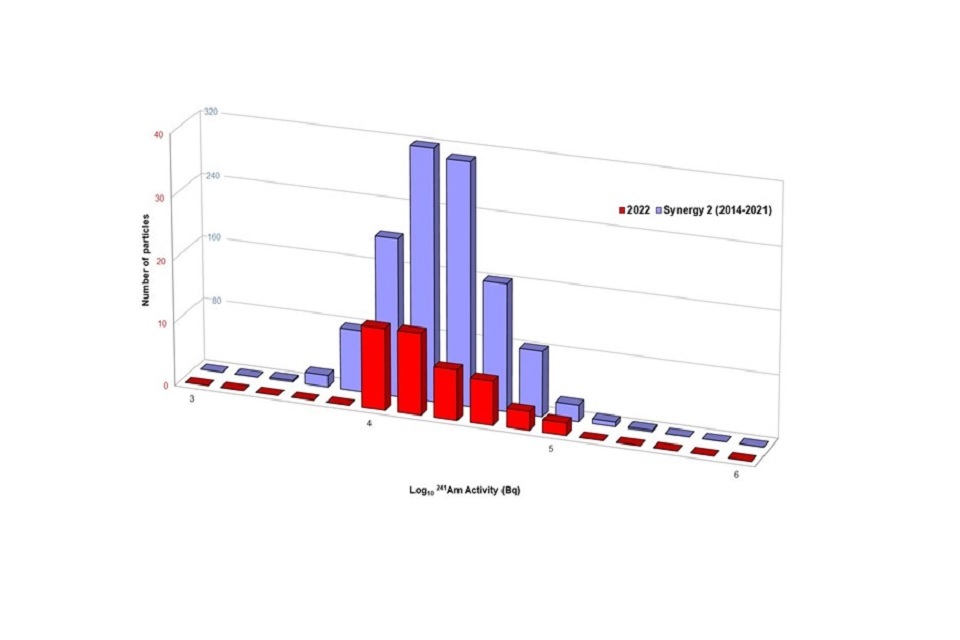
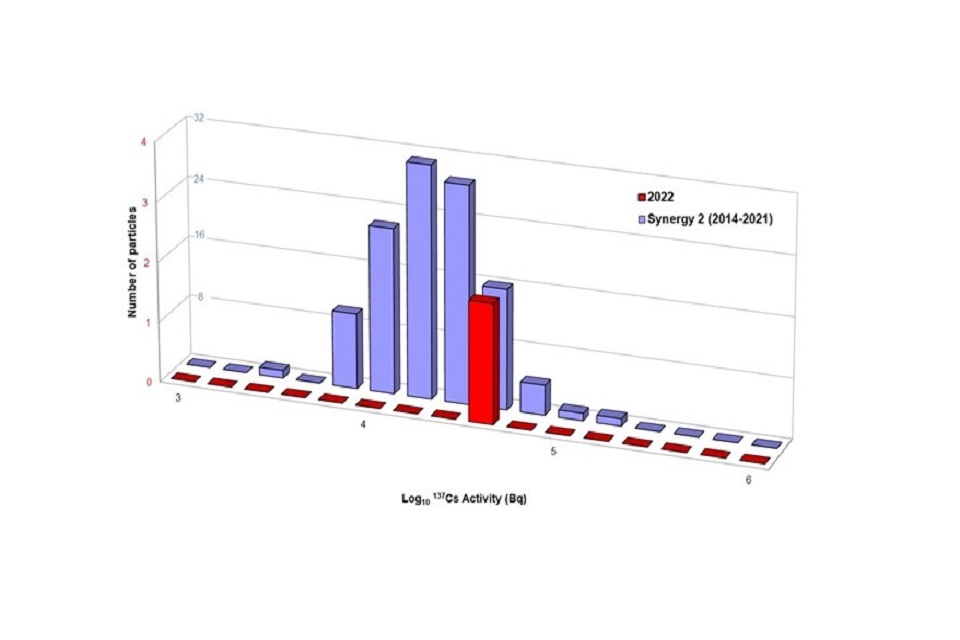
The distributions of caesium-137 and americium-241 activities for particles and larger objects recovered by the beach monitoring programme in 2022 were within the ranges previously observed and considered in the health risk assessment associated with public beach occupancy.
Independent environmental monitoring programmes and dose assessments are carried out and reported by government agencies and other groups [4 – 7].
Sellafield Ltd has contributed to a number of initiatives that developed criteria for the protection of the natural environment and carried out assessments of exposure against the guidelines given in national and international publications.
On the basis of work to date there is no reason to believe that radioactive discharges from Sellafield Ltd are harming the natural environment and the dose assessments presented herein focus on the protection of human health.
The following visual is included as it is illustrative of the comparable dose impacts of Sellafield discharges versus various other sources of radiation exposure by the general public in the UK.
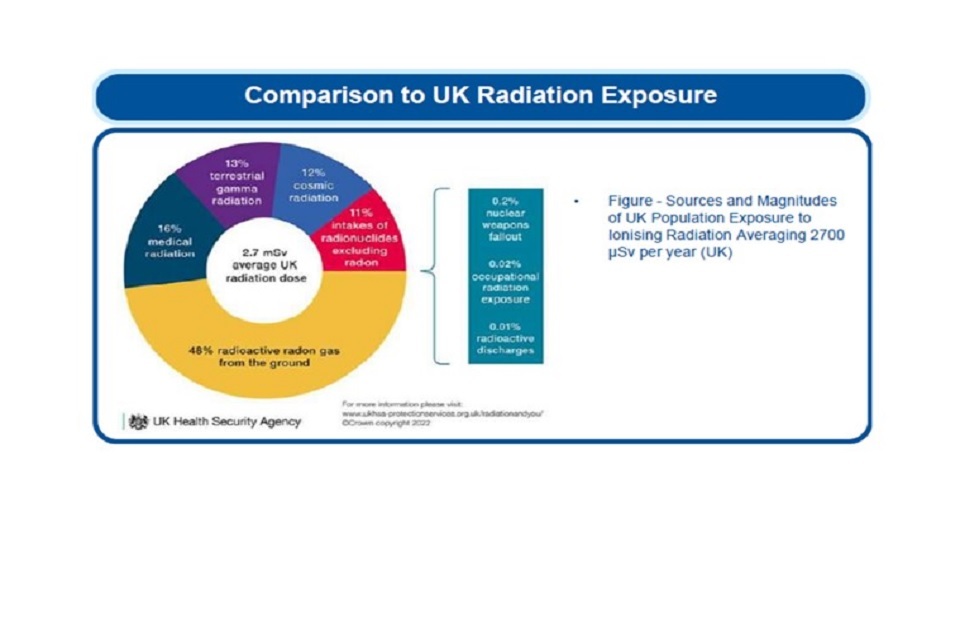
The measurements in this report relate to environmental radioactivity that is mainly attributable to discharges from the Sellafield site.
However, natural radioactivity makes an appreciable contribution to the reported values in some instances and it is important to recognise that natural radioactivity is the dominant source of radiation exposure to the population as a whole, including individuals living close to nuclear establishments.
In addition, the widespread radioactive fallout from the testing of nuclear weapons and from the Chernobyl accident make small contributions to overall doses.
The subject has been reviewed comprehensively by the UK Health Security Agency [8,9] and others [10].
Where corrections to account for background radiation are made they have been noted.
Summary
The impacts of radioactivity in the environment local to the Sellafield site remain low, as per recent years, with only a small portion of this already low impact attributable to present operations on the site.
In contrast to earlier points in the site’s history, the primary value of this extensive programme of environmental monitoring (in particular with respect to radioactivity in the environment) has moved on from measuring the impacts of the site’s ongoing activities to:
- providing reassurance to both the public and other stakeholders
- demonstrating compliance with both international obligations and our (Environmental Permitting Regulations) permits - which directly place requirements on our environmental monitoring programme
- providing reassurance monitoring to Sellafield Ltd ourselves, by allowing the detection of any abnormal or fugitive releases to the environment.
6. Monitoring for radioactivity in the environment 2022 (Calendar year)
Statutory environmental monitoring programme
The Statutory Environmental Monitoring Programme (SEMP) provides public and stakeholder assurance that the environmental impacts of the Sellafield site are minimized according to the principles of Best Available Techniques (BAT).
In terms of radiological protection the SEMP has the following remit:
- to take account of the most important pathways of radiation exposure to the public
- conduct appropriate sampling and analysis relevant to those pathways
- to combine monitoring and habits data to yield estimates of radiation doses to the public
The results of the Sellafield Ltd environmental monitoring programme for 2022 are presented within this report alongside supplementary data published by the Food Standards Agency (from 2021) [11]. Detailed data from the monitoring programme are presented in Appendix A.
The main pathways identified by Sellafield Ltd, the Environment Agency and Food Standards Agency as relevant to calculating radiological doses from discharges from the Sellafield site are:
- internal exposure from the high rate consumption of seafood (particularly crustaceans and shellfish) and of local agricultural produce
- external gamma radiation from exposed intertidal sediments, particularly the silts and muds of estuaries and harbours
- inhalation of, and exposure to, airborne radioactivity
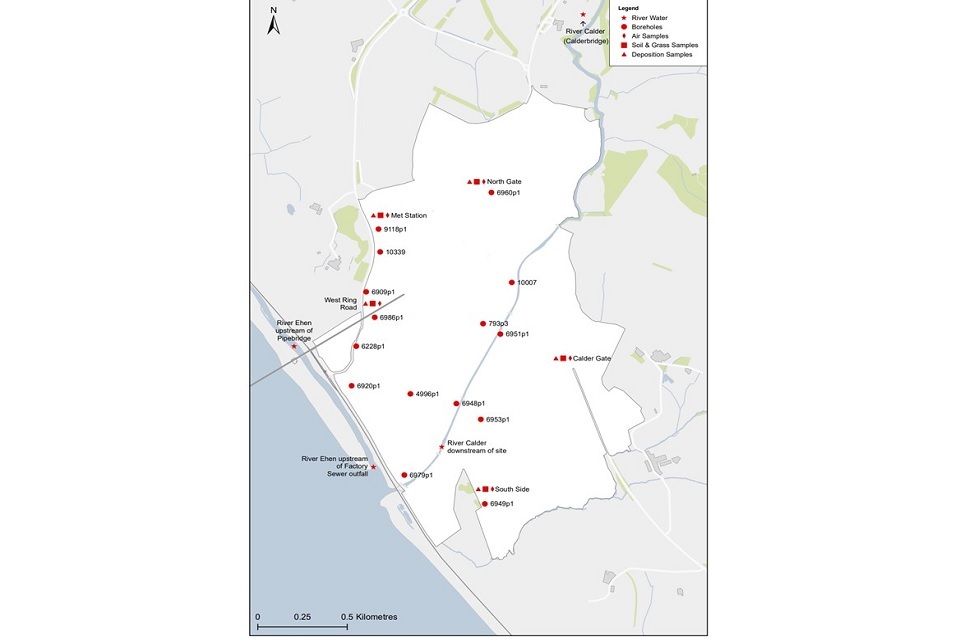
The locations sampled by the SEMP are also shown in figures 1 – 3 of Appendix A.
Marine monitoring
Concentrations of radionuclides in seafoods (fish, molluscs and crustaceans) were very low and comparable to previous years data.
The slight increases in actinide concentrations in seafood are due to historically discharged material that associates with fine silts and sediments.
Concentrations of radioactivity in seaweed, seawater and in sediments were broadly similar to those of recent years.
Gamma dose rate surveys are carried out in the areas most often frequented by members of the public and the site perimeter and the surrounding district.
Particular attention is paid to areas where silt or mud accumulates, such as in harbours or estuaries, where dose rates tend to be higher because of the presence of finely-divided sediments.
In general gamma dose rates are declining towards background levels and are consistent with the radioactive decay of key gamma emitting radioisotopes (cobalt-60, ruthenium-106 and caesium-137).
Water samples are collected from rivers (Calder and Ehen), lakes and domestic supplies.
The results are all very low and rarely above the limits of detection, except for strontium-90 which is generally present in rainwater and surface water at levels typical of those throughout the UK.
Higher strontium-90 concentrations are measured in the River Calder at Sellafield due to seepage of groundwater from site to the river.
This radioisotope is thought to be present due to historic leaks to ground and measurements have determined that elevated concentrations in the river occur immediately upstream of the statutory sampling point.
There is no evidence of any elevated levels of strontium-90 in any other environmental media (seawater or seafoods) and the contribution of strontium-90 to external doses is minimal.
Hence, the overall public dose consequences of these elevated levels would be insignificant.
Nevertheless, a watching brief will be kept on the situation to ensure that these conclusions remain valid.
Beach monitoring
The beach monitoring programme for 2022 conducted a total of 117 ha of beach monitoring against the programme target of 105 ha.
A total of 49 particles and 7 larger objects were detected, recovered, and analysed. Of these, 46 were alpha rich particles (where radioactivity was dominated by Am-241); 2 were beta rich particles (where radioactivity was dominated by Cs-137) and 1 other particle was found to be dominated by Co-60.
All the 7 beta rich larger objects were recovered from Sellafield beach). Find rates and radioactive contents in 2022 did not required any form of intervention through the Environment Agency notification and intervention protocol [12].
Terrestrial monitoring
High volume air samplers (HVAS), located close to the site perimeter and in nearby centres of population, are used to measure particulate radionuclides.
Levels on site were generally similar to previous years although slightly higher concentrations of caesium-137 and plutonium-alpha were recorded at the met station location.
These data were used as part of an investigation into the contamination of ventilation system inlet filters where total activity above the normal range was detected, identified to correspond to a period of elevated arisings at the HVAS.
Following investigation all filters have been classified as very low level waste and the worst case dose calculated to be <1% of the site total through gaseous pathways.
Off-site data were generally below the limit of detection, with most positive values reflecting sea to land transfer from marine discharges.
Total deposition collectors are located in the vicinity of each of the 5 high volume air samplers close to the Sellafield site perimeter.
Higher activity concentrations for beta-emitters (Strontium-90 and Caesium-137) were measured at the Sellafield site north gate, reflecting its close proximity to the open ponds and were also considered as part of the inlet filters investigation.
Sampling for atmospheric krypton-85 is conducted at the Sellafield Meteorological Station on the edge of Sellafield site.
Concentrations averaged 2.2 Bq m-3
with global background accounting for approximately 1.6 Bq m-3 and the discharges from the site accounting for approximately 0.6 Bq m-3. This is equivalent to an immersion dose due to krypton-85 discharges from Sellafield of 0.005 µSv per year for the adult age group.
These results are so low, in fact, that the monitoring and reporting Kr-85 will cease from this point onwards.
The milk results for 2022 are broadly similar to, or lower than, those observed for previous years, with many analyses at the limit of detection.
Concentrations in soil are similar to previous years whilst there was some evidence of enhanced grass concentrations and these data were used for the contaminated inlet filter investigation.
Measured concentrations were very low and typical of data from recent years.
Direct radiation
Dose rates at the Sellafield site perimeter, corrected for natural radiation, averaged 0.02 µGy per hour, which is slightly elevated over natural background.
Dose rates in the surrounding district were consistent with natural terrestrial background radiation and did not show a significant contribution from the Sellafield site.
An assessment of the maximum theoretical direct shine offsite dose to members of the public illustrated that doses could be approximately 3 µSv per year to people living and working adjacent to the site boundary.
Impacts on local groundwater
Sellafield Ltd undertakes groundwater monitoring to characterise and monitor groundwater quality and the environmental fate of in-ground contamination across the Sellafield site.
The groundwater monitoring network, in various configurations, has been in place for over 40 years and a considerable baseline dataset is available.
In addition, groundwater monitoring is undertaken in order to comply with Sellafield site Environmental Permits. The management of groundwater is underpinned by a Best Available Technique assessment.
The groundwater monitoring network for 2022 included 250 sample points across the site and adjacent land, targeting both bedrock (sandstone – principal aquifer) and superficial deposits and was designed to meet the monitoring objectives and provide targeted sampling in areas of interest.
In terms of spatial distribution of groundwater contaminants the routine groundwater monitoring results in 2022 (calendar year) were broadly similar to those reported in recent years.
Following the notification of a leak to ground from Magnox Swarf Storage Silo (MSSS) in late 2019, it was recognised that the release of silo liquor would likely be identified by an increase in the concentration of specific radionuclides in groundwater samples around the silo, particularly those radionuclides that have a low sorption to soil minerals, such as Tritium (H-3), Technetium (Tc-99), Chlorine (Cl-36) and Carbon (C-14).
In December 2019 an enhanced groundwater monitoring programme was introduced.
This included monitoring arrays of 15 monitoring wells in close proximity to MSSS, 8 slightly further away in the vicinity of the redundant settling tanks (RST) along the buried channel pathway and 4 to the south of the separation area on the Sellafield site.
This enhanced monitoring aimed to observe any changes in the physical and chemical properties of groundwater both spatially and temporally.
The initial enhanced monitoring programme involved monthly sampling for broad analysis (i.e., gross beta, gross alpha, tritium) and quarterly detailed analysis with speciation of specific radionuclides and inorganic parameters.
Following observed rising trends of tritium and identification of specific radionuclides attributed to the current leak in the late Spring/early Summer 2021, routine monitoring of the borehole array closest to MSSS was further enhanced to incorporate a monthly detailed analysis.
Monitoring of the next distal array of wells out from MSSS was also enhanced from quarterly to monthly from Summer 2021.
Work is ongoing to review and optimise the enhanced groundwater monitoring programme, based on analysis of the monitoring data collected since the start of the current leak to ground, and embed the programme within the routine sitewide groundwater monitoring programme.
The groundwater sampling programme provides crucial information on the impacts of site activities to groundwater, including identifying the contaminants of concern, the direction of contaminant migration, the dimensions and shape of the emerging/historical plumes and which groundwater pathways drive the highest risk.
Monitoring results may also be used to understand the prevailing geochemical processes and support any assessment required to evaluate environmental risk, including the potential for natural attenuation.
A summary of information on groundwater monitoring at the Sellafield site can be found in the Triennial Groundwater Reports, the first of which was published in 2021 and covers activities between 2017 and 2019.
The second iteration, covering 2020-2022, will be published in October 2023.
Impacts of solid waste dispositions 2022/23
Ensuring that the BAT waste route is used and diverting waste from the Low Level Waste Repository continues, the waste operating unit have reduced the accumulation of waste being stored on the Sellafield site by transferring radioactive waste to either an interim store, an onsite landfill, sent offsite for treatment, incineration or if there are no other routes, for the waste to be consigned to the repository.
Remediation completed a clean-up operation on the external areas of the Sellafield site.
This led to equipment such as barriers, road signs and fencing being reused by infrastructure and projects which has kept these items being used as part of the circular economy principles by these items not becoming waste.
The recycling rate for non-radioactive waste was 94% which was an increase of 3% from the previous year. This reduces our impact on the environment by utilising the waste management hierarchy by diverting waste from landfill sites.
The collation of data on the carbon footprint for non-radioactive waste vehicles moves was initiated in 2022/23 and further developments in capturing this data will continue in 2023/24.
7. References
[1] HMSO (2010). The Air Quality Standards Regulations. Available online at: https://www.legislation.gov.uk/uksi/2010/1001/contents/made
[2] Environment Agency (2022). Risk assessments for your environmental permit. Available online at:https://www.gov.uk/guidance/risk-assessments-for-your-environmental-permit
[3] Cmnd 2919 (1995). Review of radioactive waste management policy: Final conclusions. HMSO, London.
[4] McKay W A and Stephens B A (1990). A survey of fish and shellfish radioactivity levels in Cumbrian near- shore waters, 1989. AEA-EE-0041, Harwell.
[5] McKay W A and Walker M I (1990). Plutonium and americium behaviour in Cumbrian near-shore waters. J. Environ. Radioactivity 12: 49-77.
[6] Walker M I and McKay W A (1991). Radionuclide distributions in seawater around the Sellafield pipeline. Est. Coast. Shelf Sci. 32: 385-393.
[7] Isle of Man Government Laboratory (2011). Radioactivity monitoring on the Isle of Man 2010.
[8] Watson S J, Jones A L, Oatway W B and Hughes J S (2005). Ionising radiation exposure of the UK population: 2005 Review. UK HSA Report HPA-RPD-001, HMSO, London.
[9] Hughes J S and Shaw K B (1996). Radiation doses from natural radiation. NRPB Report M748.
[10] Saunders P (1990). Radiation and you. Banson.
[11] Environment Agency, Food Standards Agency, Food Standards Scotland, Natural Resources Wales, Northern Ireland Environment Agency and Scottish Environment Protection Agency (2022). Radioactivity in food and the environment, 2021. RIFE-27. EA, FSA, FSS, NRW, NIEA and SEPA; Preston, London, Aberdeen, Cardiff, Belfast and Stirling.
[12] Environment Agency (2020). Sellafield radioactive objects notification and intervention plan, Penrith: Environment Agency. Available online at: https://www.gov.uk/government/publications/sellafield-radioactive-objects-notification-and-intervention-plan/sellafield-radioactive-objects-notification-and-intervention-plan
8. Appendix A
Figure 1. Marine environmental monitoring around Sellafield

Figure 2. - Terrestial environmental monitoring around Sellafield
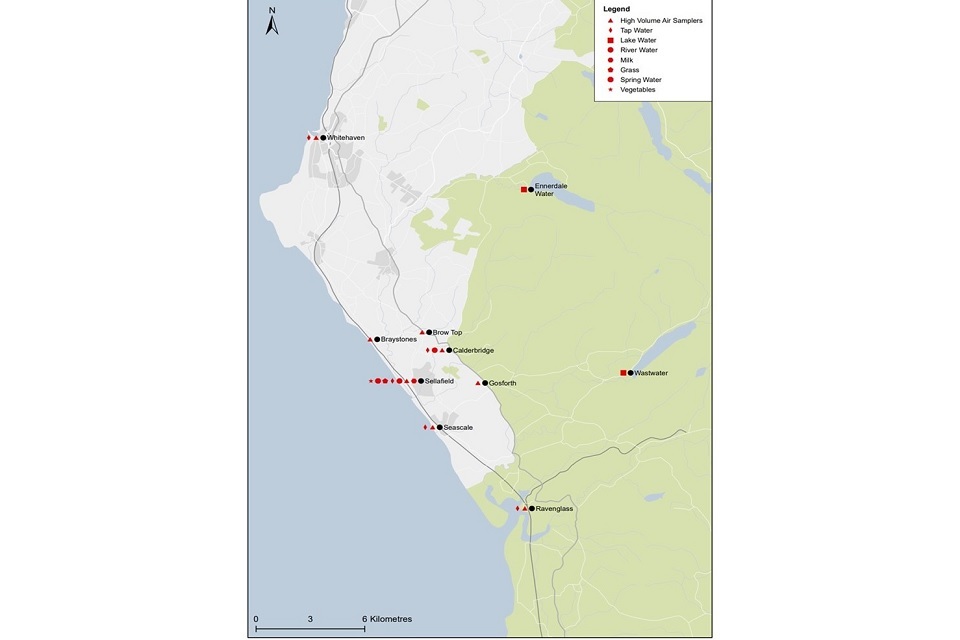
Figure 3. - Environmental monitoring at the Sellafield site
8.1 Discharge data tables
Table 1 - Radioactive discharges to the Irish Sea, 2018 - 2022.
| Radionuclides | Annual discharge (TBq) 2018 | Annual discharge (TBq) 2019 | Annual discharge (TBq) 2020 | Annual discharge (TBq) 2021 | Annual discharge (TBq) 2022 | Permitted Limits (all sources) |
|---|---|---|---|---|---|---|
| Tritium | 1,300 | 420 | 190 | 180 | 130 | 3,000/700 (b) |
| Carbon-14 | 2.9 | 2.8 | 1.2 | 1.3 | 0.85 | 13/5.1 (b) |
| Cobalt-60 | 0.02 | 0.02 | 0.02 | 0.01 | 0.01 | 2.5 |
| Strontium-90 | 1.3 | 1.2 | 1.4 | 2.4 | 1.8 | 14 |
| Zirconium-95 | 0.03 | 0.03 | 0.03 | - | 0.02 | - |
| Niobium-95 | 0.03 | 0.02 | - | - | 0.01 | - |
| Technetium-99 | 0.93 | 0.94 | 0.62 | 0.48 | 0.35 | 7.5/4.5 (b) |
| Ruthenium-106 | 0.54 | 0.46 | 0.27 | 0.17 | 0.16 | 3.1 |
| Iodine-129 | 0.30 | 0.04 | 0.03 | 0.02 | 0.02 | 0.32 |
| Caesium-134 | 0.04 | 0.02 | 0.03 | - | - | - |
| Caesium-137 | 4.4 | 1.6 | 2.5 | 1.4 | 1.3 | 17 |
| Plutonium-alpha | 0.14 | 0.11 | 0.10 | 0.08 | 0.07 | 0.29 |
| Plutonium-241 | 1.9 | 1.2 | 1.1 | 0.83 | 0.73 | 6 |
| Americium-241 | 0.02 | 0.02 | 0.01 | 0.01 | 0.01 | 0.14 |
| Total alpha (a) | 0.16 | 0.13 | 0.12 | 0.09 | 0.08 | 0.34 |
| Total beta (a) | - | 6.8 | 7.1 | 7.4 | 6.5 | 63 |
| Uranium (kg) | 310 | 260 | 180 | 130 | 110 | - |
a. ‘total alpha’ and ‘total beta’ are control measures relating to specified analytical determinations. They do not reproduce precisely the contributions from all individual isotopes.
b. Upper tier of permitted limit in force until the completion of Magnox reprocessing. Lower tier limits for tritium, carbon-14 and technetium-99 applied from October 2022 onwards following agreement with the Environment Agency.
Table 2. Total airborne radioactive discharges, 2018 – 2022 (TBq)
| 2018 | 2019 | 2020 | 2021 | 2022 | Permitted Limits | |
|---|---|---|---|---|---|---|
| (all sources) | ||||||
| Tritium | 90 | 56 | 38 | 39 | 15 | 370/170 (ᵃ) |
| Carbon-14 | 0.43 | 0.25 | 0.13 | 0.07 | 0.09 | 2.3/0.38 (ᵃ) |
| Krypton-85 | 65,000 | 7,800 | 4,300 | 4,300 | 2,500 | 70,000 |
a. Upper tier of permitted limit in force until the completion of Magnox reprocessing. Lower tier limits for tritium and carbon-14 applied from October 2022 onwards following agreement with the Environmental Agency.
Table 3. Total airborne radioactive discharges, 2018 – 2022 (GBq)
| 2018 | 2019 | 2020 | 2021 | 2022 | Permitted Limits | |
|---|---|---|---|---|---|---|
| (all sources) | ||||||
| Strontium-90 | 0.01 | 0.009 | 0.01 | 0.004 | 0.003 | 0.50 |
| Ruthenium-106 | 0.49 | 0.56 | 0.55 | 0.55 | 0.61 | 2.8 |
| Antimony-125 | 1.3 | 1.5 | 1.1 | 0.53 | 0.41 | 30 |
| Iodine-129 | 10 | 3.2 | 2.1 | 1.8 | 1.8 | 42/13 (ᵃ) |
| Caesium-137 | 0.05 | 0.07 | 0.08 | 0.05 | 0.04 | 4.8 |
| Plutonium-alpha | 0.03 | 0.01 | 0.01 | 0.009 | 0.006 | 0.13 |
| Americium-241 + Curium-242 | 0.02 | 0.01 | 0.01 | 0.009 | 0.009 | 0.08 |
| Total alpha | 0.10 | 0.08 | 0.10 | 0.07 | 0.07 | 0.66 |
| Total beta | 0.66 | 0.64 | 0.74 | 0.70 | 0.90 | 32 |
a. Upper tier of permitted limit in force until the completion of Magnox reprocessing. Lower tier limits for iodine 129 applied from October 2022 onwards following agreement with the Environmental Agency.
Table 4. Solid low level waste arisings from Sellafield, 2018 - 2022
| Low level waste (LLW) arisings (m3) | 2018 | 2019 | 2020 | 2021 | 2022 |
|---|---|---|---|---|---|
| Low level waste produced on Sellafield site which has been reused, recycled or disposed of | 9,000 | 9,400 | 5,100 | 12,000 | 8,200 |
| LLW metal waste recycled | 3,100 | 2,900 | 1,700 | 140 | 800 |
| Combustible LLW treated | 2,200 | 2,100 | 2,500 | 2,100 | 2,400 |
| LLW disposed of directly to landfill (as LLW, HV-VLLW or exempt waste but excluding waste that is out of scope of regulation) | 580 | 850 | 210 | 400 | 320 |
| LLW disposed of on site | 2,300 | 3,100 | 600 | 9,300 | 4,000 |
| Volume of LLW disposed of at LLWR | 880 (ᵃ) | 520(ᵃ) | 80 | 300 | 600 |
a. Volume includes volume of compactable Low Level Waste
Table 5. Non-radioactive aqueous waste discharges (kg), 2018 - 2022
| Substance | Release points | 2018 | 2019 | 2020 | 2021 | 2022 | Annual Limit (ᵃ) |
|---|---|---|---|---|---|---|---|
| Chromium | Site Ion Exchange Effluent Plant (SIXEP), Segregated Effluent Treatment Plant (SETP), Enhanced Actinide Removal Plant (EARP) | 40 | 5.6 | 14 | 4.1 | 13.7 | 1,200 |
| N as NO ² and NO ³ | SETP, EARP | 1,000,000 | 1,000,000 | 410,000 | 590,000 | 311000 | 4,080,000 |
| N as NO ² and NO³ | Thorp-C14 Removal Plant | 4,600 | 420 | 110 | 260 | 55 | 26,900 |
| Glycol | SETP, SIXEP, EARP, Lagoon | 1,500 | 7,600 | 2,000 | 3,400 | 9,800 | 12,000 |
a. Annual mass limits reported under the Installations environmental permit
Table 6. Non-radioactive gaseous waste discharges (tonne), 2018 - 2022
| Substance | Release points | 2018 | 2019 | 2020 | 2021 | 2022 | Annual Limit (ᵃ) |
|---|---|---|---|---|---|---|---|
| Oxides of nitrogen (as NO²) | Vitrification Test Rig | 33 | 40 | 43 | 48 | 26 | 1,000 |
| Oxides of nitrogen (as NO²) | National Nuclear Laboratory Central Laboratory | 14 | 11 | 5.4 | 7.3 | 2.2 | 500 |
| Particulate matter | Fellside Combined Heat and Power Plant (CHP) (as PM10) | 360 | 230 | 190 | 160 | 324 | - |
a. Annual mass limits reported under the Installations environmental permit
Table 7. Non-radioactive gaseous waste discharges (tonne), 2018 – 2022
| Substance | Release points (ᵃ) | 2018 | 2019 | 2020 | 2021 | 2022 |
|---|---|---|---|---|---|---|
| Oxides of nitrogen (as NO²) | Site Total | 330 | 250 | 180 | 83 | 90 |
| Carbon dioxide | Site Total | 320,000 | 260,000 | 260,000 | 137,000 | 156,000 |
| Carbon monoxide (b) | Site Total | 42 | 0.03 | 17 | 6.94 | 14.26 |
| Non-Methane Volatile organic compounds (NMVOCs) | Site Total | 63 | 32 | 23 | 23 | 22 |
| Methane | Site Total | 17 | 0.01 | 14 | 10 | 7.99 |
a. Site total includes Fellside Combined Heat and Power Plant.
b. Environment Agency agreed reporting value as carbon monoxide discharges significantly below reporting threshold (BRT) values.
Table 8. Discharges of ozone depleting substances and fluorinated greenhouse gases (kg), 2018 - 2022
| Substance (ᵃ) | 2018 | 2019 | 2020 | 2021 | 2022 |
|---|---|---|---|---|---|
| R22 HCFC | - | 4 | - | - | 0.5 |
| R134A HFC | 70 | 1000 | 320 | 203 | 1284 |
| R407C HFC | 19 | 50 | 100 | 70 | 39.4 |
| R404A HFC | 5.3 | 3.6 | - | 7 | 2.1 |
| R410A HFC | 12 | 82 | 42 | 56 | 80 |
a. HCFCs are ozone depleting substances and HFCs are fluorinated greenhouse gases.
Note: the range of substances discharged varies each year depending on which equipment is topped up with refrigerants. No annual mass limits apply.
Table 9. Non-radioactive solid waste arisings from Sellafield, 2018 – 2022
| Non-Radioactive Waste Arisings (te) | 2018 | 2019 | 2020 | 2021 | 2022 | |
|---|---|---|---|---|---|---|
| Non-Hazardous Waste Arisings | Non-hazardous waste produced on site | 38,000 | 92,000 | 43,000 | 22,000 | 24,000 |
| Non-Hazardous Waste Arisings | Non-hazardous waste reused or recycled | 9,300 | 2,800 | 30,000 | 21,000 | 24,000 |
| Non-Hazardous Waste Arisings | % of non-hazardous waste reused or recycled | 24 % | 3.1 % | 69% | 94% | >99% |
| Hazardous Waste Arisings | Hazardous waste produced on site | 1,200 | 1,100 | 2,900 | 1,700 | 1,400 |
| Hazardous Waste Arisings | Hazardous waste reused or recycled | 500 | 99 | 170 | 290 | 135 |
| Hazardous Waste Arisings | % of hazardous waste reused or recycled | 42 % | 9.2 % | 5.8% | 17% | 9.8% |
Whilst every effort is made to centrally record all non-rad waste arisings, some sub-contractors may not provide this information, so the actual quantity produced may be higher than the centrally recorded figure.
Note that no annual mass limits apply.
8.2 Environmental Monitoring Data
Table 10. Radioactivity in fish (Bq kg-1 wet weight), 2022
| Species | Location | Mean radionuclide concentration (Bq kg-1 wet weight) 14 Cᵃ | Mean radionuclide concentration (Bq kg-1 wet weight) 99 Tc | Mean radionuclide concentration (Bq kg-1 wet weight) 137 Cs | Mean radionuclide concentration (Bq kg-1 wet weight) Pu (α) | Mean radionuclide concentration (Bq kg-1 wet weight) 241 Am |
|---|---|---|---|---|---|---|
| Cod | Seascale landed | 33 | <0.31 | 2.5 | <0.003 | <0.003 |
| Cod | Whitehaven landed | 31 | <0.26 | 2.9 | <0.004 | 0.006 |
| Plaice | Seascale landed | 39 | 1.5 | 0.99 | 0.006 | 0.006 |
| Plaice | Whitehaven landed | 38 | 1.9 | 0.93 | 0.008 | 0.007 |
a. 14 C data include natural background
Table 11. Radioactivity in molluscs (Bq kg-1 {wet weight}), 2022
Mean radionuclide concentration (Bq kg-1 wet weight)
| Species | Location | Total Alpha | Total Beta | 14 Ca | 60 Co | 90 Sr | 99 Tc | 106 Ru | 129 I | 137 Cs | U(α) | 237 Np | Pu(α) | 238 Pu | 239+240 Pu | 241 Pu | 241 Am | Cm (α) |
| Mussels | SCAN – A | - | - | 67 | - | 0.26 | 10 | - | - | - | 0.76 | - | 2.5 | 0.38 | 2.2 | 8.8 | 5.4 | - |
| Mussels | SCAN - | 12 | 51 | - | 0.48 | - | - | <0.64 | - | 1.1 | - | - | - | - | - | - | 5.0 | - |
| Mussels | SCAN – | 22 | 67 | - | 0.36 | - | - | <0.88 | - | 0.76 | - | - | - | - | - | - | 5.1 | - |
| Mussels | SCAN | 17 | 59 | 67 | 0.42 | 0.26 | 10 | <0.76 | - | 0.93 | 0.76 | - | 2.5 | 0.38 | 2.2 | 8.8 | 5.2 | - |
| Mussels | WH - Al | - | - | 40 | - | 0.13 | 11 | - | - | - | 0.79 | - | 1.9 | 0.28 | 1.6 | 5.8 | 3.3 | - |
| Mussels | WH - Bl | 9.5 | 43 | - | 0.07 | - | - | <0.57 | - | 0.51 | - | - | - | - | - | - | 1.7 | - |
| Mussels | WH - Bl | 8.8 | 57 | - | <0.08 | - | - | <0.76 | - | 0.92 | - | - | - | - | - | - | 3.8 | - |
| Mussels | WH Ave. | 9.2 | 50 | 40 | <0.08 | 0.13 | 11 | <0.67 | - | 0.72 | 0.79 | - | 1.9 | 0.28 | 1.6 | 5.8 | 2.9 | - |
| Mussels | SCA Ave. | 13 | 55 | 54 | 0.25 | 0.20 | 11 | <0.71 | - | 0.82 | 0.78 | - | 2.2 | 0.33 | 1.9 | 7.3 | 4.1 | - |
| Winkles | SCAN - | - | - | 44 | - | - | - | - | <0.16 | - | - | - | - | - | - | - | - | - |
| Winkles | SCAN – Q | 48 | 110 | - | 0.43 | 2.0 | 39 | <0.88 | - | 6.6 | 2.7 | 0.02 | 12 | 1.7 | 9.9 | 39 | 22 | <0.11 |
| Winkles | SCAN – Q | 52 | 96 | - | 0.58 | 0.98 | 16 | <0.91 | - | 5.9 | 2.0 | 0.01 | 11 | 1.6 | 9.4 | 36 | 19 | 0.04 |
| Winkles | SCAN – Q | 18 | 90 | - | 0.37 | 1.3 | 10 | <0.75 | - | 2.8 | 1.3 | 0.007 | 5.2 | 0.70 | 4.5 | 17 | 9.5 | <0.08 |
| Winkles | SCAN – Q | 14 | 60 | - | 0.31 | 0.58 | 22 | <0.76 | - | 1.5 | 1.3 | 0.005 | 3.5 | 0.46 | 3.0 | 10 | 6.8 | 0.03 |
| Winkles | SCAN Ave | 33 | 89 | 44 | 0.42 | 1.2 | 22 | <0.83 | <0.16 | 4.2 | 1.8 | 0.01 | 7.9 | 1.1 | 6.7 | 26 | 14 | <0.07 |
| Winkles | SCAS – A | - | - | 69 | - | - | - | - | <0.14 | - | - | - | - | - | - | - | - | - |
| Winkles | SCAS – Q | 27 | 86 | - | 0.45 | 0.44 | 50 | <0.67 | - | 1.5 | 2.7 | 0.007 | 5.5 | 0.74 | 4.8 | 19 | 8.6 | <0.05 |
| Winkles | SCAS – Q | 40 | 100 | - | 0.58 | 0.89 | 66 | <0.85 | - | 3.8 | 3.0 | 0.01 | 9.6 | 1.5 | 8.0 | 33 | 14 | <0.05 |
| Winkles | SCAS – Q | 18 | 82 | - | 0.48 | 0.64 | 19 | <1.1 | - | 1.8 | 1.7 | 0.005 | 4.3 | 0.59 | 3.7 | 15 | 9.0 | <0.06 |
| Winkles | SCAS – Q | 31 | 83 | - | 0.48 | 0.68 | 32 | <1.0 | - | 1.6 | 2.2 | 0.006 | 5.1 | 0.79 | 4.3 | 17 | 8.4 | 0.03 |
| Winkles | SCAS Ave. | 29 | 88 | 69 | 0.50 | 0.66 | 42 | <0.91 | <0.14 | 2.2 | 2.4 | 0.007 | 6.1 | 0.91 | 5.2 | 21 | 10 | <0.05 |
| Winkles | SCA Ave. | 31 | 88 | 57 | 0.46 | 0.94 | 32 | <0.87 | <0.15 | 3.2 | 2.1 | 0.009 | 7.0 | 1.0 | 6.0 | 23 | 12 | <0.06 |
Notes: SCA – Sellafield Coastal Area; N – North, S- South, A – Annual sample, B – Biannual sample, Q – Quarterly sample, Ave.- Average.
Table 12. Radioactivity in crustaceans (Bq kg-1 wet weight), 2022
Mean concentration (Bq kg-1 {wet weight}
| Species | Location | 14 Ca | 60 Co | 90 Sr | 99 Tc | 129 I | 137 Cs | U(α) | Pu(α) | 241 Am |
|---|---|---|---|---|---|---|---|---|---|---|
| Edible Crab | SCA (north) - Early | 50 | - | 0.04 | 3.3 | - | 0.44 | 0.15 | 0.13 | 0.65 |
| Edible Crab SCA (north) - Late | 84 | - | 0.10 | 5.6 | - | 0.41 | 0.29 | 0.27 | 0.99 | |
| Edible Crab | SCA (north) Average | 67 | - | 0.07 | 4.5 | - | 0.43 | 0.22 | 0.20 | 0.82 |
| Edible Crab | SCA (south) - Early | 63 | 0.20 | 0.10 | 7.0 | - | 0.54 | 0.23 | 0.16 | 0.78 |
| Edible Crab | SCA (south) - Late | 72 | - | 0.09 | 4.2 | - | 0.42 | 0.28 | 0.19 | 0.65 |
| Edible Crab | SCA (south) Average | 68 | 0.20 | 0.10 | 5.6 | - | 0.48 | 0.26 | 0.18 | 0.72 |
| Edible Crab SCA Average | 67 | 0.20 | 0.08 | 5.0 | - | 0.45 | 0.24 | 0.19 | 0.77 | |
| Edible Crab | WL - Early | 72 | - | <0.07 | 5.0 | - | 0.48 | 0.13 | 0.16 | 0.66 |
| Edible Crab | WL - Late | 70 | - | 0.10 | 3.6 | - | 0.48 | 0.29 | 0.20 | 0.85 |
| Edible Crab | WL - Average | 71 | - | <0.09 | 4.3 | - | 0.48 | 0.21 | 0.18 | 0.76 |
| Lobster | SCA (north) - Early | 54 | - | - | 45 | <0.15 | 0.51 | 0.03 | 0.08 | 0.56 |
| Lobster | SCA (north) - Late | 44 | - | - | 15 | <0.18 | 0.60 | 0.07 | 0.16 | 0.72 |
| Lobster SCA (north) Average | 49 | - | - | 30 | <0.17 | 0.56 | 0.05 | 0.12 | 0.64 | |
| Lobster | SCA (south) - Early | 64 | - | - | 48 | <0.15 | 0.67 | 0.02 | 0.10 | 0.64 |
| Lobster SCA (south) - Late | 27 | - | - | 14 | <0.20 | 0.18 | 0.03 | 0.01 | <0.11 | |
| Lobster | SCA (south) Average | 46 | - | - | 31 | <0.18 | 0.43 | 0.03 | 0.06 | <0.38 |
| Lobster SCA Average | 47 | - | - | 31 | <0.17 | 0.49 | 0.04 | 0.09 | 0.51 | |
| Lobster | WL – Early | 65 | - | - | 51 | <0.17 | 0.63 | 0.02 | 0.07 | 0.58 |
| Lobster | WL – Late | 41 | - | - | 32 | <0.20 | 0.38 | 0.07 | 0.07 | 0.46 |
| Lobster | WL - Average | 53 | - | - | 42 | <0.19 | 0.51 | 0.05 | 0.07 | 0.52 |
| Nephrops (Scampi) | SCA – Annual | 47 | - | 0.06 | - | <0.18 | - | - | - | - |
| Nephrops (Scampi) | SCA – Early | - | - | - | 20 | - | 1.0 | - | 0.58 | 1.9 |
| Nephrops (Scampi) | SCA – Lateᵇ | - | - | - | 12 | - | 0.51 | - | 0.25 | 1.0 |
| Nephrops (Scampi) | SCA Average | 47 | - | 0.06 | 16 | <0.18 | 0.76 | - | 0.42 | 1.5 |
| Nephrops (Scampi) | WL – Annual | 49 | - | 0.11 | - | <0.25 | - | - | - | - |
| Nephrops (Scampi) | WL – Early | - | - | - | 22 | - | 1.4 | - | 0.93 | 2.9 |
| Nephrops (Scampi) | WL – Lateᵇ | - | - | - | 17 | - | 0.46 | - | 0.33 | 1.4 |
| Nephrops (Scampi) | WL - Average | 49 | - | 0.11 | 20 | <0.25 | 0.93 | - | 0.63 | 2.2 |
Notes: 14C data include natural background; SCA – Sellafield coastal area; WL – Whitehaven Landed
Table 13. Radioactivity in seaweed, 2022
Mean concentration (Bq kg-1 wet weight)
| Species | Location | Total α | Total β | 14 Ca | 60 Co | 90 Sr | 99 Tc | 106 Ru | 129 I | 137 Cs | U(α) | Pu(α) | 241 Am |
|---|---|---|---|---|---|---|---|---|---|---|---|---|---|
| Fucus vesiculosis | Nethertown | 19 | 210 | 18 | 0.27 | 0.50 | 320 | - | <0.47 | 2.3 | 5.5 | 7.5 | 3.9 |
| Fucus vesiculosis | Drigg Barnscar | 25 | 210 | 35 | 0.22 | 0.56 | 410 | - | <0.57 | 1.8 | 6.4 | 10 | 4.0 |
| Fucus vesiculosis | Walney Island | 18 | 210 | 19 | - | 0.31 | 290 | - | <0.48 | 1.4 | 7.1 | 5.4 | 2.3 |
| Porphyra umbilicalis | St Bees | 14 | 120 | 33 | - | 0.36 | 0.93 | <0.50 | - | 1.4 | 0.41 | 3.4 | 6.3 |
| Porphyra umbilicalis | Braystones | 11 | 150 | 32 | - | <0.17 | 1.8 | <0.60 | - | 0.89 | 0.40 | 3.1 | 4.4 |
| Porphyra umbilicalis | Sellafield | 13 | 130 | 41 | - | 0.17 | 2.3 | <0.53 | - | 0.89 | 0.38 | 2.4 | 4.3 |
| Porphyra umbilicalis | Seascale Neb | 16 | 140 | 39 | 0.05 | 0.13 | 1.4 | <0.46 | - | 0.93 | 0.42 | 2.9 | 5.0 |
| Porphyra umbilicalis | St. Bees - Selker (Av) | 14 | 140 | 36 | 0.05 | 0.21 | 1.6 | <0.52 | - | 1.0 | 0.40 | 2.9 | 5.0 |
a. 14 C data include natural background
Fucus vesiculosus is collected because it accumulates many radionuclides (particularly technetium-99) and is sensitive to fluctuations in their concentrations in seawater.
Porphyra umbilicalis is also collected and monitored as an indicator species particularly due to its historical exposure pathway role for ruthenium-106.
Table 14. Radioactivity in coastal samples of seawater from the Irish Sea, 2022
Mean concentration (Bq l-1)
| Location | Total α | Total β | 3 H | 14 C | 90 Sr | 99 Tc | 129 I | 137 Cs | U(α) | 237 Np | Pu(α) | 241 Pu | 241 Am | |
|---|---|---|---|---|---|---|---|---|---|---|---|---|---|---|
| St Bees | filtrate | <2.8 | 8.8 | <5.3 | 0.61 | 0.02 | <0.03 | <0.03 | <0.03 | 0.09 | <0.0004 | 0.002 | <0.05 | 0.0007 |
| St Bees | solids | 0.13 | 0.17 | - | - | 0.006 | - | - | 0.01 | 0.002 | 0.00002 | 0.02 | 0.08 | 0.04 |
| Sellafield | filtrate | <2.9 | 8.5 | 5.4 | 0.49 | 0.05 | <0.03 | <0.02 | <0.03 | 0.08 | <0.0004 | 0.003 | <0.04 | 0.001 |
| Sellafield | solids | 0.13 | 0.13 | - | - | 0.003 | - | - | 0.01 | 0.002 | 0.00003 | 0.02 | 0.09 | 0.04 |
| Seascale Neb | filtrate | <3.0 | 11 | 4.1 | <0.69 | 0.03 | <0.02 | <0.02 | 0.03 | 0.09 | <0.0003 | 0.003 | <0.05 | 0.001 |
| Seascale Neb | solids | 0.19 | 0.19 | - | - | 0.005 | - | - | <0.02 | 0.003 | 0.00005 | 0.04 | 0.15 | 0.07 |
| Drigg Barnscar | filtrate | <3.0 | 9.8 | <3.9 | 0.46 | 0.03 | <0.03 | <0.03 | 0.04 | 0.09 | <0.0004 | 0.003 | <0.04 | 0.001 |
| Drigg Barnscar | solids | 0.09 | 0.14 | - | - | <0.003 | - | - | <0.008 | 0.001 | 0.00001 | 0.01 | 0.05 | 0.03 |
Table 15. Radioactivity in sediment from the West Cumbrian Coast, 2022
Mean radionuclide concentration (Bq kg-1 dry weight)
| Location | Total α | Total β | 60 Co | 90 Sr | 99 Tc | 137 Cs | U-α | Pu-α | 241 Pu | 241 Am | ||
|---|---|---|---|---|---|---|---|---|---|---|---|---|
| Sand | St Bees | 590 | 370 | 0.27 | - | - | 41 | - | 94 | - | 95 | |
| Sand | Braystones | 590 | 370 | 0.17 | - | - | 26 | - | 95 | - | 100 | |
| Sand | Sellafield | 490 | 400 | 0.14 | - | - | 35 | - | 92 | - | 97 | |
| Sand | Seascale Neb | 880 | 470 | 0.15 | - | - | 21 | - | 92 | - | 94 | |
| Sand | Drigg Barnscar | 460 | 440 | 0.16 | - | - | 16 | - | 69 | - | 76 | |
| Silt | Ravenglass Ford | 1,100 | 820 | <1.9 | 12 | 16 | 63 | 49 | 200 | 610 | 300 | |
| Silt | Ravenglass Garth | 450 | 330 | <1.6 | <0.84 | 3.5 | 12 | 28 | 92 | 270 | 150 | |
| Silt | Ravenglass Opp Raven Villa | 1,100 | 380 | <1.6 | 9.5 | 14 | 63 | 51 | 140 | 510 | 280 | |
| Silt | Eskmeals, R Esk south bank downstream of viaduct | 1,200 | 690 | <0.92 | 9.1 | 12 | 59 | 44 | 180 | 510 | 250 | |
| Silt | Eskmeals Newbiggin Marsh | 1,300 | 1,000 | <1.3 | 75 | 25 | 130 | 49 | 350 | 990 | 570 | |
| Silt | R Esk Muncaster Rd Bridge; Downstream | 2,600 | 1,100 | <1.4 | 50 | 35 | 250 | 57 | 460 | 1,400 | 880 | |
| Silt | Whitehaven Outer Harbour (south) | 580 | 510 | <0.83 | 0.80 | 8.4 | 190 | 27 | 98 | 240 | 130 | |
| Silt | Silt from R Calder | 490 | 710 | <1.2 | 4.0 | 3.0 | 57 | 37 | 95 | 230 | 90 | |
| Silt | Silt from R Ehen | 1,500 | 1,200 | <1.7 | 14 | 11 | 140 | 69 | 230 | 610 | 350 | |
| Silt | Waberthwaite | 1,600 | 1,100 | <1.3 | 20 | 19 | 160 | 59 | 340 | 1,000 | 570 |
Table 16. Mean gamma dose rates measured in air in intertidal and other coastal areas of Cumbria, 2022
| Area of survey | Description | Nature of ground | N (b) | Mean dose rate (µGy h-1) (a) |
|---|---|---|---|---|
| Whitehaven Harbour (north) | outer harbour | mud/silt | 4 | 0.14 |
| St Bees (groynes) | groynes | pebbles/rocks | 1 | 0.14 |
| St Bees | Seamill Lane car park | car park | 1 | 0.14 |
| Coulderton | grassed areas/beach bungalows | grass banks | 1 | 0.16 |
| Nethertown | beach | pebbles/shingle | 1 | 0.16 |
| Braystones | beach | pebbles/shingle | 1 | 0.15 |
| Sellafield Beach | beach | 1 | 0.14 | |
| Sellafield Dunes | dunes | 1 | 0.13 | |
| Sellafield | pipeline 3 | sand | 12 | 0.09 |
| Sellafield | pipeline 4 | sand | 12 | 0.10 |
| Factory Sewer | outfall | rocks / boulders / sand / shingle | 4 | 0.14 |
| Seascale Beach | south of pipeline | rocks/sand | 4 | 0.12 |
| Drigg Beach | beach | sand | 1 | 0.14 |
| Ravenglass | Raven Villa | saltmarsh | 1 | 0.12 |
| Ravenglass | small boat area | firm silt / pebbles | 1 | 0.14 |
| Ravenglass | Salmon Garth (saltmarsh) | sand / firm silt | 1 | 0.15 |
| Eskmeals Viaduct | saltmarsh | saltmarsh | 1 | 0.14 |
| Newbiggin | saltmarsh | saltmarsh | 4 | 0.16 |
| Muncaster Road Bridge | riverbank | grass | 1 | 0.17 |
| Hall Waberthwaite | saltmarsh | saltmarsh turf | 1 | 0.14 |
a. Figures include contributions from natural background, typically 0.05 μGy h-1 over sandy areas and 0.07 μGy h-1 over silt.
b. Number of observations
Table 17. Mean gamma dose rates measured in air at Sellafield site perimeter, 2022
| Area of survey | Number of locations | Mean dose rate (µGy h-1) (a) |
|---|---|---|
| North | 4 | 0.01 |
| East | 5 | 0.02 |
| South | 3 | 0.008 |
| West | 4 | 0.04 |
| River Ehen | 2 | 0.01 |
| River Calder | 12 | 0.002 |
| Critical Group | 1 | 0.04 |
| Mean annual average | - | 0.02 |
a. Figures exclude contribution from natural background (approximately 0.06 μSv h-1).
Table 18. Mean gamma dose rates measured in air in the vicinity of Sellafield, 2022
| Location | Mean dose rate (µGy h-1) (a) |
|---|---|
| Calderbridge | 0.06 |
| Seascale | 0.05 |
| Ravenglass | 0.04 |
| Braystones | 0.05 |
| Whitehaven | 0.04 |
| Gosforth | 0.05 |
| Brow Top | 0.05 |
a. Figures include contribution from natural background (approximately 0.06 μGy h-1).
Table 19. Radioactivity in air in the vicinity of Sellafield - Site Perimeter Locations, 2022
Mean concentration (mBq m-3)
| Radionuclide | Calder Gate | Met. Station | North Gate | West Ring Road | South Side |
|---|---|---|---|---|---|
| Total Alpha | 0.03 | 0.04 | 0.04 | 0.04 | 0.03 |
| Total Beta | 0.28 | 0.34 | 0.34 | 0.29 | 0.27 |
| 90 Sr | 0.003 | 0.008 | 0.01 | 0.002 | 0.002 |
| 106 Ru | <0.04 | <0.04 | <0.04 | <0.04 | <0.03 |
| 125 Sb | <0.01 | <0.01 | <0.01 | <0.01 | <0.01 |
| 137 Cs | 0.01 | 0.06 | 0.04 | <0.006 | <0.008 |
| Pu | 0.0006 | 0.001 | 0.0007 | 0.0003 | 0.0003 |
| 241 Pu | <0.02 | <0.02 | <0.02 | <0.02 | <0.02 |
| 241 Am | 0.0005 | 0.0006 | 0.0006 | 0.0003 | 0.0004 |
| 235 U | 0.00002 | 0.00001 | 0.00002 | 0.00001 | 0.00001 |
| 238 U | 0.0003 | 0.0003 | 0.0006 | 0.0003 | 0.0003 |
Table 20. Radioactivity in air in the vicinity of Sellafield - Residential Locations, 2022
Mean concentration (mBq m-3)
| Radionuclide | Brow Top | Braystones | Calderbridge | Gosforth | Ravenglass | Seascale | Whitehaven |
|---|---|---|---|---|---|---|---|
| 90 Sr | 0.0002 | 0.0003 | 0.0006 | 0.0002 | 0.0004 | 0.0005 | 0.0002 |
| 137 Cs | <0.005 | <0.005 | <0.004 | <0.005 | <0.005 | <0.005 | <0.003 |
| Pu | 0.00008 | 0.0002 | <0.0002 | <0.0002 | 0.0002 | 0.001 | 0.0001 |
| 241 Pu | <0.02 | <0.04 | <0.03 | <0.03 | <0.04 | <0.03 | <0.03 |
| 241 Am | 0.0001 | 0.0002 | 0.00008 | 0.00007 | 0.0001 | 0.002 | 0.00009 |
| 235 U | 0.000007 | 0.00001 | 0.000006 | 0.00001 | 0.00001 | 0.00002 | 0.000008 |
| 238 U | 0.00009 | 0.0002 | 0.0001 | 0.0002 | 0.0002 | 0.0004 | 0.0001 |
Table 21. Radioactivity in milk from farms near Sellafield, 2022
Mean concentration (Bq l-1)
| Location | Total α | Total β | 3 H | 14 C (a) | 14 C (b) | 90 Sr | 129 I | 13 1I | 137 Cs | |
|---|---|---|---|---|---|---|---|---|---|---|
| Farm A | <0.19 | 41 | 2.3 | 14 | <0.55 | 0.02 | <0.01 | <0.04 | 0.06 | |
| Farm B (c) | <0.14 | 43 | <2.2 | 15 | <0.58 | 0.02 | <0.01 | <0.04 | <0.04 | |
| Farm C | <0.18 | 40 | <2.4 | 18 | <0.73 | 0.03 | <0.01 | <0.04 | 0.07 |
a. Including natural background.
b. Excluding natural background.
c, Milk from Farm B has been used in the radiological assessment.
Table 22. Radioactivity in potatoes and rabbits from farms near Sellafield, 2022
Mean concentration (Bq kg-1)
| Sample | 3 H | 14 C(a) | 14 C(b) | 137 Cs |
|---|---|---|---|---|
| Potatoes - Early | 7.7 | 14 | <0.60 | 0.15 |
| Potatoes - Late | 6.5 | 14 | <0.50 | 0.15 |
| Potatoes - Average | 7.1 | 14 | <0.55 | 0.15 |
| Rabbit | - | - | - | 3.6 |
a. Including natural background.
b. Excluding natural background.
Table 23. Radioactivity in total deposition, 2022
Mean radionuclide concentration (Bq m-3)
| Location | Total α | Total β | 3 H | 90 Sr | 137 Cs | Pu- α | 241 Am |
|---|---|---|---|---|---|---|---|
| Calder Gate | 20 | <160 | <4,700 | 4.2 | 13 | 0.44 | 0.31 |
| Met Station | 26 | 300 | 4,100 | 30 | 95 | 1.1 | 1.5 |
| North Gate | 32 | 1,900 (a) | 6,300 | 1,200 (c) | 1,000 (b) | 0.22 | 0.94 |
| South Side | 22 | 150 | 4,200 | 2.7 | <6.0 | 0.23 | 1.1 |
| West Ring Road | 26 | 190 | <4,300 | 14 | 16 | 0.68 | 1.6 |
a. Total Beta is measured Monthly, the elevated Total Beta corresponds with high beta results from the inlet filter event during August – October.
b. 137 Cs is measured quarterly, elevated 137 Cs is likely to correspond with elevated results from the inlet filter event.
c. 90 Sr is measured annually, elevated 90 Sr is likely to correspond to the inlet filter event
Table 24. Radioactivity in grass, 2022
Mean concentration (Bq kg-1 {wet weight})
| Location | Total α | Total β | 3 H | 14C (a) | 14C (b) | 90 Sr | 99 Tc | 106 Ru | 125 Sb | 134 Cs | 137 Cs | U- α | Pu- α | 241 Am |
|---|---|---|---|---|---|---|---|---|---|---|---|---|---|---|
| Calder Gate | 4.0 | 96 | 6.3 | 28 | 1.2 | 2.2 | - | - | 0.52 | - | 4.4 | 0.23 | 0.17 | 0.21 |
| Met Station | 7.1 | 110 | 8.1 | 23 | <0.90 | 8.4 | - | - | - | - | 8.7 | 0.14 | 0.27 | 0.14 |
| North Gate | 4.5 | 150 | 12 | 28 | 1.1 | 23 | - | - | - | - | 42 | 0.20 | 0.40 | 0.26 |
| South Side | 5.2 | 120 | 4.3 | 22 | <0.83 | 0.72 | - | - | - | - | 0.97 | 0.29 | 0.06 | 0.09 |
| West Ring Rd | 2.2 | 95 | <5.9 | 21 | <0.83 | 1.2 | - | - | - | - | 2.4 | 0.22 | 0.19 | 0.20 |
a. 14 C data includes background.
b. Excluding natural background calculated assuming 218 Bq natural 14C per kg carbon.
Table 25. Radioactivity in soil, 2022
Mean concentration (Bq kg-1 {wet weight})
| Location | Total α | Total β | 3 H | 14 Ca | 14 Cb | 90 Sr | 106 Ru | 125 Sb | 134 Cs | 137 Cs | U- α | Pu- α | 241 Am |
|---|---|---|---|---|---|---|---|---|---|---|---|---|---|
| Calder Gate | 840 | 630 | <3.5 | 5.5 | 1.5 | 3.0 | - | - | - | 60 | 58 | 29 | 17 |
| Met Station | 720 | 590 | 4.5 | 5.8 | 0.71 | 13 | - | - | - | 200 | 65 | 86 | 45 |
| North Gate | 810 | 690 | 4.3 | 5.0 | 1.4 | 21 | - | - | - | 190 | 63 | 130 | 31 |
| South Side | 720 | 910 | 2.8 | 11 | <0.50 | 1.8 | - | - | - | 47 | 73 | 13 | 6.3 |
| West Ring Road | 680 | 680 | 2.0 | 5.2 | <0.20 | 4.6 | - | - | - | 68 | 84 | 44 | 32 |
a. 14 C data includes background.
b. Excluding natural background calculated assuming 218 Bq natural 14 C per kg carbon.
Table 26. Radioactivity in local waters, 2022
Mean concentration (Bq l-1)
| Location | Total α | Total β | 3 H | 90 Sr | 99 Tc | 137 Cs | Pu (α) | Am+Cm |
|---|---|---|---|---|---|---|---|---|
| River water: R. Calder at Sellafield | <0.01 | 0.27 | <4.5 | 0.10 | <0.03 | <0.005 | <0.001 | - |
| River water: R. Calder at Calderbridge | <0.01 | <0.10 | <4.0 | 0.003 | <0.03 | <0.005 | <0.001 | - |
| River water: R. Ehen, 5m upstream of Factory Sewer outfall | <0.02 | 0.21 | 4.5 | 0.004 | 0.03 | <0.006 | <0.001 | - |
| River water: R. Ehen, 100m north of pipeline | <0.01 | 0.11 | <4.6 | 0.003 | <0.03 | <0.005 | <0.001 | - |
| Lake water: Ennerdale Water | <0.01 | <0.12 | <4.9 | 0.002 | - | <0.005 | <0.002 | - |
| Tap water: Calderbridge | <0.02 | <0.09 | <3.6 | 0.001 | - | <0.005 | - | - |
| Tap water : Sellafield | <0.01 | <0.08 | <3.7 | 0.001 | - | <0.005 | - | - |
| Tap water: Ravenglass | <0.01 | <0.08 | <4.6 | 0.001 | - | <0.005 | - | - |
| Tap water: Seascale | 0.01 | <0.08 | <3.6 | 0.001 | - | <0.005 | - | - |
| Tap water: Whitehaven | <0.02 | <0.08 | <4.7 | 0.001 | - | <0.006 | - | - |
| Spring water: Sellafield Beach (South) a | - | - | 73 | 1.0 | 2.1 | 0.64 | 0.04 | 0.15 |
| Spring water: Sellafield Beach (Maximum) a | - | - | 520 | 1.0 | 5.6 | 0.64 | 0.04 | 0.15 |
| Spring water: Sellafield Beach (Average)a | - | - | 160 | 1.0 | 2.0 | 0.64 | 0.04 | 0.15 |
a. Results corrected for seawater content.
Table 27. Non-radioactive monitoring of nitrogen dioxide in air in the vicinity of Sellafield, 2022
| Location | Mean concentration (µg m-3) |
|---|---|
| Calder Gate | 6.7 |
| Met. Station | 5.9 |
| North Gate | 6.2 |
| West Ring Road | 7.4 |
| South Side | 5.9 |
| Air Quality Limit Value (annual mean) | 40 |
Table 28. Non-radioactive monitoring of nitrate in river waters, 2022
| Location | pH | Mean concentration (mg l-1) |
|---|---|---|
| River Calder - downstream of site | 7.8 | 0.65 |
| River Calder - upstream of site | 7.6 | 0.62 |
| River Ehen - upstream of Seaburn outfall | 7.9 | 1.0 |
| River Ehen - upstream of pipebridge | 7.8 | 1.0 |
| National Environmental Quality Standard | 6.0 - 9.0 | N/A |
Table 29. Non-radioactive monitoring of coastal waters, 2022
| Location | Mean concentration (mg l-1) nitrate | Mean concentration (mg l-1) nitrate |
|---|---|---|
| St Bees | <0.007 | 0.25 |
| Sellafield | <0.007 | 0.15 |
| Seascale Neb | <0.007 | 0.13 |
| Drigg Barnscar | <0.007 | 0.09 |
Table 30. Non-radioactive monitoring of surface water around Calder Landfill Extension Segregated Area, 2022
| Location | BOD (mg l-1) | COD (mg l-1) | TOC (mg l-1) | Dissolved O2 (ppm) | NH4+ (mg l-1) | SO42- (mg l-1) | Conductivity (µS cm-1) |
|---|---|---|---|---|---|---|---|
| River Calder upstream | <1.0 | 4.4 | 2.0 | 11 | <0.01 | 3.9 | 92 |
| New Mill Beck upstream | <1.0 | 27 | 7.7 | 10 | 0.26 | 10 | 220 |
| New Mill Beck overflow drain (a) | <1.2 | 49 | 17 | 9.8 | 0.36 | 12 | 220 |
| River Calder downstream | <1.0 | <5.1 | 1.9 | 11 | 0.02 | 4.6 | 110 |
a. Sample only available under flood conditions.
BOD – Biological Oxygen Demand COD – Chemical Oxygen Demand TOC – Total Organic Carbon
Table 31. Non-radioactive monitoring of gases on Sellafield’s landfill sites, 2022
| Gas spike probe monitoring | Mean concentration (% volume) CH4 | Mean concentration (% volume) CO2 | Mean concentration (% volume) O2 |
|---|---|---|---|
| Calder Landfill Complex Boreholes | 0.09 | 1.4 | 19 |
| Calder Landfill Complex Probes | 0.04 | 1.0 | 20 |
8.3 Beach Monitoring Data
Table 32. Beach monitoring conducted during 2022
| Programme | Planned monitoring (ha) | Actual monitoring (ha) |
|---|---|---|
| Sellafield | 52 | 55 |
| Northern Beaches | 32 | 35 |
| Southern Beaches | 16 | 22 |
| Allonby | 5 | 5 |
| Total | 105 | 117 |
Table 33. Particle and larger object beach finds recovered during 2022
| Programme | No. of particles found Alpha rich | No. of particles found beta rich | No. of particles found other | No. of larger objects found alpha rich | No. of larger objects found beta rich | No. of larger objects found other | Total finds |
|---|---|---|---|---|---|---|---|
| Sellafield | 30 | 2 | 1 | 0 | 7 | 0 | 40 |
| Northern Beaches | 11 | 0 | 0 | 0 | 0 | 0 | 11 |
| Southern Beaches | 5 | 0 | 0 | 0 | 0 | 0 | 5 |
| Allonby | 0 | 0 | 0 | 0 | 0 | 0 | 0 |
| Total | 46 | 2 | 1 | 0 | 7 | 0 | 56 |
Particles are less than 2 mm in size; Larger objects are greater than 2 mm in size; “Alpha rich”, higher americium-241 activity than caesium-137 activity; “Beta rich”, where caesium-137 was the major radionuclide; “other” denotes the principal radionuclide is neither americium-241 activity or caesium-137, for example cobalt-60
Table 34. Total area monitored and finds by category, beach and calendar year (2018 - 2022)
| Beach | Year | Area (ha) | Alpha rich particle | Beta rich particle | Beta rich larger object | Other finds |
|---|---|---|---|---|---|---|
| Sellafield | 2018 | 81 | 88 | 6 | 17 | 0 |
| 2019 | 81 | 74 | 5 | 6 | 0 | |
| 2020 | 58 | 48 | 4 | 2 | 0 | |
| 2021 | 57 | 24 | 1 | 4 | 0 | |
| 2022 | 55 | 30 | 2 | 7 | 1 | |
| Northern Beaches | 2018 | 44 | 22 | 1 | 0 | 0 |
| 2019 | 42 | 31 | 0 | 0 | 0 | |
| 2020 | 30 | 19 | 0 | 0 | 0 | |
| 2021 | 36 | 68 | 0 | 0 | 0 | |
| 2022 | 35 | 11 | 0 | 0 | 0 | |
| Southern Beaches | 2018 | 25 | 10 | 0 | 0 | 0 |
| 2019 | 25 | 2 | 0 | 0 | 0 | |
| 2020 | 19 | 1 | 0 | 0 | 0 | |
| 2021 | 24 | 1 | 0 | 0 | 0 | |
| 2022 | 22 | 5 | 0 | 0 | 0 | |
| Allonby | 2018 | 10 | 1 | 0 | 0 | 0 |
| 2019 | 10 | 1 | 0 | 0 | 0 | |
| 2020 | 6 | 0 | 0 | 0 | 0 | |
| 2021 | 5 | 0 | 0 | 0 | 0 | |
| 2022 | 5 | 0 | 0 | 0 | 0 |
Figure 4. Radioactivity of finds classified as alpha-rich particles (upper) and beta rich particles (lower) between 2014 – 2021 (shown in blue) compared to data from 2022 shown in red)
RIFE data used in the Radiological Dose Assessment
Table 35. Radioactivity in animal produce from farms near Sellafield, 2021 (data From RIFE27)
Mean concentration (Bq kg-1 {wet weight}) (a)
| Species | 3H (b) | 14C (b) | 14C(c) | 60Co | 90Sr | 99Tc | 106Ru | 125Sb | 129I | 134Cs | 137Cs | 238Pu | 239+240Pu | 241Pu | 241Am |
|---|---|---|---|---|---|---|---|---|---|---|---|---|---|---|---|
| Bovine muscle | <2.7 | 46 | 9.0 | <0.05 | <0.05 | <0.05 | <0.41 | <0.10 | <0.02 | <0.05 | 0.41 | 0.00004 | 0.0001 | <0.34 | 0.0002 |
| Bovine liver | <3.6 | 29 | 3.0 | <0.05 | <0.04 | <0.05 | <0.37 | <0.10 | <0.03 | <0.05 | 0.23 | 0.0003 | 0.002 | <0.19 | 0.003 |
| Bovine kidney | <3.7 | 33 | 7.0 | <0.04 | <0.10 | <0.04 | <0.43 | <0.14 | <0.03 | <0.05 | 0.34 | <0.0003 | 0.0002 | <1.5 | 0.001 |
| Ovine muscle | <5.5 | 41 | - | <0.05 | <0.04 | <0.04 | <0.41 | <0.10 | <0.03 | <0.04 | 1.0 | <0.00006 | 0.0002 | <0.38 | 0.0003 |
| Ovine kidney/ liver | <13 | 48 | 22 | <0.05 | 0.06 | <0.04 | <0.34 | <0.09 | <0.02 | <0.04 | 0.31 | 0.0003 | 0.003 | <0.42 | 0.003 |
| Deer | <3.4 | 26 | - | <0.04 | <0.05 | <0.08 | <0.29 | <0.08 | <0.03 | <0.04 | 0.41 | <0.0001 | 0.00007 | <0.35 | 0.0002 |
| Duck | <4.9 | 41 | - | <0.04 | <0.04 | - | <0.34 | <0.10 | <0.02 | <0.06 | 0.10 | <0.00007 | 0.0001 | <0.42 | 0.0002 |
| Pheasant | <6.4 | 46 | 14 | <0.06 | <0.04 | <0.05 | <0.46 | <0.17 | <0.04 | <0.08 | 0.15 | 0.00004 | 0.00006 | <0.68 | 0.0002 |
| Wild wood pigeon | <6.8 | 46 | 14 | <0.07 | <0.04 | - | <0.55 | <0.13 | <0.03 | <0.06 | 0.44 | 0.00003 | 0.0001 | <0.34 | 0.00005 |
| Rabbit | <3.5 | 24 | - | <0.04 | 0.04 | <0.08 | <0.30 | <0.09 | <0.03 | <0.02 | 0.07 | <0.00007 | <0.0001 | <0.25 | 0.00004 |
| Eggs - Chicken | <5.7 | 37 | 5.0 | <0.04 | <0.03 | - | <0.37 | <0.10 | <0.04 | <0.03 | <0.04 | <0.0001 | <0.0001 | <0.59 | 0.00007 |
a. Values shown in pale blue boxes are from measurements performed by the FSA.
b. Including natural background.
c. Excluding natural background (values taken from RIFE). Measured concentrations that are smaller than background value are indicated by a hyphen.
Table 36. Radioactivity in fruit and vegetable produce collected near Sellafield, 2022 (Data From RIFE27)
Mean concentration (Bq kg-1 {wet weight})a
| Species | 3H(b) | 14C(b) | 14C(c) | 60Co | 90Sr | 99Tc | 106Ru | 125Sb | 129I | 134Cs | 137Cs | 238Pu | 239+240Pu | 241Pu | 241Am |
|---|---|---|---|---|---|---|---|---|---|---|---|---|---|---|---|
| Potato | - | - | - | <0.07 | <0.04 | - | <0.12 | <0.03 | <0.06 | 0.0001 | 0.001 | - | 0.002 | ||
| Cabbage | <2.0 | 5.8 | - | <0.06 | 0.04 | - | <0.43 | <0.12 | <0.03 | <0.03 | <0.05 | <0.00008 | 0.00008 | - | 0.0001 |
| Broccoli | <2.6 | 17 | 10.0 | <0.07 | <0.06 | - | <0.55 | <0.09 | <0.02 | <0.07 | <0.06 | <0.0001 | <0.0002 | - | 0.0001 |
| Cauliflower (d) | <2.1 | 9.2 | 2.2 | <0.10 | - | - | <0.68 | <0.16 | <0.04 | <0.07 | <0.07 | - | - | - | - |
| Carrots | <2.0 | 11 | 4.3 | <0.07 | 0.02 | - | <0.54 | <0.14 | <0.03 | <0.08 | 0.08 | - | - | - | - |
| Beetroot | <2.1 | 3.0 | - | <0.03 | 0.06 | <0.05 | <0.25 | <0.07 | <0.02 | <0.04 | 0.11 | - | - | - | - |
| Onion | - | 14 | 7.0 | <0.06 | 0.20 | - | <0.29 | <0.10 | <0.04 | <0.05 | 0.07 | - | - | - | - |
| Runner beans (d) | <2.0 | 17 | - | <0.06 | 0.33 | - | <0.52 | <0.11 | <0.06 | <0.06 | <0.06 | <0.0001 | 0.0003 | - | 0.0007 |
| Mushroom | <2.1 | 8.5 | 4.5 | <0.03 | 0.02 | - | <0.26 | <0.07 | <0.03 | <0.03 | 4.3 | 0.005 | 0.04 | 0.20 | 0.06 |
| Apple | <2.5 | 16 | 8.1 | <0.02 | 0.10 | <0.05 | <0.21 | <0.05 | <0.03 | <0.04 | 0.35 | <0.00009 | 0.0002 | - | 0.0003 |
| Blackcurrants (d) | <4.0 | 17 | 9.0 | <0.20 | 0.08 | - | <1.2 | <0.30 | <0.02 | - | 0.11 | 0.0002 | 0.0005 | - | 0.002 |
| Strawberries (d) | <2.0 | 15 | 7.0 | <0.06 | 0.14 | - | <0.64 | <0.16 | <0.05 | <0.07 | <0.06 | <0.0001 | <0.0003 | - | <0.0002 |
| Blackberries | <2.0 | 17 | 9.0 | <0.02 | 0.09 | - | <0.21 | <0.06 | <0.03 | <0.02 | <0.04 | <0.0001 | 0.0002 | - | 0.0003 |
| Elderberries (d) | <2.0 | 26 | 18.0 | <0.11 | 0.04 | - | <0.52 | <0.18 | <0.08 | <0.08 | 0.14 | 0.001 | 0.004 | - | 0.008 |
| Honey (d) | - | 78 | 11.0 | <0.02 | <0.04 | - | <0.31 | <0.08 | <0.02 | <0.03 | <0.06 | <0.0002 | <0.0002 | - | 0.0001 |
| Swede(d) | - | 5.4 | - | <0.06 | 0.05 | - | <0.47 | <0.13 | <0.02 | <0.06 | <0.06 | - | - | - | - |
a. Values shown in pale blue boxes are from measurements performed by the FSA.
b. Including natural background.
c. Excluding natural background (values taken from RIFE). Measured concentrations that are smaller than background value are indicated by a hyphen.
d. Year sampled - cauliflower (2013); runner beans (2013); blackcurrants (2012); strawberries (2013); elderberries (2013); honey (2014); swede (2017)
Radiological Dose Assessment Data Tables
The radiological dose assessment presented herein takes account of research studies carried out both nationally and internationally.
In addition, the guidance of the UK Health Security Agency, the National Dose Assessment Working Group and the most recent dose coefficients in the International Commission for Radiological Protection (ICRP) publication 119 are adopted where available and appropriate.
In general, default values recommended by the ICRP for each radionuclide are assumed for the purpose of dose calculations unless specific studies indicate that an alternative is appropriate.
Table 37. Summary of doses associated with seafood (µSv), 2022
| Radionuclide | Cod adult | Cod child | Cod infant | Cod foetus | Plaice adult | Plaice child | Plaice infant | Plaice foetus | Lobsters adult | Lobsters child | Lobsters infant | Lobsters foetus | Crabs adult | Crabs child | Crabs infant | Crabs foetus |
|---|---|---|---|---|---|---|---|---|---|---|---|---|---|---|---|---|
| Carbon-14 (a) | 0.11 | 0.03 | 0.01 | 0.15 | 0.29 | 0.08 | 0.04 | 0.41 | 0.20 | 0.06 | 0.03 | 0.28 | 0.24 | 0.07 | 0.03 | 0.33 |
| Cobalt-60 | - | - | - | - | - | - | - | - | - | - | - | - | 0.007 | 0.004 | 0.003 | 0.004 |
| Strontium-90 | - | - | - | - | - | - | - | - | - | - | - | - | 0.02 | 0.01 | 0.004 | 0.04 |
| Technetium-99 | 0.003 | 0.001 | 0.001 | 0.002 | 0.03 | 0.01 | 0.01 | 0.02 | 0.30 | 0.12 | 0.11 | 0.22 | 0.03 | 0.01 | 0.01 | 0.02 |
| Ruthenium-106 | - | - | - | - | - | - | - | - | - | - | - | - | - | - | - | - |
| Iodine-129 | - | - | - | - | - | - | - | - | 0.28 | 0.10 | 0.03 | 0.11 | - | - | - | - |
| Caesium-137 | 0.54 | 0.08 | 0.02 | 0.24 | 0.34 | 0.05 | 0.02 | 0.15 | 0.10 | 0.01 | 0.004 | 0.04 | 0.06 | 0.009 | 0.003 | 0.02 |
| Neptunium-237 | - | - | - | - | - | - | - | - | - | - | - | - | - | - | - | - |
| Plutonium-alpha | 0.01 | 0.003 | 0.001 | 0.0005 | 0.05 | 0.01 | 0.004 | 0.002 | 0.34 | 0.07 | 0.03 | 0.01 | 0.46 | 0.10 | 0.04 | 0.02 |
| Plutonium-241 | - | - | - | - | - | - | - | - | - | - | - | - | - | - | - | - |
| Americium-241 | 0.01 | 0.003 | 0.001 | 0.0002 | 0.04 | 0.008 | 0.003 | 0.0005 | 1.5 | 0.34 | 0.14 | 0.02 | 1.5 | 0.33 | 0.14 | 0.02 |
| Curium-alpha | - | - | - | - | - | - | - | - | - | - | - | - | - | - | - | - |
| Total | 0.68 | 0.12 | 0.04 | 0.39 | 0.75 | 0.16 | 0.07 | 0.58 | 2.8 | 0.70 | 0.34 | 0.68 | 2.3 | 0.53 | 0.23 | 0.46 |
| Radionuclide | Nephrops adult | Nepthrops child | Nepthrops infant | Nepthrops foetus | Winkles adult | Winkles child | Winkles infant | Winkles foetus | Mussels adult | Mussels child | Mussels infant | Mussels foetus | Total adult | Total child | Total infant | Total Foetus |
|---|---|---|---|---|---|---|---|---|---|---|---|---|---|---|---|---|
| Carbon-14 (a) | 0.09 | 0.02 | 0.01 | 0.12 | 0.13 | 0.04 | 0.02 | 0.18 | 0.10 | 0.03 | 0.01 | 0.14 | 1.2 | 0.33 | 0.15 | 1.6 |
| Cobalt-60 | - | - | - | - | 0.009 | 0.006 | 0.004 | 0.005 | 0.004 | 0.003 | 0.002 | 0.002 | 0.02 | 0.01 | 0.009 | 0.01 |
| Strontium-90 | 0.01 | 0.005 | 0.002 | 0.02 | 0.17 | 0.07 | 0.03 | 0.26 | 0.03 | 0.01 | 0.005 | 0.05 | 0.23 | 0.10 | 0.04 | 0.37 |
| Technetium-99 | 0.07 | 0.03 | 0.03 | 0.05 | 0.12 | 0.05 | 0.05 | 0.09 | 0.04 | 0.01 | 0.01 | 0.03 | 0.59 | 0.23 | 0.22 | 0.43 |
| Ruthenium-106 | - | - | - | - | 0.04 | 0.02 | 0.01 | 0.002 | 0.03 | 0.01 | 0.009 | 0.001 | 0.07 | 0.03 | 0.02 | 0.003 |
| Iodine-129 | 0.13 | 0.05 | 0.01 | 0.05 | 0.10 | 0.03 | 0.01 | 0.04 | - | - | - | - | 0.51 | 0.18 | 0.05 | 0.20 |
| Caesium-137 | 0.07 | 0.01 | 0.003 | 0.03 | 0.25 | 0.04 | 0.01 | 0.11 | 0.05 | 0.008 | 0.003 | 0.02 | 1.4 | 0.21 | 0.06 | 0.61 |
| Neptunium-237 | - | - | - | - | 0.006 | 0.001 | 0.0006 | 0.0002 | - | - | - | - | 0.006 | 0.001 | 0.0006 | 0.0002 |
| Plutonium-alpha | 0.70 | 0.15 | 0.06 | 0.03 | 4.2 | 0.91 | 0.35 | 0.16 | 2.8 | 0.61 | 0.24 | 0.11 | 8.6 | 1.9 | 0.73 | 0.33 |
| Plutonium-241 | - | - | - | - | 0.26 | 0.06 | 0.02 | 0.006 | 0.18 | 0.04 | 0.01 | 0.004 | 0.44 | 0.10 | 0.03 | 0.01 |
| Americium-241 | 2.0 | 0.44 | 0.19 | 0.03 | 5.8 | 1.3 | 0.53 | 0.08 | 4.2 | 0.92 | 0.39 | 0.06 | 15 | 3.3 | 1.4 | 0.21 |
| Curium-alpha | - | - | - | - | 0.05 | 0.01 | 0.006 | 0.05 | - | - | - | - | 0.05 | 0.01 | 0.006 | 0.05 |
| Total | 3.1 | 0.71 | 0.30 | 0.33 | 11 | 2.5 | 1.0 | 0.98 | 7.4 | 1.6 | 0.68 | 0.41 | 28 | 6.3 | 2.7 | 3.8 |
Background corrected values for carbon-14 in fish, molluscs and crustaceans have been used in the assessment of radiation doses to critical groups.
For these marine foodstuffs, the natural concentration of carbon-14 of 218 Bq carbon-14 per kg carbon has been taken from data published by the Environment Agency and the Food Standards Agency.
Table 38. Summary of doses to terrestrial critical group from terrestrial foodstuffs and inhalation (µSv), 2022
| Radionuclide | Milk adult (not shaded) | Milk child (not shaded) | Milk infant (not shaded) | Milk foetus (not shaded) | Beef muscle adult | Beef muscle child | Beef muscle infant | Beef muscle foetus | Beef offal adult | Beef offal child | Beef offal infant | Beef offal foetus | Sheep muscle adult | Sheep muscle child | Sheep muscle infant | Sheep muscle foetus |
|---|---|---|---|---|---|---|---|---|---|---|---|---|---|---|---|---|
| Total tritium | 0.01 | 0.02 | 0.04 | 0.01 | 0.002 | 0.002 | <0.001 | 0.003 | <0.001 | <0.001 | <0.001 | <0.001 | 0.002 | 0.001 | <0.001 | 0.003 |
| Carbon-14 (a) | 0.04 | 0.06 | 0.15 | 0.06 | 0.08 | 0.11 | 0.04 | 0.11 | 0.008 | 0.006 | 0.004 | 0.01 | - | - | - | - |
| Cobalt-60 | - | - | - | - | 0.003 | 0.008 | 0.004 | 0.001 | <0.001 | <0.001 | <0.001 | <0.001 | 0.001 | 0.002 | 0.001 | <0.001 |
| Strontium-90 | 0.09 | 0.22 | 0.36 | 0.13 | 0.02 | 0.05 | 0.01 | 0.03 | 0.006 | 0.007 | 0.003 | 0.009 | 0.01 | 0.01 | 0.003 | 0.01 |
| Technetium-99 | - | - | - | - | <0.001 | <0.001 | <0.001 | <0.001 | <0.001 | <0.001 | <0.001 | <0.001 | <0.001 | <0.001 | <0.001 | <0.001 |
| Ruthenium-106 (b) | <0.001 | <0.001 | <0.001 | <0.001 | <0.001 | <0.001 | <0.001 | <0.001 | <0.001 | <0.001 | <0.001 | <0.001 | <0.001 | <0.001 | <0.001 | <0.001 |
| Antimony-125 | - | - | - | - | 0.002 | 0.003 | 0.002 | <0.001 | <0.001 | <0.001 | <0.001 | <0.001 | <0.001 | <0.001 | <0.001 | <0.001 |
| Iodine-129 | 0.10 | 0.21 | 0.29 | 0.04 | 0.03 | 0.06 | 0.01 | 0.01 | 0.009 | 0.009 | 0.003 | 0.004 | 0.03 | 0.02 | 0.005 | 0.01 |
| Iodine-131 | - | - | - | - | - | - | - | - | - | - | - | - | - | - | - | - |
| Caesium-134 | - | - | - | - | 0.01 | 0.01 | 0.002 | 0.007 | 0.003 | 0.001 | <0.001 | 0.001 | 0.006 | 0.002 | <0.001 | 0.003 |
| Caesium-137 | 0.09 | 0.08 | 0.11 | 0.04 | 0.08 | 0.06 | 0.01 | 0.04 | 0.01 | 0.004 | 0.002 | 0.004 | 0.10 | 0.04 | 0.01 | 0.05 |
| Plutonium-alpha | - | - | - | - | <0.001 | <0.001 | <0.001 | <0.001 | <0.001 | <0.001 | <0.001 | <0.001 | <0.001 | <0.001 | <0.001 | <0.001 |
| Plutonium-241 | - | - | - | - | - | - | - | - | - | - | - | - | - | - | - | - |
| Americium-241 | - | - | - | - | <0.001 | <0.001 | <0.001 | <0.001 | 0.001 | <0.001 | <0.001 | <0.001 | <0.001 | <0.001 | <0.001 | <0.001 |
| Total | 0.33 | 0.59 | 0.95 | 0.28 | 0.23 | 0.31 | 0.08 | 0.21 | 0.04 | 0.03 | 0.02 | 0.04 | 0.15 | 0.08 | 0.03 | 0.08 |
| Radionuclide | Sheep offal adult | Sheep offal child | Sheep offal infant | Sheep offal foetus | Poultry adult | Poultry child | Poultry infant | Poultry foetus | Eggs adult | Eggs child | Eggs infant | Eggs foetus | Game adult | Game child | Game infant | Game foetus |
|---|---|---|---|---|---|---|---|---|---|---|---|---|---|---|---|---|
| Total tritium | 0.002 | 0.001 | <0.001 | 0.002 | 0.002 | 0.002 | 0.001 | 0.003 | 0.002 | 0.002 | 0.003 | 0.003 | 0.001 | 0.001 | <0.001 | 0.002 |
| Carbon-14 (a) | 0.04 | 0.03 | 0.02 | 0.05 | - | - | - | - | 0.02 | 0.03 | 0.04 | 0.03 | 0.02 | 0.01 | 0.006 | 0.02 |
| Cobalt-60 | <0.001 | <0.001 | <0.001 | <0.001 | 0.001 | 0.002 | 0.002 | <0.001 | 0.001 | 0.003 | 0.005 | <0.001 | <0.001 | 0.002 | 0.001 | <0.001 |
| Strontium-90 | 0.005 | 0.006 | 0.003 | 0.008 | 0.01 | 0.01 | 0.007 | 0.02 | 0.008 | 0.01 | 0.01 | 0.01 | 0.008 | 0.01 | 0.003 | 0.01 |
| Technetium-99 | <0.001 | <0.001 | <0.001 | <0.001 | - | - | - | - | - | - | - | - | <0.001 | <0.001 | <0.001 | <0.001 |
| Ruthenium-106 (b) | <0.001 | <0.001 | <0.001 | <0.001 | <0.001 | <0.001 | <0.001 | <0.001 | <0.001 | <0.001 | <0.001 | <0.001 | <0.001 | <0.001 | <0.001 | <0.001 |
| Antimony-125 | <0.001 | <0.001 | <0.001 | <0.001 | 0.001 | 0.001 | 0.001 | <0.001 | <0.001 | 0.001 | 0.003 | <0.001 | <0.001 | <0.001 | <0.001 | <0.001 |
| Iodine-129 | 0.006 | 0.006 | 0.002 | 0.002 | 0.02 | 0.02 | 0.009 | 0.009 | 0.04 | 0.05 | 0.04 | 0.01 | 0.02 | 0.03 | 0.006 | 0.009 |
| Iodine-131 | - | - | - | - | - | - | - | - | - | - | - | - | - | - | - | - |
| Caesium-134 | 0.002 | <0.001 | <0.001 | <0.001 | 0.01 | 0.005 | 0.002 | 0.005 | 0.005 | 0.003 | 0.002 | 0.002 | 0.005 | 0.003 | <0.001 | 0.002 |
| Caesium-137 | 0.01 | 0.005 | 0.002 | 0.005 | 0.01 | 0.006 | 0.002 | 0.006 | 0.004 | 0.003 | 0.002 | 0.002 | 0.02 | 0.008 | 0.002 | 0.007 |
| Plutonium-alpha | 0.002 | 0.001 | <0.001 | <0.001 | <0.001 | <0.001 | <0.001 | <0.001 | <0.001 | <0.001 | <0.001 | <0.001 | <0.001 | <0.001 | <0.001 | <0.001 |
| Plutonium-241 | - | - | - | - | - | - | - | - | - | - | - | - | - | - | - | - |
| Americium-241 | 0.002 | <0.001 | <0.001 | <0.001 | <0.001 | <0.001 | <0.001 | <0.001 | <0.001 | <0.001 | <0.001 | <0.001 | <0.001 | <0.001 | <0.001 | <0.001 |
| Total | 0.07 | 0.06 | 0.04 | 0.07 | 0.06 | 0.05 | 0.03 | 0.05 | 0.08 | 0.11 | 0.11 | 0.06 | 0.08 | 0.07 | 0.03 | 0.06 |
| Radionuclide | Honey adult | Honey child | Honey infant | Honey foetus | Mushroom adult | Mushroom child | Mushroom infant | Mushroom foetus | Potato adult | Potato child (not shaded) | Potato infant (not shaded) | Potato foetus (not shaded) | Root veg. adult | Root veg. child | Root veg. infant | Root veg. foetus |
|---|---|---|---|---|---|---|---|---|---|---|---|---|---|---|---|---|
| Total tritium | - | - | - | - | <0.001 | <0.001 | <0.001 | <0.001 | 0.04 | 0.03 | 0.03 | 0.05 | <0.001 | <0.001 | 0.001 | 0.001 |
| Carbon-14 (a) | 0.02 | 0.02 | 0.04 | 0.02 | 0.008 | 0.005 | 0.004 | 0.01 | 0.04 | 0.04 | 0.03 | 0.05 | 0.02 | 0.02 | 0.03 | 0.03 |
| Cobalt-60 | <0.001 | <0.001 | 0.001 | <0.001 | <0.001 | <0.001 | <0.001 | <0.001 | 0.03 | 0.07 | 0.07 | 0.02 | 0.002 | 0.004 | 0.007 | 0.001 |
| Strontium-90 | 0.003 | 0.005 | 0.007 | 0.005 | 0.002 | 0.002 | 0.001 | 0.003 | 0.15 | 0.22 | 0.13 | 0.22 | 0.03 | 0.04 | 0.04 | 0.04 |
| Technetium-99 | - | - | - | - | - | - | - | - | - | - | - | - | <0.001 | <0.001 | 0.001 | <0.001 |
| Ruthenium-106 (b) | <0.001 | <0.001 | <0.001 | <0.001 | <0.001 | <0.001 | <0.001 | <0.001 | <0.001 | <0.001 | <0.001 | <0.001 | <0.001 | <0.001 | <0.001 | <0.001 |
| Antimony-125 | <0.001 | <0.001 | <0.001 | <0.001 | <0.001 | <0.001 | <0.001 | <0.001 | 0.02 | 0.02 | 0.03 | 0.007 | 0.001 | 0.001 | 0.003 | <0.001 |
| Iodine-129 | 0.006 | 0.008 | 0.009 | 0.002 | 0.01 | 0.009 | 0.004 | 0.004 | 0.40 | 0.48 | 0.23 | 0.16 | 0.03 | 0.03 | 0.03 | 0.01 |
| Iodine-131 | - | - | - | - | - | - | - | - | - | - | - | - | - | - | - | - |
| Caesium-134 | 0.001 | <0.001 | <0.001 | <0.001 | 0.002 | <0.001 | <0.001 | <0.001 | 0.14 | 0.07 | 0.03 | 0.06 | 0.01 | 0.005 | 0.005 | 0.005 |
| Caesium-137 | 0.002 | 0.001 | 0.001 | <0.001 | 0.17 | 0.06 | 0.03 | 0.07 | 0.23 | 0.13 | 0.06 | 0.10 | 0.01 | 0.005 | 0.005 | 0.005 |
| Plutonium-alpha | <0.001 | <0.001 | <0.001 | <0.001 | 0.03 | 0.02 | 0.01 | 0.001 | 0.03 | 0.02 | 0.02 | 0.001 | - | - | - | - |
| Plutonium-241 | - | - | - | - | 0.003 | 0.002 | <0.001 | <0.001 | - | - | - | - | - | - | - | - |
| Americium-241 | <0.001 | <0.001 | <0.001 | <0.001 | 0.04 | 0.02 | 0.01 | <0.001 | 0.05 | 0.04 | 0.03 | <0.001 | - | - | - | - |
| Total | 0.04 | 0.04 | 0.06 | 0.03 | 0.27 | 0.12 | 0.07 | 0.10 | 1.1 | 1.1 | 0.66 | 0.67 | 0.11 | 0.11 | 0.12 | 0.10 |
| Radionuclide | Green veg. adult | Green veg. child | Green veg. infant | Green veg. foetus | Domestic Fruit adult | Domestic Fruit child | Domestic Fruit infant | Domestic Fruit foetus | Wild Fruit adult | Wild Fruit child | Wild Fruit infant | Wild Fruit foetus | Legumes adult | Legumes child | Legumes infant | Legumes foetus |
|---|---|---|---|---|---|---|---|---|---|---|---|---|---|---|---|---|
| Total tritium | 0.001 | <0.001 | <0.001 | 0.002 | 0.009 | 0.008 | 0.01 | 0.01 | <0.001 | <0.001 | <0.001 | <0.001 | 0.002 | <0.001 | <0.001 | 0.003 |
| Carbon-14 (a) | 0.04 | 0.02 | 0.02 | 0.05 | 0.35 | 0.32 | 0.45 | 0.48 | 0.05 | 0.03 | 0.02 | 0.08 | - | - | - | - |
| Cobalt-60 | 0.004 | 0.005 | 0.007 | 0.002 | 0.02 | 0.05 | 0.09 | 0.01 | 0.002 | 0.002 | 0.002 | <0.001 | 0.004 | 0.005 | 0.005 | 0.002 |
| Strontium-90 | 0.02 | 0.02 | 0.02 | 0.03 | 0.25 | 0.35 | 0.35 | 0.37 | 0.01 | 0.01 | 0.006 | 0.02 | 0.20 | 0.17 | 0.09 | 0.30 |
| Technetium-99 | - | - | - | - | 0.002 | 0.003 | 0.008 | 0.002 | - | - | - | - | - | - | - | - |
| Ruthenium-106 (b) | <0.001 | <0.001 | <0.001 | <0.001 | <0.001 | <0.001 | <0.001 | <0.001 | <0.001 | <0.001 | <0.001 | <0.001 | <0.001 | <0.001 | <0.001 | <0.001 |
| Antimony-125 | 0.002 | 0.002 | 0.003 | <0.001 | 0.01 | 0.02 | 0.04 | 0.006 | <0.001 | <0.001 | <0.001 | <0.001 | 0.002 | 0.002 | 0.002 | 0.001 |
| Iodine-129 | 0.05 | 0.03 | 0.02 | 0.02 | 0.28 | 0.32 | 0.26 | 0.11 | 0.04 | 0.03 | 0.01 | 0.02 | 0.13 | 0.09 | 0.04 | 0.05 |
| Iodine-131 | - | - | - | - | - | - | - | - | - | - | - | - | - | - | - | - |
| Caesium-134 | 0.02 | 0.005 | 0.003 | 0.007 | 0.08 | 0.04 | 0.03 | 0.04 | 0.007 | 0.002 | <0.001 | 0.003 | 0.02 | 0.007 | 0.003 | 0.01 |
| Caesium-137 | 0.01 | 0.004 | 0.003 | 0.005 | 0.17 | 0.09 | 0.07 | 0.07 | 0.008 | 0.003 | 0.001 | 0.004 | 0.02 | 0.005 | 0.002 | 0.007 |
| Plutonium-alpha | <0.001 | <0.001 | <0.001 | <0.001 | 0.008 | 0.006 | 0.007 | <0.001 | 0.005 | 0.002 | 0.001 | <0.001 | 0.002 | <0.001 | <0.001 | <0.001 |
| Plutonium-241 | - | - | - | - | - | - | - | - | - | - | - | - | - | - | - | - |
| Americium-241 | <0.001 | <0.001 | <0.001 | <0.001 | 0.01 | 0.009 | 0.01 | <0.001 | 0.006 | 0.003 | 0.002 | <0.001 | 0.003 | 0.001 | <0.001 | <0.001 |
| Total | 0.15 | 0.09 | 0.08 | 0.12 | 1.2 | 1.2 | 1.3 | 1.1 | 0.13 | 0.09 | 0.05 | 0.13 | 0.38 | 0.28 | 0.15 | 0.38 |
Table 38. Summary of doses to terrestrial critical group from terrestrial foodstuffs and inhalation (µSv)(a), 2022 Cont.
| Radionuclide | Drinking water adult | Drinking water child | Drinking water infant | Drinking water foetus | Inhalation adult | Inhalation child | Inhalation infant | Inhalation foetus | Total dose adult | Total dose child | Total dose infant | Total dose foetus |
|---|---|---|---|---|---|---|---|---|---|---|---|---|
| Total tritium | 0.10 | 0.08 | 0.12 | 0.14 | - | - | - | - | 0.18 | 0.15 | 0.22 | 0.25 |
| Carbon-14 (b) | - | - | - | - | - | - | - | - | 0.74 | 0.70 | 0.85 | 1.00 |
| Cobalt-60 | - | - | - | - | - | - | - | - | 0.07 | 0.16 | 0.20 | 0.05 |
| Strontium-90 | 0.03 | 0.04 | 0.04 | 0.05 | 0.001 | 0.001 | <0.001 | <0.001 | 0.84 | 1.2 | 1.1 | 1.2 |
| Technetium-99 | - | - | - | - | - | - | - | - | 0.008 | 0.009 | 0.01 | 0.008 |
| Ruthenium-106 | - | - | - | - | 0.01 | 0.009 | 0.008 | <0.001 | 0.03 | 0.03 | 0.02 | 0.02 |
| Antimony-125 | - | - | - | - | <0.001 | <0.001 | <0.001 | <0.001 | 0.05 | 0.06 | 0.09 | 0.03 |
| Iodine-129 | - | - | - | - | - | - | - | - | 1.2 | 1.4 | 0.97 | 0.47 |
| Iodine-131 | - | - | - | - | - | - | - | - | <0.001 | <0.001 | <0.001 | <0.001 |
| Caesium-134 | - | - | - | - | <0.001 | <0.001 | <0.001 | <0.001 | 0.32 | 0.16 | 0.08 | 0.15 |
| Caesium-137 | 0.04 | 0.02 | 0.02 | 0.02 | <0.001 | <0.001 | <0.001 | <0.001 | 0.99 | 0.53 | 0.33 | 0.44 |
| Plutonium-alpha | 0.13 | 0.08 | 0.09 | 0.005 | 0.18 | 0.10 | 0.05 | 0.003 | 0.33 | 0.19 | 0.12 | 0.02 |
| Plutonium-241 | - | - | - | - | 0.18 | 0.09 | 0.04 | 0.002 | 0.18 | 0.09 | 0.04 | 0.003 |
| Americium-241 | <0.001 | <0.001 | <0.001 | <0.001 | 0.15 | 0.08 | 0.05 | <0.001 | 0.29 | 0.17 | 0.11 | 0.02 |
| Total | 0.30 | 0.22 | 0.27 | 0.22 | 0.52 | 0.28 | 0.15 | 0.01 | 5.18 | 4.77 | 4.12 | 3.69 |
a. Calculated using background corrected activity concentrations (see Monitoring chapter).
b. Derived from standard modelling techniques.
Doses determined from RIFE data (Tables 35 and 36) are shaded.
Doses assessed as being less than 0.001 µSv have been presented as “<0.001”.
Foodstuff consumption rates used for 2022 are summarised later in this section. The 2 food groups assigned “high consumption rates” in 2022 were domestic fruit and potatoes.
The doses from ruthenium-106 in all terrestrial foodstuffs were assessed using standard modelling techniques.
These are based on knowledge of the transfer of these radionuclides through the food chain.
This is considered to be more realistic than using the limits of detection from the radiochemical analysis.
Table 39. Modelled concentrations of Ru-106 in terrestrial foodstuffs (Bq kg-1 or Bq l-1) in 2022
| Milk | Beef | Mutton | Liver | Green Veg. | Root Veg. | Fruit | Poultry | Eggs |
|---|---|---|---|---|---|---|---|---|
| 2.37E-07 | 1.28E-04 | 1.86E-04 | 1.86E-04 | 8.12E-04 | 7.34E-06 | 7.09E-05 | 5.91E-08 | 5.06E-08 |
Table 40. Summary of doses to the terrestrial critical group from seafood consumption (µSv) in 2022
| Radionuclide | Adult | Child | Infant | Foetus |
|---|---|---|---|---|
| Carbon-14 (a) | 0.13 | 0.03 | 0.02 | 0.17 |
| Technetium-99 | 0.01 | 0.004 | 0.004 | 0.007 |
| Caesium-137 | 0.37 | 0.06 | 0.02 | 0.16 |
| Plutonium-alpha | 0.02 | 0.005 | 0.002 | 0.0009 |
| Americium-241 | 0.02 | 0.004 | 0.002 | 0.0003 |
| Total | 0.55 | 0.11 | 0.04 | 0.35 |
a. Calculated using background corrected activity concentrations
Table 41. Summary of doses to the terrestrial critical group (µSv), 2022
| Pathway | Adult | Child | Infant | Foetus |
|---|---|---|---|---|
| Terrestrial food consumption | 4.6 | 4.5 | 4.0 | 3.7 |
| Marine food consumption | 0.55 | 0.11 | 0.04 | 0.35 |
| Inhalation | 0.60 | 0.32 | 0.17 | 0.01 |
| Immersion (krypton-85) (a) | 0.005 | 0.004 | 0.004 | 0.005 |
| External (beach) | 2.9 | 1.4 | 0.09 | 2.9 |
| Total | 8.6 | 6.4 | 4.3 | 7.0 |
a. Kr-85 doses were determined using modelling and dosimetry data published by the EU and the ICRP.
Table 42. Critical group doses from operations at Sellafield (µSv)
| Pathway | 2021 | 2022 |
|---|---|---|
| Marine critical group (adults) | ||
| seafood consumption | 24 | 28 |
| aerial pathways | 1.5 | 1.6 |
| external radiation from beach occupancy (marine) | 35 | 42 |
| Total dose to marine critical group (adults) | 60 | 72 |
| Terrestrial critical group (adults) | ||
| inhalation | 0.52 | 0.6 |
| immersion | 0.03 | 0.005 |
| external radiation from beach occupancy (terrestrial) | 2.9 | 2.9 |
| terrestrial foodstuff consumption | 4.7 | 4.6 |
| marine foodstuff consumption | 0.58 | 0.55 |
| direct radiation | 2.9 | 3.0 |
| Total dose to terrestrial critical group (adults) | 12 | 12 |
Table 43. Collective doses from Sellafield’s discharges, 2022
Collective Dose (manSv)
| Radionuclide | Aerial Discharges UK | Aerial Discharges Europe | Aerial Discharges World | Marine Discharges UK | Marine Discharges Europe | Marine Discharges World |
|---|---|---|---|---|---|---|
| Tritium | 0.01 | 0.02 | 0.02 | 0.00006 | 0.0002 | 0.005 |
| Carbon-14 | 0.02 | 0.09 | 1.1 | 0.17 | 0.56 | 5.8 |
| Krypton-85 | 0.01 | 0.04 | 0.63 | - | - | - |
| Technetium-99 | - | - | - | 0.0009 | 0.003 | 0.003 |
| Iodine-129 | 0.08 | 0.38 | 0.54 | 0.0003 | 0.0009 | 0.004 |
| Caesium-137 | 0.001 | 0.005 | 0.005 | 0.02 | 0.06 | 0.10 |
| Plutonium-alpha | 0.009 | 0.01 | 0.01 | 0.02 | 0.06 | 0.07 |
| Americium-241 | 0.001 | 0.002 | 0.002 | 0.01 | 0.04 | 0.04 |
| Other nuclides | 0.0002 | 0.0004 | 0.0004 | 0.02 | 0.07 | 0.07 |
| Total | 0.13 | 0.55 | 2.3 | 0.25 | 0.78 | 6.0 |
Collective doses have been calculated, using a 500 year integration period, based on the most recent European Union methodology.
Representative Persons Dose Assessment
Table 44. Summary of representative person dose calculations for various age groups. 2022.
Highlighted entries denote top 2 dose contribution pathways per age and source category.
| Pathway | Adult Dose (microSv) total | Adult Dose (microSv) marine | Adult Dose (microSv) terrestrial | Child Dose (microSv) total | Child Dose (microSv) marine | Child Dose (microSv) terrestrial | Infant Dose (microSv) total | Infant Dose (microSv) marine | Infant Dose (microSv) terrestrial |
|---|---|---|---|---|---|---|---|---|---|
| Crustacean Consumers | 10.7 | 9.8 | 0.9 | 4.5 | 3.6 | 0.9 | 1.7 | 0.8 | 0.9 |
| Occupants for Direct Radiation | 6.7 | 3.4 | 3.3 | 4.9 | 1.6 | 3.3 | 3.4 | 0.1 | 3.3 |
| Egg Consumers | 2.3 | 0.2 | 2.1 | 2.1 | 0.1 | 1.9 | 2.1 | 0.0 | 2.1 |
| Freshwater Fish Consumers | 1.6 | 0.0 | 1.6 | 1.5 | 0.0 | 1.5 | 1.1 | 0.0 | 1.1 |
| Sea Fish Consumers | 11.5 | 11.1 | 0.4 | 5.2 | 4.8 | 0.4 | 1.0 | 0.5 | 0.4 |
| Domestic Fruit Consumers | 6.4 | 3.5 | 2.9 | 4.6 | 1.7 | 2.9 | 3.7 | 0.1 | 3.6 |
| Wild Fruit and Nut Consumers | 2.3 | 0.4 | 1.9 | 1.9 | 0.1 | 1.8 | 1.9 | 0.0 | 1.8 |
| Occupants over Saltmarsh | 30.5 | 30.5 | 0.0 | 15.2 | 15.2 | 0.0 | 0.9 | 0.9 | 0.0 |
| Occupants over Sediment | 41.1 *shaded | 40.7 *shaded | 0.4 | 20.6 *shaded | 20.2 *Shaded | 0.4 | 1.7 | 1.3 *shaded | 0.4 |
| Honey Consumers | 1.6 | 0.0 | 1.6 | 1.5 | 0.0 | 1.5 | 1.1 | 0.0 | 1.1 |
| Marine Plants and Algae | 15.2 | 15.2 | 0.0 | 7.3 | 7.3 | 0.0 | 0.6 | 0.6 | 0.0 |
| Cattle Meat Consumers | 2.6 | 0.1 | 2.5 | 2.4 | 0.1 | 2.3 | 2.0 | 0.0 | 2.0 |
| Game Meat Consumers | 2.9 | 1.3 | 1.5 | 1.4 | 0.4 | 1.0 | 0.7 | 0.2 | 0.6 |
| Poultry Meat Consumers | 21.7 | 18.9 | 2.7 | 11.8 | 9.4 | 2.4 | 2.9 | 0.6 | 2.3 |
| Sheep Meat Consumers | 2.6 | 0.0 | 2.6 | 2.3 | 0.0 | 2.2 | 2.1 | 0.0 | 2.1 |
| Wildfowl Consumers | 1.7 | 0.9 | 0.8 | 1.0 | 0.5 | 0.6 | 0.4 | 0.0 | 0.4 |
| Milk Consumers | 1.2 | 0.1 | 1.2 | 1.4 | 0.0 | 1.4 | 2.0 | 0.0 | 2.0 |
| Mollusc Consumers | 48.1 *shaded | 48.1 *shaded | 0.0 | 17.9 *shaded | 17.9 *shaded | 0.0 | 3.1 | 3.1 *shaded | 0.0 |
| Mushroom Consumers | 3.4 | 0.8 | 2.7 | 2.9 | 0.4 | 2.5 | 2.5 | 0.0 | 2.5 |
| Occupants In Water | 1.3 | 1.3 | 0.0 | 0.6 | 0.6 | 0.0 | 0.0 | 0.0 | 0.0 |
| Occupants On Water | 2.3 | 2.3 | 0.0 | 0.7 | 0.7 | 0.0 | 0.3 | 0.3 | 0.0 |
| Local Inhabitants (0 - 0.25km) | 4.7 | 0.2 | 4.5 *shaded | 4.4 | 0.1 | 4.3 *shaded | 4.1 | 0.0 | 4.1 *shaded |
| Local Inhabitants (0.25 - 0.5km) | 5.0 | 0.0 | 5.0 *shaded | 4.6 | 0.0 | 4.6 *shaded | 4.5 *shaded | 0.0 | 4.5 *shaded |
| Local Inhabitants (0.5 - 1km) | 5.3 | 1.5 | 3.8 | 4.5 | 0.7 | 3.8 | 3.8 | 0.0 | 3.7 |
| Green Vegetable Consumers | 10.0 | 6.3 | 3.7 | 6.6 | 3.1 | 3.5 | 3.8 | 0.2 | 3.6 |
| Other Domestic Vegetable | 10.2 | 6.8 | 3.4 | 6.7 | 3.4 | 3.3 | 3.6 | 0.2 | 3.4 |
| Potato Consumers | 2.3 | 0.0 | 2.3 | 2.3 | 0.0 | 2.3 | 2.1 | 0.0 | 2.1 |
| Root Vegetable Consumers | 10.2 | 6.3 | 3.9 | 6.9 | 3.1 | 3.7 | 4.2 *shaded | 0.2 | 4.0 |
Dosimetric considerations for individual and collective doses
Data identifying critical groups and their habits by pathway have been provided by the Food Standards Agency, Environment Agency and the Centre for Environment, Fisheries and Aquaculture Science, or their predecessors, based on published survey work.
Worked example of committed effective dose calculation for an individual member of a critical group
Table 45 - CED received by an adult member of the seafood consuming critical group from Am-241 in winkles
| Parameter | Value | Location in report | |
|---|---|---|---|
| A | Am-241 activity concentration in winkles | 12 Bq kg-1 | Table 11 |
| B | Consumption rate of winkles by adults | 6 kg y-1 | Table 46 |
| C | Committed effective dose per unit intake value for ingestion for Am-241 in Cumbrian winkle consumed by an adult | 8.0E-08 Sv Bq-1 | Table 49 |
CED received by an adult member of the seafood consuming critical group from Am-241 in winkles is:
CED = A x B x C in units of Sv per year;
CED = 12 Bq kg-1 x 6 kg y-1 x 8.0E-08 Sv Bq-1 = 5.8E-06 Sv y-1,
This approach is repeated for all radionuclides of interest in each seafood species of interest, through the incorporation of the appropriate consumption rates and committed effective dose per unit intake values.
Care is needed in using the correct dose per unit intake values for Cumbrian winkles as a specific set of data for transuranic radionuclides are available.
Table 46. Seafood consumption rates from people associated with marine discharges (2017 – 2021 average data)
Consumption rates (kg y-1) (2017 – 2021 average)
| Seafood | Critical group (Sellafield fishing community) (a) | Consumers associated with Whitehaven fishery (b) | Typical seafood consumers (Whitehaven) (b) |
|---|---|---|---|
| Fish: | |||
| Cod | 15.4 | 20 | 7.5 |
| Plaice | 27.4 | 20 | 7.5 |
| Crustacea: | |||
| Crabs | 9.7 | 0 | 0 |
| Lobsters | 15.1 | 0 | 0 |
| Nephrops | 6.7 | 9.7 | 0 |
| Molluscs: | |||
| Winkles | 6.0 | 0 | 0 |
| Mussels | 5.1 | 0 | 0 |
a. CEFAS, 2022. Radiological Habits Survey: Sellafield, 2021.
b. RIFE-27.
Table 47. Consumption rates of critical group consumers associated with aerial discharges
| Foodstuff (a) | Consumption rate (kg y-1) (b,c) adult | Consumption rate (kg y-1) (b,c) child | Consumption rate (kg y-1) (b,c) infant |
|---|---|---|---|
| milk | 95 | 110 | 130 |
| beef | 15 | 15 | 3 |
| beef liver | 2.75 | 1.5 | 0.5 |
| mutton | 8 | 4 | 0.8 |
| poultry | 10 | 5.5 | 2 |
| game | 6 | 4 | 0.8 |
| fish (cod + plaice) | 15 | 3 | 0.75 |
| leafy vegetables | 15 | 6 | 3.5 |
| potatoes | 120 | 85 | 35 |
| root vegetables | 10 | 6 | 5 |
| legumes | 20 | 8 | 3 |
| domestic fruit | 75 | 50 | 35 |
| wild fruit | 7 | 3 | 1 |
| mushrooms | 3 | 1.5 | 0.6 |
| honey | 2.5 | 2 | 2 |
| eggs | 8.5 | 6.5 | 5 |
a. Based on UKHSA and FSA recommendations.
b. Consumption rates for foetal exposure taken to be same as those of adults.
c. Domestic fruit and potatoes as high rate consumers
Table 48. Parameters for calculation of plume immersion and inhalation doses
| Adult | Child | Infant | |
|---|---|---|---|
| Occupancy (%) | 100% | 100% | 100% |
| Time Indoors (%) | 50% | 90% | 90% |
| Cloud Shielding Factor | 0.2 | 0.2 | 0.2 |
| Ground Shielding Factor | 0.1 | 0.1 | 0.1 |
| Breathing rate (m3 a-1) | 9,860 | 5,600 | 1,900 |
| Drinking Water (l a-1) | 600 | 350 | 260 |
Foetal dose is calculated from the adult dose multiplied by the ratio of the foetus to the adult dose conversion factors.
Table 49. Committed effective doses per unit intake for ingestion
| Radionuclide | f1 (a) | Dose per unit intake (Sv Bq-1) foetus | Dose per unit intake (Sv Bq-1) 1 year old | Dose per unit intake (Sv Bq-1) 10 year old | Dose per unit intake (Sv Bq-1) adult |
|---|---|---|---|---|---|
| H-3 organic | 1E+00 | 6.3E-11 | 1.2E-10 | 5.7E-11 | 4.2E-11 |
| C-14 | 1E+00 | 8.0E-10 | 1.6E-09 | 8.0E-10 | 5.8E-10 |
| Co-60 | 1E-01 | 1.9E-09 | 2.7E-08 | 1.1E-08 | 3.4E-09 |
| Sr-90 | 3E-01 | 4.6E-08 | 9.3E-08 | 6.6E-08 | 3.1E-08 |
| Zr-95 | 1E-02 | 7.6E-10 | 8.8E-09 | 3.0E-09 | 1.5E-09 |
| Nb-95 | 1E-02 | 3.7E-10 | 3.2E-09 | 1.1E-09 | 5.8E-10 |
| Tc-99 | 5E-01 | 4.6E-10 | 4.8E-09 | 1.3E-09 | 6.4E-10 |
| Ru-106 | 5E-02 | 3.8E-10 | 4.9E-08 | 1.5E-08 | 7.0E-09 |
| Ag-110m | 5E-02 | 2.1E-09 | 1.4E-08 | 5.2E-09 | 2.8E-09 |
| Sb-125 | 1E-01 | 4.7E-10 | 6.1E-09 | 2.1E-09 | 1.1E-09 |
| I-129 | 1E+00 | 4.4E-08 | 2.2E-07 | 1.9E-07 | 1.1E-07 |
| I-131 | 1E+00 | 2.3E-08 | 1.8E-07 | 5.2E-08 | 2.2E-08 |
| Cs-134 | 1E+00 | 8.7E-09 | 1.6E-08 | 1.4E-08 | 1.9E-08 |
| Cs-137 | 1E+00 | 5.7E-09 | 1.2E-08 | 1.0E-08 | 1.3E-08 |
| U-234 | 2E-02 | 1.5E-08 | 1.3E-07 | 7.4E-08 | 4.9E-08 |
| U-235 | 2E-02 | 1.4E-08 | 1.3E-07 | 7.1E-08 | 4.7E-08 |
| U-238 | 2E-02 | 1.3E-08 | 1.5E-07 | 7.5E-08 | 4.8E-08 |
| Np-237 | 5E-04 | 3.6E-09 | 2.1E-07 | 1.1E-07 | 1.1E-07 |
| Pu-238 | 5E-04 | 9.0E-09 | 4.0E-07 | 2.4E-07 | 2.3E-07 |
| Pu-239 | 5E-04 | 9.5E-09 | 4.2E-07 | 2.7E-07 | 2.5E-07 |
| Pu-240 | 5E-04 | 9.5E-09 | 4.2E-07 | 2.7E-07 | 2.5E-07 |
| Pu-241 | 5E-04 | 1.1E-10 | 5.7E-09 | 5.1E-09 | 4.8E-09 |
| Am-241 | 5E-04 | 2.7E-09 | 3.7E-07 | 2.2E-07 | 2.0E-07 |
| Cm-242 | 5E-04 | 4.7E-10 | 7.6E-08 | 2.4E-08 | 1.2E-08 |
| Cm-243 | 5E-04 | 1.5E-07 | 3.3E-07 | 1.6E-07 | 1.5E-07 |
| Cm-244 | 5E-04 | 2.2E-09 | 2.9E-07 | 1.4E-07 | 1.2E-07 |
| Pu-238 (winkle only) | 2E-04 | 3.6E-09 | 1.6E-07 | 9.6E-08 | 9.2E-08 |
| Pu-239 (winkle only) | 2E-04 | 3.8E-09 | 1.7E-07 | 1.1E-07 | 1.0E-07 |
| Pu-240 (winkle only) | 2E-04 | 3.8E-09 | 1.7E-07 | 1.1E-07 | 1.0E-07 |
| Pu-241 (winkle only) | 2E-04 | 4.4E-11 | 2.3E-09 | 2.0E-09 | 1.9E-09 |
| Am-241 (winkle only) | 2E-04 | 1.1E-09 | 1.5E-07 | 8.8E-08 | 8.0E-08 |
a. The gastro-intestinal absorption factor does not apply to neonates or infants aged below about one year.
Table 50. Committed effective doses per unit intake for inhalation
| Radionuclide | Lung absorption type | f1 (a) | Dose per unit intake (Sv Bq-1) foetus | Dose per unit intake (Sv Bq-1) 1 year old | Dose per unit intake (Sv Bq-1) 10 year old | Dose per unit intake (Sv Bq-1) adult | Basis for choice of lung absorption type |
|---|---|---|---|---|---|---|---|
| H-3 organic | V | 1E+00 | 6.3E-11 | 1.1E-10 | 5.5E-11 | 4.1E-11 | Organically bound |
| C-14 | M | 1E-01 | 6.6E-11 | 6.6E-09 | 2.8E-09 | 2.0E-09 | ICRP default |
| Co-60 | M | 1E-01 | 1.2E-09 | 3.4E-08 | 1.5E-08 | 1.0E-08 | ICRP default |
| Sr-90 | M | 1E-01 | 1.0E-08 | 1.2E-07 | 5.4E-08 | 3.8E-08 | ICRP default |
| Zr-95 | M | 2E-03 | 4.6E-10 | 2.1E-08 | 9.0E-09 | 6.3E-09 | ICRP default |
| Nb-95 | M | 1E-02 | 1.6E-10 | 5.2E-09 | 2.2E-09 | 1.5E-09 | ICRP default |
| Tc-99 | M | 1E-01 | 8.3E-11 | 1.3E-08 | 5.7E-09 | 4.0E-09 | ICRP default |
| Ru-106 | M | 5E-02 | 4.1E-10 | 1.1E-07 | 4.1E-08 | 2.8E-08 | ICRP default |
| Ag-110m | M | 5E-02 | 1.5E-09 | 2.8E-08 | 1.2E-08 | 7.6E-09 | ICRP default |
| Sb-125 | M | 1E-02 | 2.6E-10 | 1.6E-08 | 6.8E-09 | 4.8E-09 | ICRP default |
| I-129 | F | 1E+00 | 1.5E-08 | 8.6E-08 | 6.7E-08 | 3.6E-08 | ICRP default |
| I-131 | F | 1E+00 | 8.1E-09 | 7.2E-08 | 1.9E-08 | 7.4E-09 | ICRP default |
| Cs-134 | F | 1E+00 | 3.0E-09 | 7.3E-09 | 5.3E-09 | 6.6E-09 | ICRP default |
| Cs-137 | F | 1E+00 | 2.0E-09 | 5.4E-09 | 3.7E-09 | 4.6E-09 | ICRP default |
| U-234 | M | 2E-02 | 4.9E-08 | 1.1E-05 | 4.8E-06 | 3.5E-06 | ICRP default |
| U-235 | M | 2E-02 | 4.5E-08 | 1.0E-05 | 4.3E-06 | 3.1E-06 | ICRP default |
| U-238 | M | 2E-02 | 4.4E-08 | 9.4E-06 | 4.0E-06 | 2.9E-06 | ICRP default |
| Pu-238 | M | 5E-04 | 1.1E-06 | 7.4E-05 | 4.4E-05 | 4.6E-05 | ICRP default |
| Pu-239 | M | 5E-04 | 1.2E-06 | 7.7E-05 | 4.8E-05 | 5.0E-05 | ICRP default |
| Pu-240 | M | 5E-04 | 1.2E-06 | 7.7E-05 | 4.8E-05 | 5.0E-05 | ICRP default |
| Pu-241 | M | 5E-04 | 1.4E-08 | 9.7E-07 | 8.3E-07 | 9.0E-07 | ICRP default |
| Am-241 | M | 5E-04 | 3.2E-07 | 6.9E-05 | 4.0E-05 | 4.2E-05 | ICRP default |
| Cm-242 | M | 5E-04 | 5.1E-08 | 1.8E-05 | 7.3E-06 | 5.2E-06 | ICRP default |
| Cm-243 | M | 5E-04 | 3.1E-05 | 6.1E-05 | 3.1E-05 | 3.1E-05 | ICRP default |
| Cm-244 | M | 5E-04 | 2.6E-07 | 5.7E-05 | 2.7E-05 | 2.7E-05 | ICRP default |
a. The gastro-intestinal absorption factor does not apply to neonates or infants aged below about one year.
b. No default inhalation class recommended – most restrictive value cited by ICRP used.
Table 51. Collective dose commitment (man Sv per Bq discharged, integrated to 500 years): atmospheric discharges
| Radionuclide | UK | EU | World |
|---|---|---|---|
| H-3 | 6.7E-16 | 1.2E-15 | 1.5E-15 |
| C-14 | 2.0E-13 | 1.0E-12 | 1.3E-11 |
| Kr-85 | 4.3E-18 | 1.5E-17 | 2.6E-16 |
| Sr-90 | 1.9E-12 | 8.8E-12 | 8.8E-12 |
| Ru-106 | 3.1E-13 | 4.2E-13 | 4.2E-13 |
| Sb-125 | 1.2E-13 | 1.7E-13 | 1.7E-13 |
| I-129 | 4.5E-11 | 2.1E-10 | 2.9E-10 |
| I-131 | 7.8E-13 | 4.8E-13 | 4.8E-13 |
| Cs-137 | 1.8E-12 | 6.1E-12 | 6.1E-12 |
| Pu-239 & Pu-240 | 1.7E-10 | 2.4E-10 | 2.4E-10 |
| Pu-241 | 3.0E-12 | 4.4E-12 | 4.4E-12 |
| Am-241 | 1.4E-10 | 2.0E-10 | 2.0E-10 |
European Union is defined as the population of the EU12 member states, 360 million
Table 52. Collective dose commitment (man Sv per Bq discharged, integrated to 500 years): liquid discharges
| Radionuclide | UK | EU | World |
|---|---|---|---|
| H-3 | 4.6E-19 | 1.9E-18 | 3.5E-17 |
| C-14 | 2.0E-13 | 6.6E-13 | 6.8E-12 |
| Co-60 | 6.7E-14 | 1.9E-13 | 2.4E-13 |
| Sr-90 | 7.0E-16 | 1.8E-15 | 3.0E-15 |
| Zr-95 | 7.3E-17 | 1.5E-16 | 1.6E-16 |
| Nb-95 | 1.7E-17 | 3.5E-17 | 3.8E-17 |
| Tc-99 | 2.5E-15 | 7.6E-15 | 9.5E-15 |
| Ru-106 | 1.9E-14 | 5.1E-14 | 5.6E-14 |
| I-129 | 1.9E-14 | 5.7E-14 | 2.2E-13 |
| Cs-134 | 1.3E-14 | 3.0E-14 | 4.6E-14 |
| Cs-137 | 1.6E-14 | 4.1E-14 | 7.1E-14 |
| Ce-144 | 6.9E-17 | 1.8E-16 | 2.0E-16 |
| Pu-239 & Pu-240 | 3.0E-13 | 8.4E-13 | 9.8E-13 |
| Pu-241 | 2.5E-14 | 7.1E-14 | 7.9E-14 |
| Am-241 | 1.3E-12 | 3.6E-12 | 3.9E-12 |
| Cm-242 | 2.3E-15 | 6.1E-15 | 6.8E-15 |
| Cm-243 & Cm-244 | 4.3E-14 | 1.1E-13 | 1.2E-13 |
The collective dose factors include the contribution from the first decay product where appropriate.
European Union is defined as the population of the EU12 member states, 360 million