School Games Indicator 2013/14
Published 6 November 2014

© Crown copyright 2014
This publication is licensed under the terms of the Open Government Licence v3.0 except where otherwise stated. To view this licence, visit nationalarchives.gov.uk/doc/open-government-licence/version/3 or write to the Information Policy Team, The National Archives, Kew, London TW9 4DU, or email: psi@nationalarchives.gov.uk.
Where we have identified any third party copyright information you will need to obtain permission from the copyright holders concerned.
This publication is available at https://www.gov.uk/government/statistics/school-games-indicator-2013-2014/school-games-indicator-201314
1. Introduction
1.1 This Report
This statistical release presents the cost per participant of the School Games. More specifically, it derives the average public sector cost per eligible student at schools participating in the School Games for the 2013/14 academic year. The headline statistic will be used as an input indicator to measure the performance of the Department for Culture Media and Sport (DCMS).
Input indicators show what is being ‘bought’ with public money, i.e. the resources being invested into delivering the results that DCMS and partners are aiming to achieve.
This release details the calculation and the component parts of the indicator. It looks at the schools participating in the School Games, the number of students at these schools as well as the public sector finances allocated to the School Games.
1.2 School Games
The School Games were established in 2011 and are a competition over four levels for school children aged 5 to under 19. The School Games are designed to build on the London 2012 Olympic and Paralympic Games and enable every school and child to participate in competitive sport, including opportunities for disabled youngsters. The four levels are:
- Level 1 – sporting competition for all students through intra-school competition.
- Level 2 – individuals and teams are selected to represent their schools in local inter-school competitions.
- Level 3 – the county/area will stage multi-sport School Games festivals as a culmination of year-round school sport competition.
- Level 4 – the School Games finals: a national multi-sport event where the most talented young people in the UK are selected to compete.
Levels 1 to 3 are open to all schools in England, whilst level 4 is a UK wide event.
The School Games were piloted in nine areas of England in the 2010/11 academic year. 873 schools took part in the level 1 piloting (against a target of 500) each holding a School Games Day. Across level 2,366 schools were involved in the piloting work (against a target of 108) all running multi team/sport leagues. Nine pilot county level 3 festivals were staged where 10,000 children (aged 5-16) took part. Full roll out of the School Games to schools across England, as well as the first UK wide School Games final – in the Olympic Stadium – occurred in the 2011/12 academic year.
Nationally and locally the School Games are being delivered through partnerships. The national partnership is made up of:
- The Department for Culture, Media and Sport (DCMS) who have overall policy leadership supported by the Department for Education (DfE) and the Department of Health (DH).
- Sport England who are the Lottery distributor and are supporting the engagement of National Governing Bodies of Sport (NGBs) and County Sports Partnerships.
- The British Paralympic Association brings the vision and inspiration of the Paralympics.
- The Youth Sport Trust who were commissioned by Sport England to provide development support to schools, sports and other local partners.
1.3 Forthcoming Releases
As this is an annual measure, the next release, scheduled for Autumn 2015, will present the annual estimates for 2014/15.
2. The School Games – 2013/14
2.1 Key Findings
- In the year to July 31st 2014, 17,800 schools, with 7.09 million eligible students, had participated[footnote 2] in the School Games.
- In 2013/14 there was £21.95 million of public funding for the School Games.
- This equates to an average public sector cost of £3.10 per eligible student at schools participating in the School Games in 2013/14.
2.2 Full explanation and commentary
Participation
Participation in the School Games cannot be directly measured at a student level – only the number of schools which had participated can be estimated from those that have registered. However, the School Games are designed so schools can provide opportunities to all their students. Therefore a reasonable proxy for the level of student participation is to include all eligible students at participating schools. This is the approach we have taken in this release.
Participating Schools
The School Games launched to all schools in England in the 2011/12 academic year and have continued in 2013/14.
For the purposes of this release, we define participating schools as those registered on the School Games database by the 31st July 2014. As schools do not need to re-register to participate in the School Games in the years following their initial registration, this includes schools who registered for the School Games since 2011/12. However, while schools remain eligible to participate in the School Games after their initial registration, some schools may close or re-open in a new form, for example as an academy, or be amalgamated into other schools.
In order to avoid counting schools that were no longer open, schools that closed before September 2013 (i.e. those which were not open at any point during the 2013/14 academic year) have not been counted as participating. Additionally, the predecessors of schools that had re-opened as academies, or had been amalgamated into other schools and re-registered for the School Games in their new form have been excluded to avoid double-counting their students. Annex A provides a schematic overview of the decision for the inclusion and exclusion of schools.
In the year to July 2014, 17,800 schools had registered for the School Games and therefore counted as participating on the basis of this methodology. This compares to 18,397 schools in total listed on the School Games database as of the writing of this publication (the School Games database includes schools which have signed up after the end of the 2013/14 school year).
Eligible Students at Participating Schools
EduBase is a database of educational establishments across England and Wales maintained by the Department for Education (DfE). Where available, EduBase records the number of pupils registered at establishments from the School Census. It also records the capacity of educational establishments.
To obtain the number of eligible students, schools which had participated in the School Games were matched to data on student numbers from EduBase. In line with the methodology described in the Participating Schools section of this release, schools that closed before September 2013 were not included in the analysis.
For schools where the number of students was not available or was zero in the EduBase data, school capacity was available to use as a proxy in 196 cases. This is a reasonable approximation as the median occupancy of school places where data are available is 98%. Additional data from “Local Authority Tables by Provider by Funding Stream, Learner and Learning Characteristics”[footnote 3] gave student numbers for 125 further education establishments, such as sixth form colleges, taking just those students aged below 19. This left 21 schools reporting zero students in the final dataset, out of an overall 17,800 schools that were counted as participating based on the criteria outlined in Annex A. Table 1 summarises which data sources were used and for how many schools.
Table 1: Data source used to obtain the number of students at schools signed up for the School Games as of July 31st 2014
| Data Source | Number of Schools | Number of Studentsb |
|---|---|---|
| EduBase School Census | 17,458 | 6,749,000 |
| EduBase School Capacity | 196 | 77,000 |
| FE and Skills Participation | 125 | 261,000 |
| Nonea | 21 | 0 |
| Total | 17,800 | 7,087,000 |
Notes
a Number of students data not available
b Rounded to the nearest thousand
Public Sector Cost
Public sector funding for the School Games has come from the Lottery through Sport England (SE); and from the Exchequer through Sport England, the Department for Culture, Media and Sport (DCMS), the Department for Education (DfE) and the Department for Health (DH). In the 2013/14 financial year £21.95 million of public sector funding was allocated to the School Games, with a full breakdown of the funding given in Table 2 below.
Table 2: School Games funding by year and source
| Funding Line | Source | 2010/11 | 2011/12 | 2012/13 | 2013/14 (this release) | 2014/15 | 2015/16 d |
|---|---|---|---|---|---|---|---|
| Sport England Lottery Levels 1-4 | Lottery | £1.2m | £7.8m | £6.2m | £10m | £10m | £5.5m |
| Department of Health a | Exchequer | -c | £2.5m | £7.0m | £7.0m | £7.0m | £7.0m |
| Sport England/DCMS a | Exchequer | - | £4.0m | £4.0m | £4.0m | £4.0m | £4.0m |
| DfE PE Teacher Release b | Exchequer | - | £32.5m | £32.5m | - | - | - |
| DfE Disability/ Volunteer | Exchequer | - | £4.0m | £1.3m | £0.95m | £0.49m | TBA e |
| Total | Lottery & Exchequer | £1.2m | £50.8m | £51.0m | £22.0m | £21.5m | £16.5m |
Notes
a School Games organiser
b While this funding is not specifically for School Games, it supports delivery of the programme
c - inidcates no funding
d Provisional
e To Be Announced/Decision Pending
Level 4 of the School Games, the national competition, is not school-based. The National Governing Bodies of Sport select participants for the one off event. However, the cost is included as the measure presented in this release considers the total School Games package.
Public Sector Cost per Eligible Student Participating
Dividing the public sector cost by the number of eligible students at participating schools gives the final measure. It should be noted that the time periods do not match exactly, with the cost in financial years and the number of students taken after the end of the academic year (up to 31st July, which is in the following financial year). However, it is not possible to adjust the cost to an academic year basis.
In the year to 31st July 2014, 17,800 schools, with 7.09 million eligible students had participated[footnote 4] in the School Games. In 2013/14 there was £21.95m of public funding allocated for the School Games. This equates to an average public sector cost of £3.10 per eligible student at schools participating in the School Games.
Differences between the 2013/14 and 2012/13 indicator
The previous release of this indicator, published in October 2013, reported an average public sector cost of the School Games per eligible pupil of £9.43. This was calculated based on 13,561 schools which had signed up, 5.41 million eligible students and £51.0 million of public funding. Table 3 shows the breakdown between the two years.
Table 3: Average public sector cost per eligible student at schools participating in the School Games, 2011/12 – 2013/14
| Number of schools signed up to the School Games Database | Number of eligible students (m) | Public funding (£m) | Average public sector cost per eligible student at schools participating in the School Games (£) | |
|---|---|---|---|---|
| 2011/12 | 8,341 | 3.85 | 50.8 | 13.20 |
| 2012/13 | 13,561 | 5.41 | 51.0 | 9.43 |
| 2013/14 | 17,800 | 7.09 | 22.0a | 3.10 |
Notes
a Decrease is largely due to the end of the two year DfE PE Teacher Release funding.
To note: the figures in this and the previous years’ releases are not directly comparable to those of 2011/12. The differences are outlined below:
- Schools that had initially signed up for the School Games prior to January 2012 were required to re-register on a new database to activate their account. The 2011/12 figures therefore related to how many schools had signed up between January and July 2012. It may be that some schools had signed up on the initial database, but not re-registered on the new database and would therefore not be counted in the 2011/12 indicator.
- 2013/14 figures relate to the number of schools that had signed up since January 2012 and up until 31st July 2013 but with schools which had closed prior to September 2013 removed. No schools were removed in the 2011/12 indicator as they all would have been open at some point in the time period in question.
- In an improvement to the methodology, the 2012/13 indicator excludes schools which had closed since September 2012 if a new manifestation or amalgamation of the same school had signed up to the School Games. Only 8 schools were excluded for this reason in 2012/13. In 2013/14, no such schools were signed up to School Games.
3. Annex A: Decision Tree for School Inclusion/Exclusion
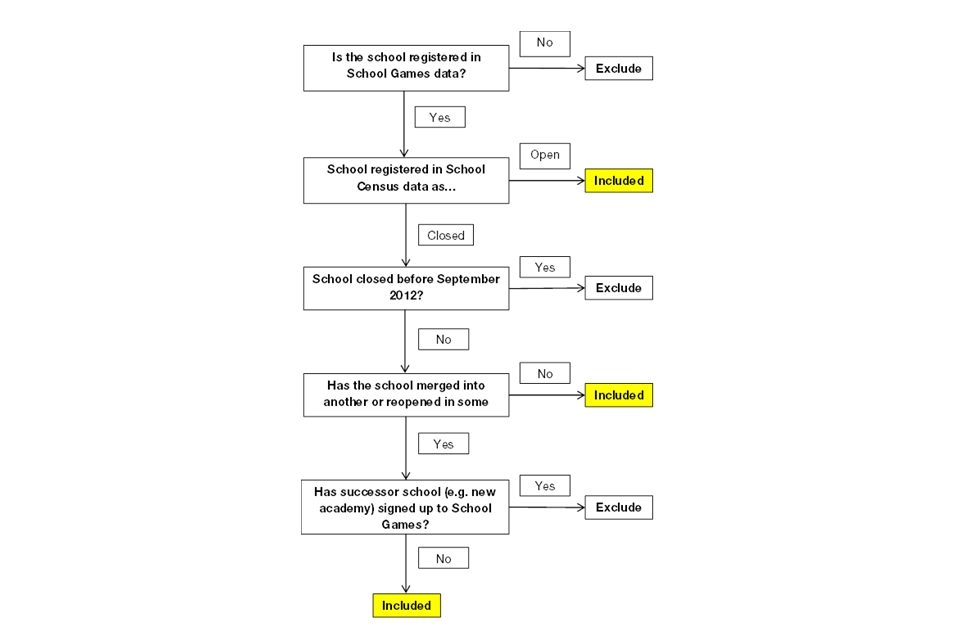
Decision Tree for School Inclusion/Exclusion
4. Annex B: Background Note
-
School Games is an Official Statistic and as such has been produced to the professional standards set out in the Code of Practice for Official Statistics. Official Statistics undergo regular quality assurance reviews to ensure they meet customer needs and are produced free from any political interference. For more information, see the Code of Practice
-
This report has been produced by Tilmann Eckhardt and Niall Goulding. Acknowledgement goes to colleagues within DCMS, Sport England and Department for Education for their assistance with the production and quality assurance of this release.
-
The responsible statistician for this release is Niall Goulding. For enquiries on this release, please contact Niall Goulding on 0207 211 6085.
-
Next Release: as this is an annual measure, the next release, scheduled for Autumn 2015, will present the annual estimates for 2014/15.
-
For general enquiries telephone: 0207 211 6200
Department for Culture Media and Sport
4th Floor, 100 Parliament Street
London
SW1A 2BQ
enquiries@culture.gov.uk
-
Defined as schools registered on the latest database and not ruled out from participating due to closure; see Participating Schools section and Annex A for more detail. ↩
-
As defined in the Participating Schools section ↩