Safety in Custody Statistics, England and Wales: Deaths in Prison Custody to December 2020 Assaults and Self-harm to September 2020
Published 28 January 2021

© Crown copyright 2021
This publication is licensed under the terms of the Open Government Licence v3.0 except where otherwise stated. To view this licence, visit nationalarchives.gov.uk/doc/open-government-licence/version/3 or write to the Information Policy Team, The National Archives, Kew, London TW9 4DU, or email: psi@nationalarchives.gov.uk.
Where we have identified any third party copyright information you will need to obtain permission from the copyright holders concerned.
This publication is available at https://www.gov.uk/government/statistics/safety-in-custody-quarterly-update-to-september-2020/safety-in-custody-statistics-england-and-wales-deaths-in-prison-custody-to-december-2020-assaults-and-self-harm-to-september-2020
0.1 Main Points
| Number of deaths increased from the previous 12 month period | In the 12 months to December 2020, there were 318 deaths in prison custody, an increase of 8% from 300 deaths the previous 12 months. |
| Self-harm incidents have increased in the female estate and decreased in the male estate from the previous 12-month period The number of individuals self-harming has decreased |
There were 58,870 self-harm incidents in the 12 months to September 2020, down 5% from the previous 12 months, comprising a 7% decrease in male establishments and a 8% increase in female establishments. In the most recent quarter there were 14,167 self-harm incidents, up 9% on the previous quarter, comprising a 5% increase in male establishments and a 24% increase in female establishments. There were 12,356 individuals self-harming in the 12 months to September 2020, down 3% from the previous 12 months. The number of self-harm incidents per individual remained unchanged at 4.8. There has been a small change to the types of incident included in the definition of self-harm (see Table 1 for more detail). |
| Assaults decreased from the previous 12-month period | There were 24,407 assault incidents in the 12 months to September 2020, down 27% from the 12 months to September 2019. In the most recent quarter, assaults increased by 9% to 4,956 incidents. |
| Assaults on staff have decreased | There were 8,476 assaults on staff in the 12 months to September 2020, down 16% from the previous 12 months. In the latest quarter the number of assaults remained steady at 1,897 incidents. |
| The number of serious assaults on staff decreased 11% of all assaults were serious |
In the 12 months to September 2020, there were 2,734 serious assault incidents, a decrease of 30% from the previous 12 months. Serious prisoner-on-prisoner assaults decreased by 34% to 1,958 in the 12 months to September 2020. Serious assaults on staff also decreased, by 15% to 823. |
Safety in custody statistics cover deaths, self-harm and assaults in prison custody and HMPPS Immigration Removal Centres in England and Wales, with figures in the summary tables in the quarterly publications presented on a 12-month rolling basis over an 11 year time series. This release provides statistics on deaths of prisoners to the end of December 2020, and deaths from COVID-19 have been presented in the section below[footnote 1].
The release also provides statistics on assaults and self-harm up to the end of September 2020. This includes the period from March 2020 when COVID-19 restrictions were introduced in prisons to limit and control the spread of the virus. These restrictions included the implementation of effective isolation of prisoners, reverse cohorting of new entrants to custody, and shielding of vulnerable prisoners.
See Further Information at the end of this bulletin on the managing and running of prisons during the pandemic.
Information has been provided on a small change in the types of incident included in the definition of self-harm.
Supplementary annual tables, providing more in-depth statistics on a calendar year basis, underlying data files with pivot tables providing lower level granularity, and a guidance technical document are also available alongside this bulletin, at http://www.gov.uk/government/collections/safety-in-custody-statistics.
1. Deaths: 12 months ending December 2020
| Number of deaths increased | In the 12 months to December 2020, there were 318 deaths in prison custody, an increase of 6% from 300 deaths in the previous 12 months. Of these, 67 deaths were self-inflicted, a decrease of 21% from 85 in the previous 12 months. |
Figure 1: Quarterly 12-month rolling rate of deaths per 1,000 prisoners, 12 months ending December 2010 to 12 months ending December 2020, with quarterly rates
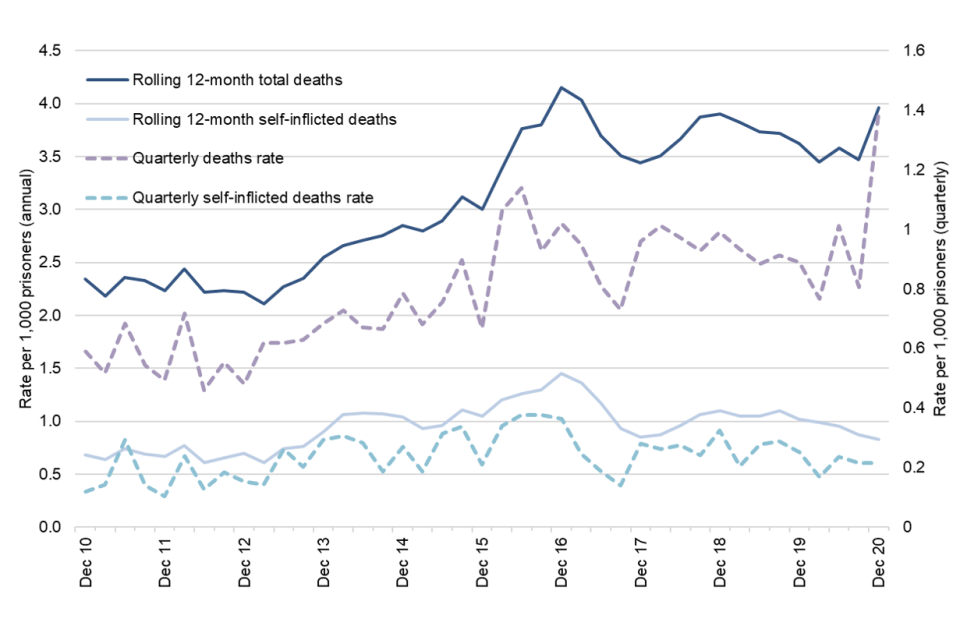
In the 12 months to December 2020, there were 318 deaths in prison custody (a rate of 4.0 per 1,000 prisoners), an increase from 300 deaths in the previous 12 months (a rate of 3.6 per 1,000 prisoners). The most recent quarter saw the number of deaths increase to 109, an increase of 70% from 64 in the three months to September 2020. Further information on deaths from COVID-19 is below. Quarterly death figures should be considered with caution due to greater volatility and the potential for seasonal effects. Long-term trends and more detail are presented in the annual tables[footnote 2].
There were 67 apparent self-inflicted deaths in the 12 months to December 2020 (a rate of 0.8 per 1,000 prisoners), a decrease of 21% from 85 self-inflicted deaths (a rate of 1.0 per 1,000 prisoners) in the previous 12 months. Also, there were 207 deaths due to natural causes (a rate of 2.6 per 1,000 prisoners), an 18% increase from 175 deaths in the previous 12 months.
There were 42 deaths recorded as ‘Other’ in the 12 months to December 2020, 32 of which are ‘awaiting further information’ prior to being classified. In some cases, the results of the toxicology and post-mortem tests are inconclusive, meaning classification cannot be arrived at until inquest (which can be a considerable time after the death). As a result, the number of deaths in the individual categories is not directly comparable with earlier years: it is likely that numbers in some categories will be revised upwards once classifications have been finalised.
Deaths from Covid
From March 2020 to the end of December 2020, 71 prisoners have died within 28 days of having a positive covid-19 test or where there was a clinical assessment that COVID-19 was a contributory factor in their deaths regardless of the cause of death. Of these 71 deaths, 51 are suspected to be due to COVID-19.
The remaining 20 deaths are believed to be due to other causes although the prisoner had tested positive for COVID-19.
As with all deaths in prison custody, each case will be investigated by the Prisons and Probation Ombudsman and subject to an inquest to determine the official cause of death and where necessary this data will be updated.
The most up to date data on deaths suspected to be due to COVID-19 can be found here: https://www.gov.uk/government/collections/hm-prison-and-probation-service-covid-19-statistics-monthly.
2. Self-harm: 12 months to September 2020
| Self-harm incidents have decreased overall by % in the latest year. | There were 58,870 self-harm incidents in the 12 months to September 2020, down 5% from the previous 12 months (a 7% decrease in male establishments and an 8% increase in female establishments). In the most recent quarter there were 14,167 self-harm incidents, up 9% on the previous quarter (a 5% increase in male establishments and a 24% increase in female establishments). |
| The number of individuals self-harming decreased slightly. | There were 12,356 individuals self-harming in the 12 months to September 2020, a 3% decrease from 12,787 in the previous 12 months. The number of self-harm incidents per individual remained unchanged at 4.8. |
Statistics for the 12 months to September, and particularly those for the April to June quarter, relate to the exceptional period since the start of the Covid-19 pandemic and the restricted regimes prisons put in place in order to safely manage the risks of infection during the pandemic (see Further Information at the end of this bulletin). This affects the comparability of the statistics with earlier periods.
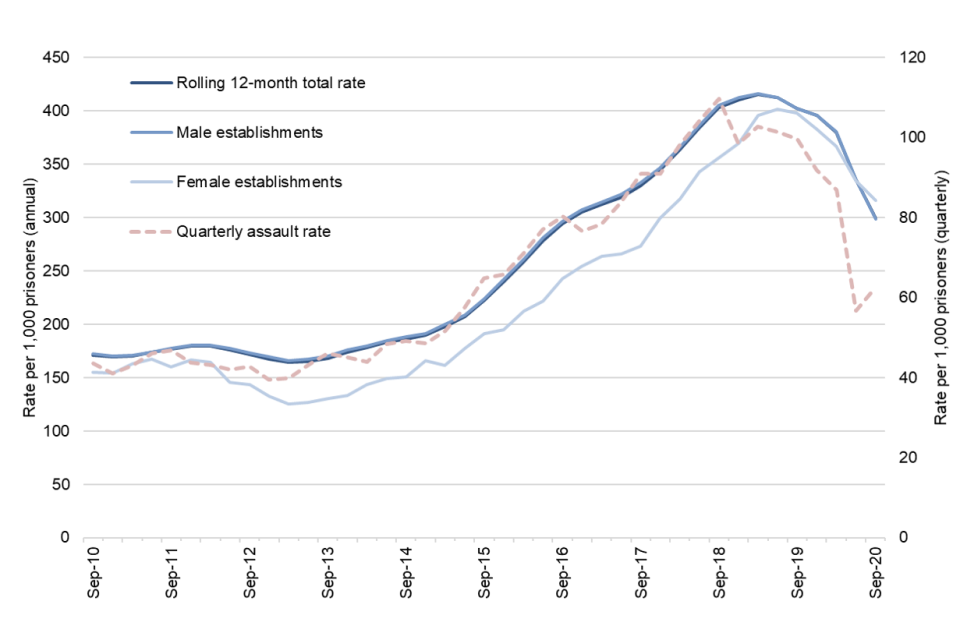
Figure 2: Quarterly 12-month rolling rate of self-harm incidents per 1,000 prisoners, 12 months ending September 2010 to 12 months ending September 2020, with quarterly rates
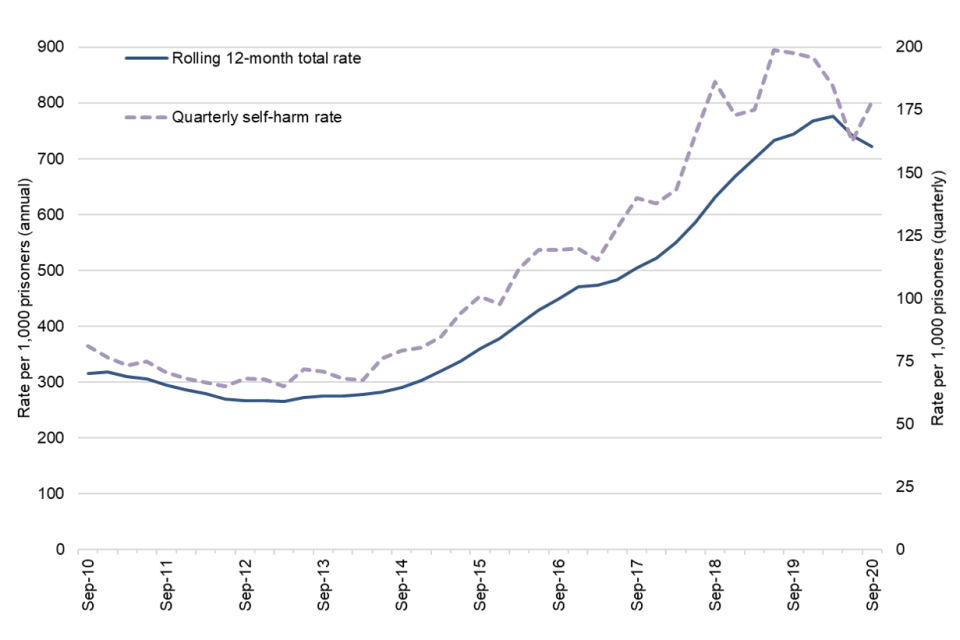
In the 12 months to September 2020, there were 58,870 reported incidents of self-harm (a rate of 722 per 1,000 prisoners), down 5% from the previous 12 months. On a quarterly basis, the number of incidents in the three months to September 2020 increased by 9% from the previous quarter, from 13,017 to 14,167 incidents.
The number of individuals self-harming decreased by 3% to 12,356 in the latest 12 months (a rate of 152 individuals per 1,000 prisoners), from 12,787 in the previous 12 months. The number of incidents per self-harming individual remained unchanged at 4.8 in the latest 12 months, although a small number of prolific self-harmers have a disproportionate impact on this figure. Just over a half (53%) of prisoners who self-harmed in 2019 did so more than once[footnote 3].
The number of self-harm incidents requiring hospital attendance decreased by 17% to 2,843 in the 12 months to September 2020 but increased by 31% in the latest quarter to 725 incidents. The proportion of incidents that required hospital attendance decreased from 5.6% in the 12 months to September 2019 to 4.8% in the latest 12 months.
Figure 3: Quarterly 12-month rolling rate of self-harm incidents per 1,000 prisoners by gender of establishment, 12 months ending September 2010 to 12 months ending September 2020
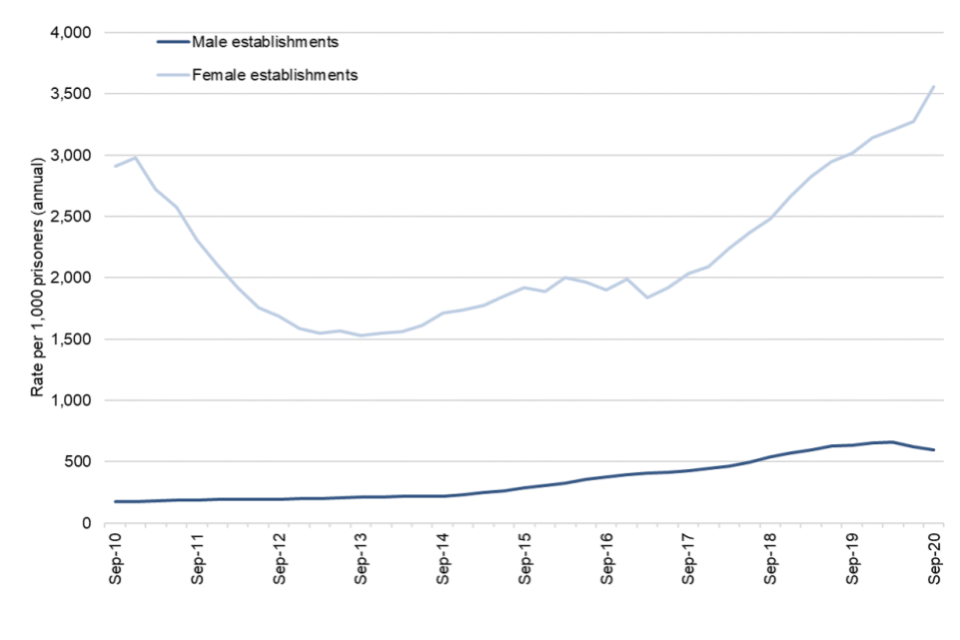
Self-harm trends differ considerably by gender. The number of incidents in male establishments decreased by 7% from 50,174 in the 12 months to September 2019 to 46,427 in the 12 months to September 2020. The number of incidents in the female estate increased 8% from 11,482 in the previous 12 months to 12,443. On a quarterly basis, the number of incidents in the three months to September 2020 increased by 5% in male establishments compared with the previous three months and increased by 24% in female establishments.
The rate of incidents, which takes population size in to account, was 595 incidents per 1,000 prisoners in the male estate in the 12 months to September 2020, down 6% from 635 incidents per 1,000 prisoners in the 12 months to September 2019. The rate of incidents in female establishments was far higher, and increased by 18%, from 3,016 in the previous 12 months to 3,557 in the latest 12 months.
In the 12 months to September 2020, there were 4.2 incidents of self-harm per self-harming male compared with 4.3 the previous 12 months, while for females it increased to 10.0 incidents per self-harming individual from 9.4 the previous 12 months.
Self-harm incidents requiring hospital attendance decreased in male establishments by 21%, from 3,176 in the 12 months to September 2019 to 2,512 in the 12 months to September 2020, and increased by 35% to 331 in female establishments in the latest 12 months. Self-harmers in female establishments were more than twice as prolific as those in male establishments in the latest 12 months (10.0 incidents per self-harming individual, compared to 4.2 in male establishments), although the proportion of incidents that required hospitalisation was higher in male establishments (5.4% compared to 2.7% in female establishments).
Figure 4: 12 month rolling rate of self-harm incidents per 1,000 prisoners by youth offenders, 12 months ending September 2014 to 12 months ending September 2020, with quarterly rates
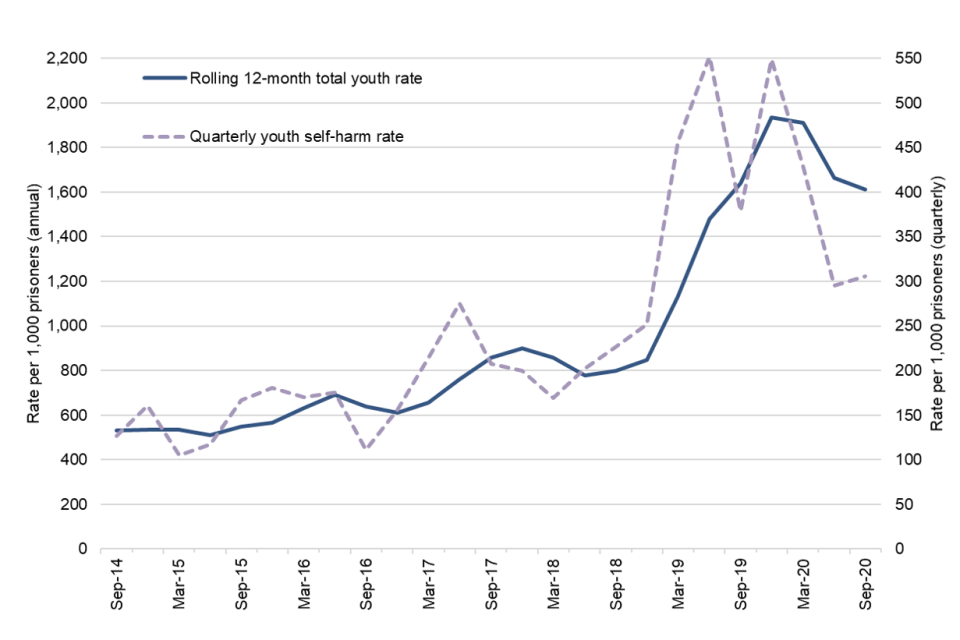
In youth estate[footnote 4], there was a 17% decrease in self-harm incidents from 1,079 in the 12 months to September 2019 to 895 in the 12 months to September 2020, and a 2% decrease in the rate of self-harm over the same period from 1,640 to 1,611 incidents per 1,000 prisoners.
In the latest quarter there were 146 self-harm incidents, a 6% decrease from 156 incidents in the previous quarter, and a 39% decrease from the same quarter the previous year (July to September 2019).
The proportion of self-harm incidents requiring hospital attendance decreased in the youth estate from 4.7% in the 12 months to September 2019 to 1.3% in the 12 months to September 2020, the lowest in the time series.
Removing noose ligature making from the self-harm definition and statistics
Removing noose ligature making from the self-harm definition and statistics.
Changes to the types of incident included in the definition of self-harm and impact on the statistics.
Self-harm in prison custody is defined as “any act where a prisoner deliberately harms themselves, irrespective of method, intent or severity of any injury”. Instructions to establishments on incident reporting have previously included a type of incident described as ‘noose: ligature making’ which relates to occasions on which material that was believed to have been fashioned into a noose was seen by staff, but there was no suggestion that it had been placed around the neck or attached to a ligature point, or had any weight or tension applied to it.
This incident type does not fit the definition, because there is no evidence of harm or injury resulting from it. There are also practical challenges in determining the intended use of torn bedding or clothing seen in the possession of prisoners, and these are known to have been causing inconsistency in reporting. For these reasons in April 2020, establishments were instructed to stop reporting as self-harm incidents occasions where a noose was suspected and/or seen; but with no suggestion that it has been placed around the neck or attached to a ligature point, or had any weight or tension applied to it.
Incidents where a noose has been seen around the neck or attached to a ligature point, or there is evidence that it has had weight or tension applied to it, and those where there was another method of self-harm involved at the same time, are still reported and included within the statistics.
As shown in the table below, this has led to a reduction of less than 2% in the number of incidents where ‘noose: ligature making’ has been reported.
Table 1: Self-harm incidents[footnote 5][footnote 6][footnote 7] and noose making incidents[footnote 8], April 2017 to September 2020
| Self-harm incidents | ||||
|---|---|---|---|---|
| Quarter | Total | All noose-making[footnote 9] | Noose-making only | % of self-harm incidents that were noose-making only |
| 2017 Q2 | 10,956 | 290 | 258 | 2.4 |
| 2017 Q3 | 12,067 | 280 | 243 | 2.0 |
| 2017 Q4 | 11,791 | 241 | 225 | 1.9 |
| 2018 Q1 | 12,045 | 398 | 362 | 3.0 |
| 2018 Q2 | 13,778 | 483 | 450 | 3.3 |
| 2018 Q3 | 15,462 | 510 | 458 | 3.0 |
| 2018 Q4 | 14,330 | 414 | 379 | 2.6 |
| 2019 Q1 | 14,460 | 432 | 389 | 2.7 |
| 2019 Q2 | 16,416 | 556 | 517 | 3.1 |
| 2019 Q3 | 16,450 | 502 | 461 | 2.8 |
| 2019 Q4 | 16,296 | 457 | 395 | 2.4 |
| 2020 Q1 | 15,390 | 404 | 366 | 2.4 |
| 2020 Q2 | 13,017 | 139 | 126 | 1.0 |
| 2020 Q3 | 14,167 | 180 | 162 | 1.1 |
Data Sources and Quality: These figures have been drawn from the HMPPS Incident Reporting System. Care is taken when processing and analysing returns but the detail is subject to the inaccuracies inherent in any large scale recording system. Although shown to the last case, the figures may not be accurate to that level.
3. Assaults: 12 months to September 2020
| Assaults and serious assaults decreased from the previous 12-month period. | In the 12 months to September 2020, there were 24,407 assault incidents, a 27% decrease from the previous 12 months. Of these 2,734 were serious assaults, down by 30%. Assaults increased by 9% in the latest quarter to 4,956 incidents, and the number of serious assaults increased by 16% to 529 incidents. |
| Assaults on staff decreased from the previous 12-month period. | There were 8,476 assaults on staff in the 12 months to September 2020, a 16% decrease from the previous 12 months. In the latest quarter the number of assaults on staff remained steady at 1,897 incidents. |
Statistics for the 12 months to September, and particularly those for the April to June quarter, relate to the exceptional period since the start of the Covid-19 pandemic and the restricted regimes prisons put in place in order to safely manage the risks of infection during the pandemic (see Further Information). This affects the comparability of the statistics with earlier periods.
Figure 5: Quarterly 12-month rolling rate of total assaults by gender of establishment, 12 months ending September 2010 to 12 months ending September 2020, with quarterly rates
In the 12 months to September 2020, assault incidents decreased by 27% to 24,407, a rate of 299 incidents per 1,000 prisoners. In the latest quarter, there were 4,956 assaults, an increase of 9% from the previous quarter. The quarterly figure reached a peak of 9,111 in the July to September 2018 quarter. It has continued on a downward trend since then, with a rise in the latest quarter.
The number of incidents in male establishments decreased by 27% from 31,792 to 23,301 in the 12 months to September 2020. The number of incidents in female establishments decreased by 27% from 1,516 to 1,106 incidents in the same period.
In the latest quarter, the number of assaults in male establishments increased by 9% to 4,720, and the number of assaults in female establishments increased by 17% to 236. Assault rates were similar in both male establishments (299 incidents per 1,000 prisoners) and female establishments (316 incidents per 1,000 prisoners) in the latest 12 months, although the assault rate was higher in female establishments for the first time in the time series.
Figure 6: Quarterly 12-month rolling rate of prisoner-on-prisoner assaults and assaults on staff, 12 months ending September 2010 to 12 months ending September 2020, with quarterly rates
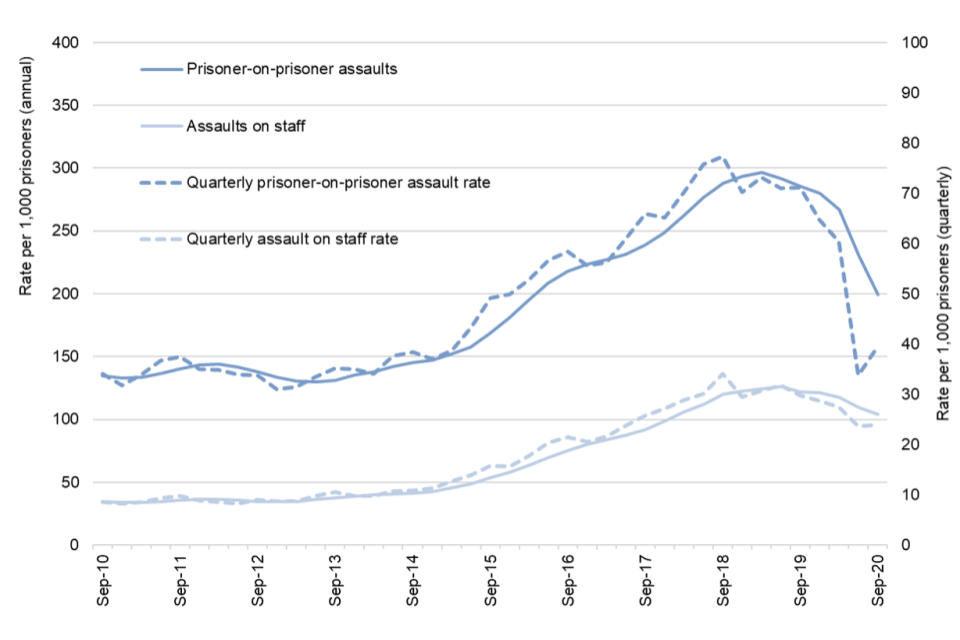
There were 16,258 prisoner-on-prisoner assaults[footnote 10] in the 12 months to September 2020 (a rate of 199 per 1,000 prisoners). This is a decrease of 31% from the 23,653 assaults in the previous 12 months. In the latest quarter, there were 3,126 prisoner-on-prisoner assaults, a 15% increase from 2,711 in the previous quarter.
There were 8,476 assaults on staff[footnote 11] in the 12 months to September 2020 (a rate of 104 per 1,000 prisoners). This is a 16% decrease from the 10,081. In the latest quarter assaults on staff remained level to the previous quarter at 1,897 incidents.
The proportion of assaults on staff increased to 35% of all incidents in the 12 months to September 2020, from 30% in the previous 12 months, having steadily increased from 20% in the 12 months to September 2012.
In male establishments, prisoner-on-prisoner assaults decreased by 31% to 15,714 incidents (201 incidents per 1,000 male prisoners), and assaults on staff decreased by 16% to 7,907 incidents (101 incidents per 1,000 male prisoners) in the 12 months to September 2020 compared to the previous 12 months.
In female establishments, prisoner-on-prisoner assaults decreased by 39% to 544 incidents (156 incidents per 1,000 female prisoners), and assaults on staff decreased by 10% to 569 incidents (163 incidents per 1,000 female prisoners) in the 12 months to September 2020 compared to the previous 12 months.
The proportion of assaults on staff in female establishments (51%) was higher than the proportion in male establishments (34%) in the 12 months to September 2020. Assault rates on staff have historically been higher in female establishments than male establishments.
Figure 7: 12 month rolling rate of assault incidents per 1,000 prisoners by youth offenders, 12 months ending March 2014 to 12 months ending September 2020, with quarterly rates
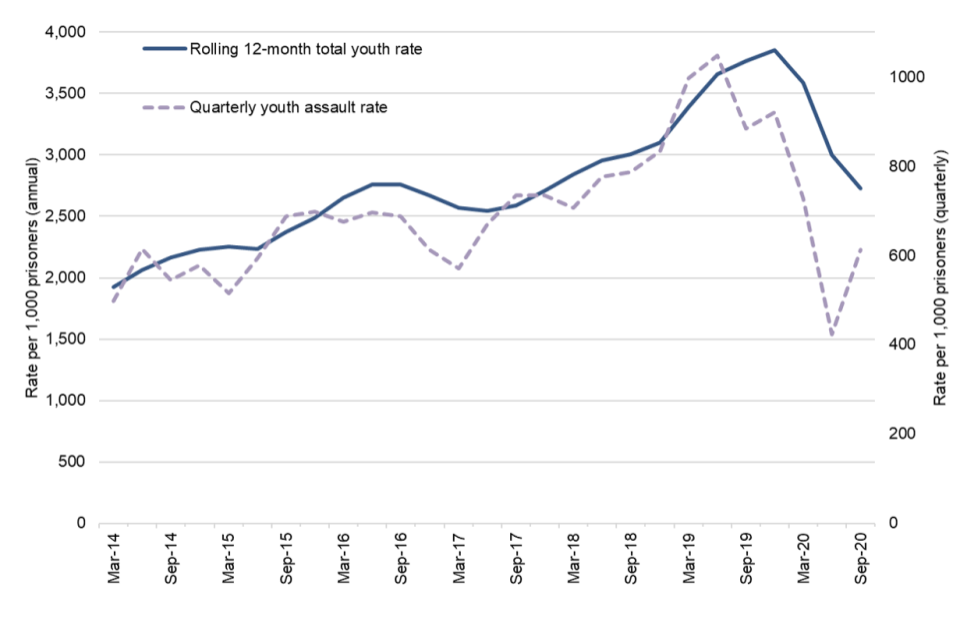
In youth estate, the number of assaults decreased by 39% from 2,477 in the 12 months to September 2019 to 1,515 in the 12 months to September 2020, and the assault rate decreased by 28% across the same period, from 3,765 per 1,000 prisoners in the previous 12 months to 2,727 per 1,000 in the latest 12 months.
In the latest quarter there were 292 assault incidents, a 31% increase from 223 incidents in the previous quarter, and a 47% decrease from the same quarter the previous year (July to September 2019).
Prisoner-on-prisoner assaults decreased by 44% in the youth estate, from 1,763 in the previous 12 months to 989 in the 12 months to September 2020. Prisoner on staff assaults decreased by 28%, from 799 in the previous 12 months to 579 in the 12 months to September 2020.
4. Serious Assaults
| Of the 24,407 assault incidents, 2,734 (11%) were serious. | In the 12 months to September 2020, there were 2,734 serious assault incidents, a 30% decrease from the previous 12 months. Serious prisoner-on-prisoner assaults decreased by 34% to 1,958 in the 12 months to September 2020, and serious assaults on staff decreased by 15% to 823. |
Serious assaults are those which fall into one or more of the following categories: a sexual assault; requires detention in outside hospital as an in-patient; requires medical treatment for concussion or internal injuries; or incurs any of the following injuries: a fracture, scald or burn, stabbing, crushing, extensive or multiple bruising, black eye, broken nose, lost or broken tooth, cuts requiring suturing, bites, temporary or permanent blindness.
Figure 8: Quarterly 12-month rolling rate of total serious assaults, serious prisoner-on-prisoner assaults, and serious assaults on staff, 12 months ending September 2010 to 12 months ending September 2020
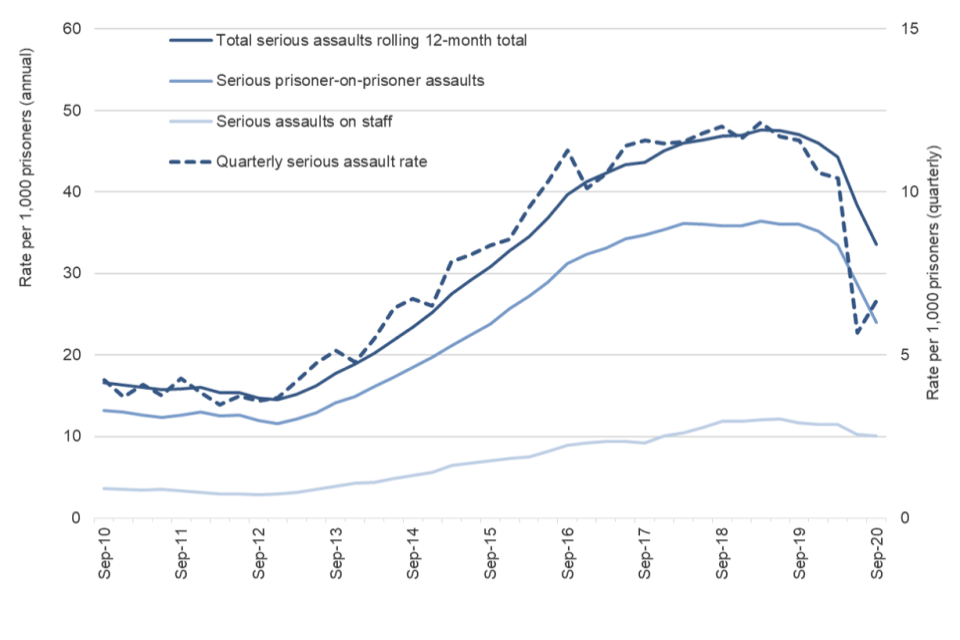
In the 12 months to September 2020, there were 2,734 serious assaults (a rate of 34 per 1,000 prisoners), a 30% decrease from the previous 12 months. In the latest quarter, there were 529 serious assaults, a 16% increase from the previous quarter. In the latest 12 months, 11% of assaults were serious assaults.
There were 1,958 serious prisoner-on-prisoner assaults (a rate of 24 per 1,000 prisoners) in the 12 months to September 2020, a decrease of 34% from the previous 12 months. In the latest quarter, there were 344 serious prisoner-on-prisoner assaults, a 12% increase from 306 incidents in the previous quarter.
There were 823 serious assaults on staff (a rate of 10 per 1,000 prisoners) in the 12 months to September 2020, a decrease of 15% from the previous 12 months. In the latest quarter, the number of serious prisoner-on-staff assaults increased by 27% to 198 incidents.
In youth estate, there was a 32% decrease in serious assaults from 125 in the 12 months to September 2019 to 85 in the 12 months to September 2020. There was also a 42% decrease in serious prisoner-on-prisoner assaults across the same period, from 62 to 36, and a 26% decrease in serious assaults on staff, from 72 in the previous 12 months to 53 in the 12 months to September 2020.
5. Key findings from deaths annual tables
Gender
The majority of deaths in custody in 2020 (98%) occurred in the male estate, a finding that has been consistent over time.
- There were 7 deaths in the female estate, down from 8 in 2019, accounting for around 2% of the total deaths. As a result, the cross-tabulations of characteristics with gender (e.g. age by gender, ethnicity by gender, etc.) are not presented below because they would be statistically meaningless and potentially misleading.
Age
Prisoners aged 60 and over were more likely to die in custody compared to any other age group, with 32.15 incidents per 1,000 prisoners, with the number of deaths in this age group being higher (161) than in 2019 (112).
- Out of 161 deaths amongst this age group, 155 were classified as natural causes, 4 was self-inflicted and 2 are awaiting further information. Those aged over 50 accounted for 89% of all natural cause deaths in 2020, and the age group with the majority of all natural cause deaths were aged 60 or over (75%).
Self-inflicted deaths were the most frequent in the age groups 30-39 and 40-49, accounting for 25% and 27% of all incidents, respectively.
- Prisoners aged 50 – 59 had the highest rate of self-inflicted deaths, at a rate of 1.32 per 1,000 prisoners, and the number of self-inflicted deaths decreased for all age groups except 21-24 and 60+ between 2019 and 2020.
Ethnicity
The rate of self-inflicted deaths in 2020 was higher amongst White prisoners (0.99 per 1,000 prisoners) than BAME prisoners (0.46 per 1,000 prisoners)
- The rate of self-inflicted deaths decreased from 1.25 in 2019 to 0.99 in 2020 for White prisoners, and stayed level for BAME prisoners.
Nationality
UK nationals were more likely than foreign nationals, to suffer a self-inflicted death in 2020, with rates of 0.84 and 0.53 per 1,000 prisoners, respectively.
- Self-inflicted deaths among foreign nationals accounted for 12% of all self-inflicted deaths, while UK nationals accounted for 88%.
Time in custody
The first few days in custody are particularly high-risk in terms of self-inflicted deaths. In 2020, 14 (21%) of all self-inflicted deaths occurred within the first 30 days of custody, of which, 7 (50%) occurred within the first week.
- The first few days in custody after moving between prisons show a similar risk. In 2020 when including prisoners who have moved, 23 (34%) self-inflicted deaths occurred within the first 30 days in the current prison, of which 10 (43%) occurred within the first week.
Sentence length and type
The largest proportion of self-inflicted deaths in 2020 were prisoners serving a determinate sentence (72%), the rate of self-inflicted deaths per 1,000 prisoners serving a determinate sentence was 0.83.
- For prisoners who were serving a determinate sentence, those who were sentenced to less than 6 months had the highest rate, at 3.24 self-inflicted deaths per 1,000 prisoners.
Prisoners who were on remand (1.66 per 1,000 prisoners) had a higher rate of self-inflicted deaths than those serving life (0.55 per 1,000 prisoners), determinate sentences (0.83 per 1,000 prisoners) and indeterminate sentences (1.03 per 1,000 prisoners).
- There were no incidents of self-inflicted deaths in prisoners who were convicted unsentenced.
Offence
In 2020, 39% of self-inflicted deaths were by prisoners charged or sentenced to offences of violence against the person.
- Prisoners who were serving sentences for offences of violence against the person (39%), sexual offences (18%), robbery (15%) and theft (10%) accounted for the majority (82%) of self-inflicted deaths.
Method of self-inflicted death
Hanging remains the most common method of self-inflicted death for both males and females in 2020, accounting for 82% of all incidents.
- Of the 61 self-inflicted deaths with method of hanging or self-strangulation in 2020, bedding remains the most commonly used ligature type with 77% of incidents using this. The most commonly used ligature point remains the window, accounting for 41% of all self-inflicted hanging or self-strangulation deaths in 2020, while the second highest used ligature point was bed, accounting for 23%.
6. Further information
6.1 Covid-19
Since the start of the COVID-19 pandemic, there has been keen public and Parliamentary interest in how the Ministry of Justice (MOJ) and Her Majesty’s Prisons and Probation Service (HMPPS) are managing the running of prisons and the probation system to limit the spread of the virus while maintaining the core functions of these vital parts of the justice system. The core tenet of HMPPS’s prison strategy, building on Public Health England (PHE) and Public Health Wales (PHW) advice and learning developed in managing an early outbreak of the virus, is the implementation of effective isolation, reverse cohorting of new entrants to custody, and shielding of vulnerable prisoners. In addition, HMPPS have reduced the movement of prisoners and staff between prisons to prevent the “seeding and feeding” of infection, and have restricted regimes to prevent social contact in custody.
The latest COVID figures are published monthly on the MOJ website via the following link:
6.2 Accompanying files
As well as this bulletin, the following products are published as part of this release:
-
A technical guide providing further information on how the data are collected and processed, as well as information on the revisions policy and legislation relevant to sentencing trends and background on the functioning of the criminal justice system.
-
A set of summary tables for the latest quarter, and annual tables up to the latest calendar year.
-
Underlying data files with pivot tables, giving lower level granularity.
6.3 National Statistics status
National Statistics status means that official statistics meet the highest standards of trustworthiness, quality and public value.
All official statistics should comply with all aspects of the Code of Practice for Official Statistics. They are awarded National Statistics status following an assessment by the UK Statistics Authority’s (UKSA) regulatory arm. The UKSA considers whether the statistics meet the highest standards of Code compliance, including the value they add to public decisions and debate.
It is the Ministry of Justice’s responsibility to maintain compliance with the standards expected for National Statistics. If we become concerned about whether these statistics are still meeting the appropriate standards, we will discuss any concerns with the UKSA promptly. National Statistics status can be removed at any point when the highest standards are not maintained, and reinstated when standards are restored.
Our statisticians regularly review the content of publications. Development of new and improved statistical outputs is usually dependent on reallocating existing resources. As part of our continual review and prioritisation, we welcome user feedback on existing outputs including content, breadth, frequency and methodology. Please send any comments you have on this publication including suggestions for further developments or reductions in content.
the methodology for the youth estate figures will be changed from the April 2021 release, and will be calculated based on the prison rate than the age of the prisoner. For respond to the following e-mail address if you have any comments - ESD@justice.gov.uk
6.4 Contact
Press enquiries should be directed to the Ministry of Justice press office: Tel: 020 3334 3536 Email: newsdesk@justice.gsi.gov.uk
Other enquiries about these statistics should be directed to:
David Dawson
Prisons and Probabtion Analytical Services,
Ministry of Justice,
102 Petty France,
London,
SW1H 9AJ
Email: statistics.enquiries@justice.gsi.gov.uk
Next update: April 2021 URL: http://www.gov.uk/government/collections/safety-in-custody-statistics
© Crown copyright Produced by the Ministy of Justice. Alternative formats are available on request from statistics.enquiries@justice.gsi.gov.uk
-
Data on deaths is published three months ahead of self-harm and assaults. Therefore, the deaths annual publication and tables are published alongside the Safety in Custody quarterly update to September publication. ↩
-
Data on deaths are published three months ahead of assaults and self-harm, therefore, the annual publication Deaths in prison custody for 1978 to 2020 is published in the Safety in Custody quarterly update to September 2020 https://assets.publishing.service.gov.uk/government/uploads/system/uploads/attachment_data/file/861738/deaths-prison-custody-1978-2019.xlsx ↩
-
Annual self-harm statistics published in the Safety in Custody quarterly update to December 2019 https://assets.publishing.service.gov.uk/government/uploads/system/uploads/attachment_data/file/893374/safety-in-custody-q4-2019.pdf ↩
-
Youth estate includes all 15 to 18-year olds in Young Offender Institutes, and all 15 to 17-year olds in Youth Prisons. ↩
-
Figures include incidents at HMPPS operated Immigration Removal Centres and during contracted out escorts. ↩
-
Figures do not include incidents at Medway STC. For more information on Secure Training Centres, please see Youth justice annual statistics at https://www.gov.uk/government/collections/youth-justice-annual-statistics ↩
-
In prisons, as in the community, it is not possible to count self-harm incidents with absolute accuracy. In prison custody, however, such incidents are more likely to be detected and counted. Care needs to be taken when comparing figures shown here with other sources where data may be less complete. ↩
-
Prior to April 2020 incidents described as ‘noose: ligature making’ which relates to occasions on which material that was believed to have been fashioned into a noose was seen by staff, but there was no suggestion that it had been placed around the neck or attached to a ligature point, or had any weight or tension applied to it were included. From April 2020, these have now been excluded, but incidents where there is any suggestion that the noose has been placed around the neck or attached to a ligature point, or had any weight or tension applied to it continue to be included. ↩
-
Figures for all noose making include incidents where other types of self-harm also occurred, such as cutting, burning, self-suffocation. ↩
-
This figure includes any prisoner-on-prisoner assaults where there may also have been an assault on staff. ↩
-
There was a change in how staff assaults have been recorded from April 2017, this has simplified how incidents involving staff are identified, however it is possible this has increased the recording of incidents. Please see the Guide to Safety in Custody statistics for further information. ↩