Public attitudes to trade tracker: wave 2 report (web version)
Published 10 August 2020

© Crown copyright 2020
This publication is licensed under the terms of the Open Government Licence v3.0 except where otherwise stated. To view this licence, visit nationalarchives.gov.uk/doc/open-government-licence/version/3 or write to the Information Policy Team, The National Archives, Kew, London TW9 4DU, or email: psi@nationalarchives.gov.uk.
Where we have identified any third party copyright information you will need to obtain permission from the copyright holders concerned.
This publication is available at https://www.gov.uk/government/publications/public-attitudes-to-trade-tracker-patt-wave-2/public-attitudes-to-trade-tracker-wave-2-report-web-version
Executive summary
Background and methodology
In September 2018 DIT commissioned a nationally representative survey of the UK public to examine public attitudes towards trade and to understand the public’s priorities as they relate to trade policy, and how these may change over time. This report details findings from the second wave of the Department for International Trade’s public attitudes to trade tracker. Following on from wave one - conducted between 1 October 2018 and 1 January 2019 - wave two fieldwork took place between 10 June 2019 and 13 August 2019.
Identical to the approach taken at wave one, the research followed a mixed mode approach encompassing post-to-online invites and face-to-face interviews administered via Computer-Assisted Self Interviewing (CASI) interviews. A total of 2,349 interviews were conducted, a figure which incorporates sampling boosts in each of the devolved nations in the UK. Following the completion of fieldwork, the data was weighted to maximise representativeness to the UK population. Whilst there were some additions and changes to the questionnaire, the majority of the questions remained the same between waves, allowing findings to be tracked over time.
Key findings within this executive summary are organised under 3 headings. Firstly, findings without statistically significant shifts in sentiment between waves are outlined. Secondly, the summary covers findings where significant shifts in sentiment between wave one and wave two have been detected. Finally, key findings from newly included questions which did not feature in wave one are outlined.
What remains consistent from wave one?
Levels of interest in trade remain stable
There have been no statistically significant shifts in proportions interested in how the UK trades with countries inside and outside the European Union (EU). Interest in how the UK trades with countries inside the EU was 66% in wave one versus 67% in wave two. Interest in trade with countries outside the EU was 66% in wave one versus 68% in wave two.
Self-reported levels of knowledge about trade are also consistent with wave one
There have been no statistically significant shifts in proportions feeling knowledgeable about how the UK trades with countries inside and outside the EU. The proportion of the respondents feeling knowledgeable about UK trade with countries inside the EU was the same in both waves (42%). The same can be said for the proportion of the respondents feeling knowledgeable about how the UK trades with countries outside the EU (34% in wave two versus 35% in wave one).
Support for free trade agreements generally is unchanged
Two thirds of respondents (66%) said they were supportive of free trade agreements, consistent with wave one.
There has been no change in perceptions as to the overall impact signing free trade agreements will have on the UK overall or on respondents’ daily lives
Consistent with wave one, just under two thirds think that signing free trade agreements outside the EU would have a positive impact on the UK overall (63% versus 62% in wave one). Likewise, just over half continue to think that the effect will also be positive on their daily lives (54% in wave two, versus 54% in wave one).
Awareness of the Comprehensive and Progressive Trans-Pacific Partnership (CPTPP) has not changed
Just over one fifth reported having heard something about the agreement (22%), in line with wave one (21%).
Support for the UK potentially joining Comprehensive and Progressive Agreement for Trans-Pacific Partnership (CPTPP) also remains stable
Among those that reported having heard of the CPTPP, support for the UK joining the agreement remains stable (47% versus 51% in wave one).
What has changed since wave one?
There has been a decline in the proportion who think increased free trade will lead to higher number of jobs
42% said that increased free trade will lead to a higher number of jobs in the UK, down from 51% in wave one. There is also a decline in the numbers who say that increased free trade will lead to more jobs in their local area from 38% in wave one to 33% in wave two.
There has been a decline in the proportion who think increased free trade will lead to higher wages
A quarter (25%) said that increased free trade will lead to higher wages in the UK, a decline of eight percentage points. There is also a decline of seven percentage points in the numbers who say that increased free trade will result in higher wages in their local area, from 28% in wave one to 21% in wave two.
There has been an increase in the share who believe increased free trade will lead to lower quality goods and services
17% said they thought increased free trade would lead to lower quality goods and services, up from 12% in wave one. However, perceptions about increased free trade’s impact on prices remain stable.
Support for establishing free trade agreements with selected countries (Australia, New Zealand, USA, China, and India) remains broadly high, but has declined for each country between five and seven percentage points between waves
A majority remain supportive in the case of each country with the exception of China (46%) and there were no significant increases in opposition between waves.
What is new at wave two?
Many claim that they have seen, read or heard something about the process of ‘rolling over’ existing trade agreements (DIT’s trade agreement continuity (TAC) programme)
Over two thirds (69%) of respondents who felt they were very or fairly knowledgeable about trade reported also having read, seen or heard something about the process. However, when those that reported having heard of this process were asked which agreements they had heard of being rolled over, some 44% were unsure of a specific country, with many also naming countries where no agreements have been rolled over.
Respondents were more likely to say they thought the government should prioritise both rolling over existing trade agreements and preparing for new trade agreements, rather than prioritising one over the other
Just over two in five (42%) reported these as equal priorities, whereas others felt making sure the trade agreements the UK has through EU membership continue was a priority (26%), one in five (19%) felt creating new trade agreements with other countries should be prioritised[footnote 1].
Compared to each of the other countries listed, more respondents said they felt that Japan produces good quality consumer goods
Close to two in three respondents (64%) described the quality of consumer goods from Japan as good quality. This compares, for example, to 55% for the USA and 27% for India. There is a relationship between believing the quality of consumer goods from a specific country is high, and supporting the UK establishing a free trade agreement with that country.
Background and methodology
Background, context and research objectives
Since its creation in July 2016 the Department for International Trade (DIT) is responsible for:
- supporting UK businesses to grow internationally in a sustainable way
- ensuring the UK remains a leading destination for international investment and maintains its number one position for international investment stock in Europe
- opening markets, building a trade framework with new and existing partners which is free and fair
- using trade and investment to underpin the government’s agenda for a Global Britain and its ambitions for prosperity, stability and security worldwide
- building DIT as an effective international economic department where our people are expert, enterprising, engaged and inclusive
DIT views the UK public as an important group of stakeholders and the Public Attitudes to Trade Tracker has been designed to help ensure that the public’s views are considered during the policy making process.
With this in mind, in September 2018 DIT commissioned the first wave of a nationally representative survey of the UK public to examine public attitudes towards trade, to understand the public’s priorities as they relate to trade policy and to track how these may change over time.
Fieldwork for wave two was conducted between 10 June and 13 August 2019. Wave one of the research concluded in January 2019, with final reports published by DIT in July 2019[footnote 2]. This report outlines findings from the second wave of the research (wave two), with results for questions asked in both waves tracked throughout.
With waves one and two now complete, it is intended that future cross-sectional studies will take place so that public attitudes to trade can continue to be tracked over time.[footnote 3]
Overview of methodology
To ensure that results can be tracked robustly, the approach and methodology at wave two was entirely consistent with that used at wave one. Full details can be found in the published technical report.[footnote 4]
The research followed a mixed mode approach encompassing post-to-online invites and face-to-face interviews administered via Computer-Assisted Self Interviewing (CASI) interviews. Importantly, to ensure consistency, both methodologies rely on respondents self-completing survey questions, thereby reducing possible biases related to mode and interviewer effects.[footnote 5]
Following considerable work developing the questionnaire in advance of wave one, most of the questions included in the questionnaire at wave two remained identical, with a similar order and structure of sections so as to minimise potential order effects.[footnote 6]
However, a number of additions and changes were made at wave two, including:
- additional questions which examined respondents’ awareness and priorities as they relate to the process of trade agreement continuity
- new questions exploring respondents’ perceptions as to the quality of consumer goods in a variety of countries
- building on what was asked at wave one, the questionnaire explored respondents’ priorities for free trade agreements with individual countries, as opposed to priorities for free trade agreements more generally
- a question exploring whether respondents believe the economy will improve, worsen, or stay about the same over the course of the next 12 months
As was the case in advance of wave one, BMG conducted a round of cognitive testing with members of the public in order to review the question wording and structure of new or substantially altered questions.[footnote 7] Upon review of themes emerging from the cognitive interviews, small textual changes were made before a final draft of the questionnaire was concluded.
More details about the methodology used for each approach are outlined below[footnote 8]:
Face-to-face CASI interviews: 1,219 interviews (52% of the sample) were conducted using a computer-assisted self-interview (CASI) methodology. Initial screening questions were conducted by the field interviewer, after which a tablet device was handed over to the respondent who then completed the survey themself without interviewer involvement.[footnote 9]
The face-to-face sample was constructed using a random locational quota design within 100 Lower Super Output Areas. Selection was conducted by stratifying by region and other key variables. This component of the design targeted poorly connected and low-responding hard-to-reach groups and also included sampling boosts in each of the devolved nations.
Post-to-online: The post-to-online sample was selected via a stratified random probability design proportional to the population. Postal invites were sent to 6,120 randomly selected addresses, 1,130 respondents (48% of the sample) completed the survey, representing a response rate of 19%.
Prospective respondents were provided with a link to the online survey in their invitation letter. The survey was created on software designed to maximise accessibility by ensuring compatibility across devices, including tablet devices and smartphones.
In order to ensure sufficient base sizes to allow reliable analysis, the number of invites were boosted in each of the devolved nations.
Following the completion of fieldwork, the data was weighted to maximise representativeness to the UK population, with the weighting approach entirely consistent with that used at wave one.
The weighting targets were as follows:
- age
- gender
- government office region
- Indices of Multiple Deprivation (IMD)[footnote 10]
- 2016 EU referendum vote
All targets were ascertained using official population statistics released by the ONS and the Electoral Commission’s official published 2016 Referendum results. Table 3.1, below, shows the combined weighted and unweighted base sizes for wave one and wave two by region.
Table 3.1: Total combined completes
| Region | Wave 1: unweighted counts | Wave 2: unweighted counts | Wave 1: weighted counts | Wave 2: weighted counts |
|---|---|---|---|---|
| England | 1,819 | 1,747 | 2,017 | 1,973 |
| Scotland | 202 | 202 | 202 | 198 |
| Wales | 213 | 203 | 115 | 113 |
| Northern Ireland | 166 | 197 | 66 | 65 |
| Total | 2,400 | 2,349 | 2,400 | 2,349 |
Contents and structure of report
The findings outlined in the report are structured under the following headings:
Interest, knowledge and engagement:
Firstly, we examine survey respondents’ interest in the subject of trade, their knowledge of trade-related issues, and how these compare to the results observed at wave one.
Awareness and support for free trade agreements and perceived impact:
Next, the report explores levels of support for free trade and how this compares to wave one, examines which demographic groups are more likely to be supportive of free trade agreements, and looks at perceptions as to the impact of free trade in various areas. Awareness of and support for the CPTPP are explored, with results compared to those observed at wave one. This is followed by an examination of respondents’ awareness and priorities as they relate to TAC.
Trade partner preferences:
Next, the report examines levels of support for trade agreements and how these have changed since wave one. This section also includes analysis of the traits and characteristics that respondents view as important for potential trading partners to possess with respect to specific countries of interest.
Presentation of results
Outlined below are a series of rules and conventions to assist when reading and interpreting the data outlined in this report:
Section Structure:
To encourage clarity and to ensure that the conclusions that have been reached from the data are clear, each section of the report is structured around what can be viewed as the main findings. Each of the main findings acts as a heading under which further detail and analysis is provided.
Rounding:
The data used in this report are rounded up or down to the nearest whole percentage. It is for this reason that, on occasion, tables or charts may add up to 99% or 101%. Where tables and graphics do not match exactly the text in the report this occurs due to the way in which figures are rounded up (or down) when responses are combined. Results that do differ in this way should not have sum-total deviance that is larger than around 1 to 2%.
Sample:
The sample was designed to be representative of the UK public. Findings refer to ‘respondents’, rather than residents or the general public. However, findings can be considered to be indicative of the wider UK public’s views.
Base sizes:
Results are based on all respondents unless otherwise specified. Where results for sub-groups have been used in charts, their relevant base sizes are shown in parentheses after the description of the sub-group. Otherwise, base sizes are detailed in the notes at the bottom of each figure and table.
Annotation:
In the tables and charts contained in this report, a * symbol denotes a proportion that is less than 0.5%, but greater than zero.
Open responses:
Figures reporting on questions asked in an open response format have been labelled as such in the notes located at the bottom of each figure.
Statistical Significance:
Throughout this report, the term “significant” is only used to describe differences between particular groups that are statistically significant to 95% confidence. This means that there is only a 5% probability that the difference has occurred by chance (a commonly accepted level of probability), rather than being a ‘real’ difference.
Unless specified, all statistics are compared against the total.
Where a result is significantly higher than the average, or when compared to results observed at wave one, charts in this report will be marked with an upward-facing arrow symbol.
Where a result is significantly lower than the average, or when compared to results observed at wave one, charts in this report will be marked with a downward-facing arrow symbol.
The focus of the report is to report findings where statistically significant differences have been identified. Where differences between waves one and two are discussed during the commentary, these differences can all be presumed to be statistically significant unless otherwise noted.[footnote 11]
It is important to note that the face-to-face CASI interviews relied on quota sampling. There are a number of potential issues with using formal statistical significance tests on quota sample data including bias and lack of known sampling probability. Therefore, it is advised that any results of statistical significance tests are used as a guide and should always be interpreted with a degree of caution.[footnote 12]
Interest, knowledge and engagement
Background
At the outset of the survey, respondents were asked a series of questions designed to measure their levels of interest in, knowledge of, and engagement with the subject of trade.
Consistent with wave one, these areas were principally explored at the beginning of the survey in order to ensure that responses were not artificially ‘primed’ by other survey questions.
It should be noted that responses to questions designed to measure interest and engagement around a subject, particularly those that relate to politics, are often influenced by social desirability bias.[footnote 13] It may widely be considered desirable to be seen as interested or knowledgeable on topical issues and current affairs, so it is possible that respondents may overstate their interest or knowledge of such issues when responding to survey questions. The results discussed below should therefore be treated with this cautionary note in mind.
Interest in trade
When examining what is referred to as levels of ‘interest’ in trade, we are referring to the general levels of desire to give the subject of trade further attention and thought. We may, therefore, consider that a respondent who reports high levels of interest may be more likely to actively explore materials or news stories that relate to free trade in more detail.
Interest levels in how the UK trades with countries in and outside of the European Union remain consistent.
Consistent with our approach at wave one, in order to examine interest levels around the subject of trade, respondents were separately asked about the extent to which they were interested in how the UK trades with EU countries and non-EU countries. This featured alongside a list of other topics of potential public interest: the UK economy; the UK’s approach to environmental issues; and UK foreign affairs.
A total of 68% of respondents said they felt interested in how the UK trades with countries inside the European Union, as did 67% who said they feel interested in how the UK trades with countries outside the European Union. This includes around one in four respondents who stated they are ‘very interested’ in how the UK trades with countries both inside (24%) and outside the EU (23%).
As Figure 4.1 illustrates, these proportions are consistent with reported levels of interest observed at wave one, with no significant shifts in the proportions interested between wave one and wave two. Indeed, of all of the areas listed, the only topic where there has been a statistically significant shift in interest levels is with respect to the UK’s approach to environmental issues, with the proportions saying they are very or fairly interested increasing by 4 percentage points, from 72% to 75%.
Figure 4.1: levels of interest observed in waves one and two
How the UK trades with countries outside the European Union
| Wave | Very interested | Fairly interested | Not very interested | Not at all interested |
|---|---|---|---|---|
| Wave 2 | 23% | 45% | 22% | 10% |
| Wave 1 | 23% | 43% | 24% | 10% |
How the UK trades with countries in the European Union
| Wave | Very interested | Fairly interested | Not very interested | Not at all interested |
|---|---|---|---|---|
| Wave 2 | 24% | 44% | 22% | 11% |
| Wave 1 | 24% | 43% | 23% | 11% |
The UK’s approach to environmental issues
| Wave | Very interested | Fairly interested | Not very interested | Not at all interested |
|---|---|---|---|---|
| Wave 2 | 33% | 43% | 16% | 8% |
| Wave 1 | 31% | 41% | 19% | 10% |
UK foreign affairs
| Wave | Very interested | Fairly interested | Not very interested | Not at all interested |
|---|---|---|---|---|
| Wave 2 | 23% | 41% | 16% | 8% |
| Wave 1 | 21% | 44% | 24% | 11% |
The UK economy
| Wave | Very interested | Fairly interested | Not very interested | Not at all interested |
|---|---|---|---|---|
| Wave 2 | 34% | 42% | 15% | 9% |
| Wave 1 | 34% | 42% | 15% | 9% |
Those who are older, in higher socio-economic grades, or are degree educated continue to be more likely to report being interested in how the UK trades with countries outside the EU.
By analysing responses across demographic groups, consistent patterns emerge in terms of the groups more likely to report being interested in how the UK trades with countries outside the EU. Figure 4.2 below charts interest levels among demographic groups on the question of interest in how the UK trades with countries outside the EU.[footnote 14]
Consistent with wave one, respondents are more likely to report being interested if they:
- are in higher socio-economic grades (SEG): 83% of those in SEG classifications AB, say they are either very or fairly interested. This compares to 60% in SEG DE classification (60%)[footnote 15]
- are older: respondents in older age groups are more likely to report being interested. Around half those aged 16 to 34 say they are interested (54%), which compares to three quarters of those aged 55 and over (76%)
- have obtained degree level qualifications: 84% of those with at least an undergraduate degree level of education report being interested, which is almost double the rate of those without qualifications (48%)
- are men: By a margin of 9 percentage points, men (73%) are significantly more likely than women (64%) to report being interested.[footnote 16] That said, the proportion of women who reported being interested did increase significantly between wave one (60%) and wave two (64%)
Figure 4.2: Interest levels across key groups
| Overall (respondents) | Interest level |
|---|---|
| Total (2,349) | 68% |
| Gender (respondents) | Interest level |
|---|---|
| Male (1,188) | 73% (up) |
| Female (1,124) | 64% (down) |
| Age groups (respondents) | Interest level |
|---|---|
| 55+ (928) | 73% (up) |
| 35 to 54 (787) | 64% (up) |
| 16 to 34 (601) | 54% (down) |
| Socio economic grade (SEG) (respondents) | Interest level |
|---|---|
| DE (847) | 60% (down) |
| C1C2 | 64% (down) |
| AB (702) | 83% (up) |
| Income (respondents) | Interest level |
|---|---|
| Less than £19,999 (500) | 63% (down) |
| £20,000 to £39,999 (618) | 69% |
| £40,000 to £59,999 (277) | 79% (up) |
| More than £60,000 (350) | 87% (up) |
| Qualifications (respondents) | Interest level |
|---|---|
| No qualifications (222) | 48% (down) |
| Non-degree (1,114) | 64% (down) |
| Degree or above (820) | 84% (up) |
IK1: How interested would you say you are in….? How the UK trades with countries outside the European Union Proportions stating that they are very or fairly interested.
Significant differences against the average result for wave two are indicated with (up) and (down).
Base sizes provided in parenthesis.
Knowledge of free trade
An important research objective was to explore how knowledgeable respondents felt about free trade and trade related issues. Knowledge was explored by measuring of self-reported knowledge, asking to what extent respondents reported feeling knowledgeable about free trade.
Self-reported knowledge levels are consistent with wave one
Just as interest in how the UK trades with countries inside and outside the European Union has remained consistent, there have been no significant changes with respect to levels of self-reported knowledge between wave one and wave two (see Figure 4.3). Consistent with wave one, whilst around two-thirds do indicate that they are interested in how the UK trades with other countries, a minority say they feel knowledgeable. The results, therefore, continue to indicate something of a ‘knowledge gap’ between levels of interest and levels of knowledge.
Around one third (34%) of respondents said they feel knowledgeable about how the UK trades with countries outside the EU (versus 35% at wave one). Slightly more, some 42%, say they feel knowledgeable about how the UK trades with countries in the European Union (versus 42% at wave one). This continues to be lower than the proportion who said they felt knowledgeable about UK foreign affairs, the UK’s approach to environmental issues, and the UK economy (45%, 54%, and 55% respectively)
Mirroring the trend seen in relation to interest levels, the only area where we witness a significant change in self-reported knowledge levels is with respect to the UK’s approach to environmental issues. The proportion saying they feel knowledgeable has risen by 5 percentage points, from 49% at wave one to 54% in wave two. It is worth noting that caution should be taken on these levels of knowledge as they are self-reported, rather than accurate and reliable measures of actual knowledge.
Figure 4.3: Self-reported knowledge of how the UK trades with other countries relative to other subjects
How the UK trades with countries outside the European Union
| Wave | Very interested | Fairly interested | Not very interested | Not at all interested |
|---|---|---|---|---|
| Wave 2 | 4% | 31% | 49% | 17% |
| Wave 1 | 4% | 31% | 48% | 18% |
How the UK trades with countries in the European Union
| Wave | Very interested | Fairly interested | Not very interested | Not at all interested |
|---|---|---|---|---|
| Wave 2 | 5% | 36% | 42% | 16% |
| Wave 1 | 6% | 36% | 42% | 16% |
The UK’s approach to environmental issues
| Wave | Very interested | Fairly interested | Not very interested | Not at all interested |
|---|---|---|---|---|
| Wave 2 | 6% | 48% (up) | 35% (down) | 12% |
| Wave 1 | 6% | 42% | 39% | 13% |
UK foreign affairs
| Wave | Very interested | Fairly interested | Not very interested | Not at all interested |
|---|---|---|---|---|
| Wave 2 | 6% | 40% | 37% (down) | 18% |
| Wave 1 | 6% | 37% | 41% | 16% |
The UK economy
| Wave | Very interested | Fairly interested | Not very interested | Not at all interested |
|---|---|---|---|---|
| Wave 2 | 6% | 40% | 37% (down) | 18% |
| Wave 1 | 6% | 37% | 41% | 16% |
Those who are older, in higher socio-economic grades, or are degree educated continue to report higher levels of knowledge
In line with wave one, respondents who are older, in higher socio-economic grades, and degree educated are more likely to say they feel knowledgeable about how the UK trades with other countries, both in terms of trade inside and outside the EU. Figure 4.4 below charts knowledge levels among key groups on the question of how knowledgeable they feel about how the UK trades with countries outside the EU.[footnote 17]
Consistent with wave one, respondents are more likely to say they are knowledgeable if they:
- are in higher socio-economic grades (SEG):
Respondents from higher socio-economic grades are more likely to report feeling knowledgeable. Close to half of those within the SEG AB classifications say they are knowledgeable (43%), almost twice the rate of those in SEG classifications DE (28%).
- have obtained degree level qualifications:
There also continues to be a significant gap between those who have obtained a degree or above level qualifications (44%), those who have obtained non-degree qualifications (31%) and those who have no qualifications (22%).
- are men:
The gender gap also persists. Men (43%) are much more likely than women (27%) to report feeling knowledgeable about how the UK trades with countries outside the European Union. This is a commonly observed phenomenon in survey research, with women often more likely to state they feel less knowledgeable when answering survey questions about political issues[footnote 18].
Between wave one and wave two, there have been no statistically significant shifts across demographic subgroups.
Figure 4.4: Reported knowledge levels across key groups
| Overall (respondents) | Reported knowledge level |
|---|---|
| Total (2,349) | 34% |
| Gender (respondents) | Reported knowledge level |
|---|---|
| Male (1,188) | 43% (up) |
| Female (1,124) | 27% (down) |
| Age groups (respondents) | Reported knowledge level |
|---|---|
| 55+ (928) | 34% |
| 35 to 54 (787) | 39% (up) |
| 16 to 34 (601) | 31% (down) |
| Socio economic grade (SEG) (respondents) | Reported knowledge level |
|---|---|
| DE (847) | 28% (down) |
| C1C2 | 35% |
| AB (702) | 43% (up) |
| Income (respondents) | Reported knowledge level |
|---|---|
| Less than £19,999 (500) | 29% (down) |
| £20,000 to £39,999 (618) | 33% |
| £40,000 to £59,999 (277) | 38% |
| More than £60,000 (350) | 45% (up) |
| Qualifications (respondents) | Reported knowledge level |
|---|---|
| No qualifications (222) | 22% (down) |
| Non-degree (1,114) | 31% (down) |
| Degree or above (820) | 44% (up) |
IK2. How knowledgeable would you say you currently are about…? How the UK trades with countries outside the European Union
Proportions stating that they are very or fairly interested.
Base sizes provided in parenthesis.
Statistical significance arrows represent significant differences against the average result for wave two.
Engagement
Fewer respondents reported seeing or hearing anything in the last week about how the UK trades with other countries (either now or in the future) in wave two.
Two in five respondents (39%) reported seeing, reading or hearing information about how the UK trades, or will trade, with other countries in the previous week (see Figure 4.7). This is down 10 percentage points from the figure at wave one (48%).
Figure 4.7: Proportions of respondents saying they have seen or heard something in the last week
| Wave (respondents) | Proportion |
|---|---|
| Wave 1 (2,400) | 48% |
| Wave 2 (2,349 | 39% (down) ↓ |
FT1. In the last week, have you seen or heard anything about how the UK trades with other countries, or will trade with them in the future?
stating ‘Yes’
Base sizes provided in parenthesis.
Statistical significance arrows represent significant differences when compares to results observed at wave one.
Brexit is the dominant theme in terms of what respondents have seen or heard
Those respondents who recalled having seen or heard something in the previous week were asked to summarise what they had seen or heard in an open response format. Their answers were then coded into themes, each of which is presented in Figure 4.8 below. [footnote 19]
The most commonly cited theme was trade relationships with the USA, mentioned by 16% of respondents who had read, seen or heard something in the previous week.
Meanwhile,14% of those who had read, seen or heard something in the previous week mentioned Brexit generally, whilst a further 13% cited trade or trade deals post-Brexit. One in ten (11%) mentioned trade relationships with non-EU countries, and an identical proportion referenced the notion of a ‘no deal Brexit’.
Figure 4.8: Coded themes of what respondents had seen or heard in the previous week
| Coded response theme | Percentage of responses |
|---|---|
| About trade relationships with the USA | 16% |
| Brexit (unspecified) | 14% |
| Discussions of trade and trade deals post-Brexit | 13% |
| General news and information (unspecified) | 13% |
| About trade relationships with non-EU countries | 11% |
| No deal Brexit | 11% |
| WTO and world trade rules | 8% |
| Brexit’s effect on economy | 7% |
| Impact on UK businesses | 6% |
| About trade relationships with EU countries | 5% |
| TV advertisements and programmes | 4% |
| Negative or scare stories | 4% |
| Increases costs (including tariffs) | 3% |
| Do not understand, hard to understand or conflicting info | 3% |
| Radio programme | 2% |
| Northern Ireland border issues | 2% |
| Defence Exports | 1% |
| About trade relationships with commonwealth countries | 1% |
| Lower standards and lower quality goods | 1% |
| Norway or Canada model style trade deal | 1% |
| Theresa May being named | 1% |
| Fishing quotas and industry issues | 0% |
| USA administration comments on Brexit plan | 0% |
| Freedom of movement | 0% |
| Working restrictions | 0% |
| Not answered | 4% |
| No, none, nothing | 2% |
| Other | 9% |
FT2. … and can you provide a brief summary or description of what you have heard?
Open response question.
Unweighted Base: Where yes at FT1 (909)
Support for free trade agreements and perceived impact
Support for free trade agreements
Support for free trade agreements in general remains consistent.
Respondents were asked about the extent to which they are supportive of free trade agreements.[footnote 20] The question can be viewed as a measure of support for free trade agreements in principle, with no specific agreements or target countries referenced in the question.
As Figure 5.1 shows, two thirds of respondents (66%) said they were supportive of free trade agreements in general, consistent with wave one (66%). This includes 37% who were strongly supportive (versus 36% at wave one).
Opposition to free trade agreements - in principle at least – remains very low, with just 4% of respondents opposed (versus 3% at wave one); compared to two thirds (66%) who say they are supportive; and those who either say they neither support nor oppose free trade agreements (15%) or who are unsure (15%).
That said, whilst support for free trade agreements is high and levels of opposition are very low, this does not mean to say that, when the details of specific agreements become clear, the public support will remain unchanged. It is important to note that this question examines support and opposition levels at a more conceptual level. Levels of support for specific future free trade agreements will likely be dependent on how the public reacts to the details of those agreements.
Figure 5.1: Support and opposition to free trade agreements
| Wave | Strongly support | Somewhat support | Neither support nor oppose | Somewhat oppose | Strongly oppose | Don’t know |
|---|---|---|---|---|---|---|
| Wave 2 | 37% | 29% | 15% | 3% | 1% | 15% |
| Wave 1 | 36% | 29% | 15% | 3% | 1% | 16% |
FT4. In general, would you say that you support or oppose free trade agreements?
Unweighted base sizes: All respondents at wave one (2,400); All respondents at wave two (2,349)
Mirroring the trends that exist in terms of interest and knowledge of trade (see section 4.2 and 4.3 above) between demographic subgroups, a closer look at the results reveals that support is higher within the following groups:
Men
By a margin of 13 percentage points, men (73%) are more likely than women (60%) to say they support free trade agreements.
Higher socio-economic grades (SEGs)
Around 8 in 10 of those in SEG classifications AB (78%) support free trade agreements, which compares to two thirds (66%) of respondents in SEG classifications C1C2, and 58% of respondents in grades DE.
Older
There is a fairly steady increase in support as you go up the age scale. 53% of those aged 16 to 34 support free trade agreements, rising to 75% of those aged 55+.
Degree level qualifications
Three quarters of those with degree or above level qualifications report being supportive of free trade agreements (75%), which compares to two thirds (65%) of those with non-degree qualifications, and a slim majority of those with no qualifications (55%).
There are no statistically significant changes in support among sub-groups between wave one and wave two.
As was noted at wave one, we should be cautious when discussing levels of support. Stating that support is lower among certain groups may implicitly suggest that opposition is also higher. However, this is not the case. Consistent with wave one, whilst support varies considerably between sub-groups, levels of opposition remain consistently low (rarely above the 5% mark). Instead, it is the proportions of those who say they “don’t know” or that select “neither support nor oppose” that vary quite considerably between across sub-groups.
Figure 5.2: Reported levels of support across key groups
| Overall (respondents) | Level of support for FTAs |
|---|---|
| Total (2,349) | 66% |
| Gender (respondents) | Level of support for FTAs |
|---|---|
| Male (1,188) | 73% (up) |
| Female (1,124) | 60% (down) |
| Age groups (respondents) | Level of support for FTAs |
|---|---|
| 55+ (928) | 75% (up) |
| 35 to 54 (787) | 69% |
| 16 to 34 (601) | 53% (down) |
| Socio economic grade (SEG) (respondents) | Level of support for FTAs |
|---|---|
| DE (847) | 58% (down) |
| C1C2 | 66% |
| AB (702) | 78% (up) |
| Income (respondents) | Level of support for FTAs |
|---|---|
| Less than £19,999 (500) | 57% (down |
| £20,000 to £39,999 (618) | 69% |
| £40,000 to £59,999 (277) | 76% (up) |
| More than £60,000 (350) | 85% (up) |
| Qualifications (respondents) | Level of support for FTAs |
|---|---|
| No qualifications (222) | 55% (down) |
| Non-degree (1,114) | 65% |
| Degree or above (820) | 75% (up) |
FT4. In general, would you say that you support or oppose free trade agreements?
Base sizes provided in parenthesis.
Statistical significance arrows represent significant differences against the average result for wave two.
Perceptions of the impact of free trade agreements
There have been no changes in the proportion who think the overall impact of signing free trade agreements will be positive on the UK overall, or on their daily lives.
As Figure 5.3 illustrates, consistent with wave one, just under two-thirds (63%) think that signing free trade agreements outside the European Union would have a positive impact on the UK overall (versus 62% in wave one). Likewise, just over half (54%) continue to think that the effect will also be positive on their daily lives (versus 54% in wave one). Whilst there has been a significant increase in the proportion stating the impact will be negative, in both cases the percentage point difference is a fairly marginal increase of 2 percentage points.
Thus, whilst the proportion saying the impact will be positive is still high, there continues to be a gap between the proportion of respondents who state free trade agreements will have a positive impact on the UK overall, and those that state they will have a positive impact on their daily lives. This again highlights the notion that respondents are often less sure about the more immediate impact that free trade agreements may have on their daily lives, instead viewing it as something that has an effect at a more national level.
Figure 5.3: Impact of free trade agreements on UK overall and daily life
Impact on UK overall
| Wave | Very positive impact | Fairly positive impact | No impact | Fairly negative impact | Very negative impact | Don’t know |
|---|---|---|---|---|---|---|
| Wave 2 | 27% | 35% | 6% | 6% | 2% | 23% |
| Wave 1 | 28% | 34% | 6% | 5% | 2% | 26% |
Impact on daily life
| Wave | Very positive impact | Fairly positive impact | No impact | Fairly negative impact | Very negative impact | Don’t know |
|---|---|---|---|---|---|---|
| Wave 2 | 20% | 34% | 14% | 6% (up) | 2% | 24% (down) |
| Wave 1 | 20% | 34% | 13% | 4% | 2% | 27% |
UK1. In general, do you think that the UK signing free trade agreements with countries outside the European Union would have a positive impact or a negative impact on the UK overall?
UK2. In general, do you think that the UK signing free trade agreements with countries outside the European Union would have a positive impact or a negative impact on you and your daily life?
Unweighted base sizes: All respondents at wave one (2,400); All respondents at wave two (2,349)
Statistical significance arrows represent significant differences when compares to results observed at wave one.
There has been a decline in the proportion who think increased free trade will lead to a higher number of jobs.
In addition to exploring perceptions around the impact of free trade agreements in a more general sense, respondents were also asked about their perceptions of free trade with respect to the specific impact on jobs, wages, the quality of goods and services, and prices.
Whilst questions discussed in this report thus far - covering interest, knowledge, support and overall impact on the UK and respondents’ daily lives – have shown a stable picture between wave one and wave two, for these questions we see changes.
As is set out in Figure 5.4, two in five (42%) stated that increased free trade would create more jobs in the UK overall down eight percentage points on wave one (51%), with 15% stating that increased free trade would mean fewer jobs (versus 11% at wave one), an increase of 4 percentage points.
Meanwhile, one in three (33%) stated that increased free trade would create more jobs in their local area, down six percentage points on wave one (38%), with 12% stating that increased free trade will lead to fewer jobs locally (no significant change versus wave one).
We again observe a notable drop in the numbers saying that free trade would result in an increase in jobs when thinking about the more immediate impact free trade might have (this time the effect on their local area). The size of the gap, at 10 percentage points, is relatively consistent to that which was observed at wave one (13 percentage points).
Figure 5.4: Impact of free trade on jobs
Impact on jobs in the UK
| Wave | Significantly more jobs | Slightly more jobs | No change in jobs | Slightly fewer jobs | Significantly fewer jobs | Don’t know |
|---|---|---|---|---|---|---|
| Wave 2 | 16% (down) | 27% (down) | 19% (up) | 9% (up) | 6% | 24% |
| Wave 1 | 20% | 31% | 14% | 7% | 5% | 24% |
Impact on jobs locally
| Wave | Significantly more jobs | Slightly more jobs | No change in jobs | Slightly fewer jobs | Significantly fewer jobs | Don’t know |
|---|---|---|---|---|---|---|
| Wave 2 | 9% | 24% (down) | 29% (up) | 8% | 5% | 26% |
| Wave 1 | 10% | 28% | 24% | 7% | 4% | 26% |
UK3. Now thinking about both the UK as a whole and then just your local area, do you think that increased free trade would result in more jobs being created overall, or fewer jobs being created overall?
Unweighted base sizes: All respondents at wave one (2,400); All respondents at wave two (2,349)
Statistical significance arrows represent significant differences when compares to results observed at wave one.
There has been a decline in the proportion who think increased free trade will lead to increased wages.
Turning to perceptions about the impact of free trade on wages, we also see a decrease in the numbers believing that increased free trade will lead to increased wages at both a national and local level (see Figure 5.5).
One in four (25%) say they expect an increase in wages as a result of increased free trade. This represents a decline of eight percentage points compared to the results at wave one (33%). The proportion believing that increased free trade would lead to lower wages has also increased by three percentage points, from 11% to 14%.
When asked about the perceived impact locally, one in five (21%) said that the impact would be higher wages, representing a decline of seven percentage points on wave one (28%). Again, there has also been a small but statistically significant increase of two percentage points in the proportions stating that increased free trade would result in lower wages locally, rising from 10% to 12%.
Figure 5.5: Impact of trade on wages
Impact on wages in the UK
| Wave | Significantly higher wages | Slightly higher wages | No change in wages | Slightly lower wages | Significantly lower wages | Don’t know |
|---|---|---|---|---|---|---|
| Wave 2 | 5% (down) | 19% (down) | 35% (up) | 10% (up) | 4% | 27% |
| Wave 1 | 7% | 26% | 30% | 7% | 4% | 27% |
Impact on wages locally
| Wave | Significantly higher wages | Slightly higher wages | No change in wages | Slightly lower wages | Significantly lower wages | Don’t know |
|---|---|---|---|---|---|---|
| Wave 2 | 4% (down) | 17% (down) | 39% (up) | 8% | 4% | 28% |
| Wave 1 | 4% | 23% | 35% | 7% | 3% | 28% |
UK4. Do you think that increased free trade would result in higher wages or lower wages? In the UK
UK4. Do you think that increased free trade would result in higher wages or lower wages? Your local area
Unweighted base sizes: All respondents at wave one (2,400); All respondents at wave two (2,349)
Statistical significance arrows represent significant differences when compares to results observed at wave one.
There has been an increase in the share who believe increased free trade will lead to lower quality goods and services.
As Figure 5.6 illustrates, at wave two there has been a rise in the share who stated increased free trade will lead to lower quality goods and services. 17% said they thought increased free trade would lead to lower quality goods and services, up from 12% in wave one. That said, the proportion who stated that increased free trade would lead to higher quality goods and services remains broadly stable at 25% (versus 28% in wave one), meaning that overall a greater proportion think increased free trade will lead to higher quality goods and services, compared to lower quality.
Perceptions about the impact on prices also remain stable. A quarter of respondents (26%) said that increased free trade will lead to an increase in prices (versus 24% at wave one), with a third (34%) believing it would lead to price decreases (versus 33% at wave one).
Figure 5.6: Impact of trade on the quality of goods and services and prices
Impact on the availability of higher quality goods and services
| Wave | Significantly higher quality | Slightly higher quality | No change in quality | Slightly lower quality | Significantly lower quality | Don’t know |
|---|---|---|---|---|---|---|
| Wave 2 | 5% | 20% | 36% | 12% (up) | 5% (up) | 21% (down) |
| Wave 1 | 6% | 22% | 34% | 9% | 3% | 26% |
Impact on the prices of goods and services
| Wave | Significantly increase prices | Slightly increase prices | No change in prices | Slightly decrease prices | Significantly decrease prices | Don’t know |
|---|---|---|---|---|---|---|
| Wave 2 | 7% | 19% | 20% | 29% | 5% | 20% (down) |
| Wave 1 | 6% | 17% | 20% | 29% | 4% | 23% |
Q14. Thinking about just the UK as a whole, do you think that increased free trade would result in an increase in the price of goods and services, or a decrease in the price of goods and services?
Unweighted base sizes: All respondents at wave one (2,400); All respondents at wave two (2,349)
Statistical significance arrows represent significant differences when compares to results observed at wave one.
Future economic outlook
More respondents believed the economy will worsen than thought it would improve over the course of the next 12 months.
The survey also explored the economic outlook of respondents, asking how they see the economic conditions of the country changing over the course of the next 12 months (a newly included question at wave two). Overall, respondents were more pessimistic than they were optimistic about how the economy will perform over the next 12 months (see Table 5.7). More than a third (36%) said that they expected the economy to get worse, twice the figure that said they believed the economy will get better (18%). Three in ten (28%) said they believed the economy will stay the same, whilst 17% were unsure.
Table 5.7: Economic outlook over the next 12 months
| Do you think the general economic conditions of the country will improve, stay the same or get worse over the next 12 months? | Total (2,349) |
|---|---|
| Improve | 18% |
| Stay the same | 28% |
| Get worse | 36% |
| Don’t know | 17% |
Respondents who felt the economic conditions in the country will improve were more likely to be supportive of free trade agreements, and more likely to believe free trade will have a positive impact on the UK and on their daily lives.
Closer analysis shows that economic outlook is related to both respondents’ support for free trade and free trade agreements, and how they evaluate their impact. Figure 5.8, below, shows that 83% of those who think the economy will improve support free trade agreements, compared to 70% of those who think economic conditions will worsen.[footnote 21]
The difference in terms of how respondents evaluate the impact of free trade agreements is more pronounced still. 86% of those who think economic conditions will get better think the UK signing free trade agreements with other countries outside the European Union would have a positive impact on the UK overall, 28 percentage points more than the figure for those who believe the economy will worsen (58%). Likewise, close to eight in ten (78%) of those who have a positive outlook in relation to the UK economy think that the UK signing free trade agreements with the countries outside the European Union would have a positive impact on their daily life, which compares to just half (50%) of those who think the economic conditions will get worse.
Regression analysis confirms that, after controlling for a variety of other variables, positive views as to the condition of the economy over the next 12 months is statistically significantly related to support for free trade agreements.
Figure 5.8: Relationship between economic outlook and views towards free trade and free trade agreements
| General economic conditions over next 12 months (FT4) | Percentage |
|---|---|
| Improve | 83% |
| Get worse | 70% |
| Positive or negative impact on UK (UK1) | Percentage |
|---|---|
| Improve | 86% |
| Get worse | 58% |
| Positive or negative impact on daily life (UK2) | Percentage |
|---|---|
| Improve | 78% |
| Get worse | 50% |
FT4. In general, would you say that you support or oppose free trade agreements?
ECON. Do you think the general economic conditions of the country will improve, stay the same or get worse over the next 12 months?
UK1. In general, do you think that the UK signing free trade agreements with countries outside the European Union would have a positive impact or a negative impact on the UK overall / on you and your daily life?
Unweighted base: All respondents (2,349)
Statistical significance arrows represent significant differences against the average result for wave two.
The CPTPP
One in five respondents report being aware of the CPTPP
The survey again explored existing awareness and attitudes towards the UK joining the Comprehensive and Progressive Agreement for Trans-Pacific Partnership (CPTPP), a trade agreement between Australia, Brunei, Canada, Chile, Japan, Malaysia, Mexico, New Zealand, Peru, Singapore, and Vietnam which came into force on the 30 December 2018.
Respondents were initially asked about their awareness of the deal, with those who indicated some degree of awareness asked about the extent to which they would support or oppose the UK joining the agreement.
Six in ten (60%) continue to say they have never heard of the CPTPP or its predecessor agreement the Trans-Pacific Partnership (TPP)[footnote 22] (versus 61% at wave one). The proportion of respondents who report hearing about the agreement also remains stable. A combined total of 22% indicated they know either a little, a fair amount, or a great deal about the agreement (versus 21% at wave one).
Figure 5.9: Awareness of the CPTPP or TPP
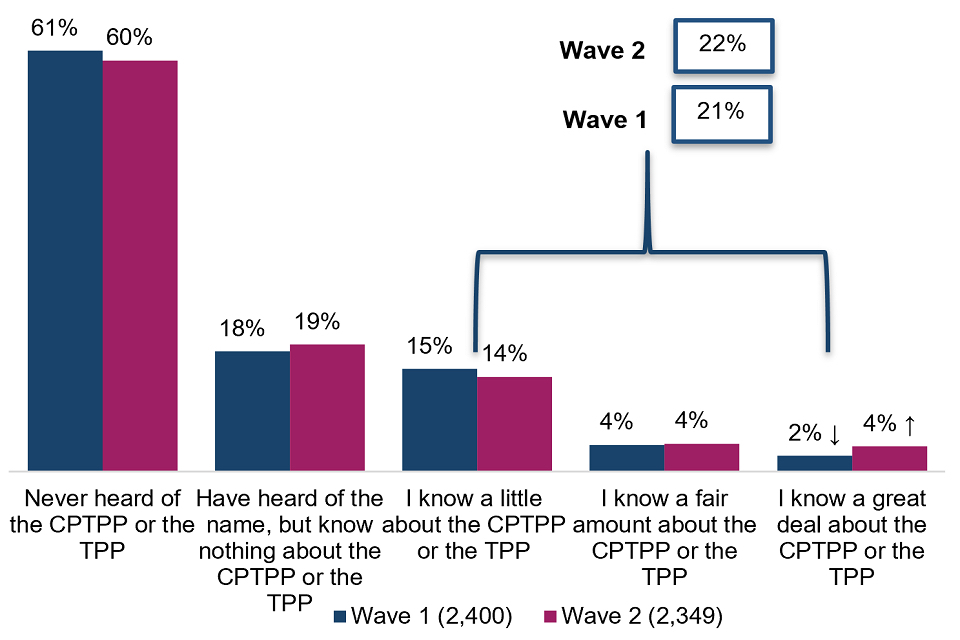
Barcharts showing the percentage of people knowing about CPTPP or the TPP in wave 1 and 2
CPTPP. How aware are you of the Comprehensive and Progressive Agreement for Trans-Pacific Partnership (CPTPP) formerly known as Trans-Pacific Partnership (TPP)?
Unweighted base: All respondents (2,349)
Statistical significance arrows represent significant differences when compares to results observed at wave one.
Of those that are aware, around half continue to be supportive of the UK joining the CPTPP
Those respondents that indicated some degree of awareness of the agreement (beyond simply reporting having heard of the name alone) were then asked about whether they would support the UK joining the agreement (see Figure 5.10).
Support for the agreement among those who indicated awareness of the agreement is 47%, consistent with support at wave one (51%). Levels of opposition also remain stable, with 15% opposed (versus 18% at wave one).
Figure 5.10: Support for the UK to join the CPTPP
| Wave | Strongly support | Somewhat support | Neither support nor oppose | Somewhat oppose | Strongly oppose | Don’t know |
|---|---|---|---|---|---|---|
| Wave 2 | 21% | 26% | 25% (up) | 8% | 7% | 13% |
| Wave 1 | 26% | 26% | 19% | 9% | 9% | 11% |
Q17. To what extent would you support or oppose the UK joining the CPTPP
Unweighted Base: All respondents aware of the CPTPP or TPP at wave one (538); All respondents aware of the CPTPP or TPP at wave one (529)
Statistical significance arrows represent significant differences when compares to results observed at wave one.
Trade agreements continuity (TAC)
Seven in ten claim that they have seen, read or heard something about the process of rolling over trade agreements.
A new topic included at wave two was respondents’ awareness and attitudes around TAC. TAC refers to the process of the UK government ‘rolling over’ EU trade agreements so UK businesses can continue to have access to these deals. Given the specialised topic matter, questions exploring this issue were only asked to those who said they felt very or fairly knowledgeable about how the UK trades with other countries either outside or in the European Union (45% of the sample).
Seven in ten respondents (69%) who felt very or fairly knowledgeable about trade reported having read, seen or heard something about the rolling over process. This includes 19% who said they had read, seen or heard a little about the process, 26% who said they had read, seen or heard something, and a further 24% who said they had read, seen or heard a lot. One in five said they had not read, seen or heard anything (18%), and a further 13% were unsure.
Fig 5.11: Awareness of Trade Continuity Agreements
| Level of awareness | % |
|---|---|
| I’ve read, seen or heard a lot about this | 24% |
| I’ve read, seen or heard something about this | 26% |
| I’ve read, seen or heard little about this | 19% |
| I haven’t read, seen or heard anything about this | 18% |
| I don’t know | 13% |
TAC1. As an EU member the UK is part of trade agreements the EU has negotiated with other countries. On leaving, the UK will no longer have access to these. The government is currently looking to roll over these agreements, so British businesses can continue to have access to these deals once the UK has left the EU. How much have you read, seen, or heard about this work?
Unweighted base: Where fairly or very knowledgeable about trade either outside or in the EU (1080)
The data points to high rates of false-recall in terms of specific countries respondents reported hearing about in the TAC process
At first glance, awareness levels appear quite high (69%), even in the context of the questions only being asked to those who self-report feeling very or fairly knowledgeable about free trade inside or outside the EU. However, a closer look at the results from the next question does cast some doubt about the extent to which the public might be familiar with the TAC process.
Following the awareness question, those respondents who said they had seen or heard something about TAC were presented with a list of six countries. They were asked which ones they recalled as having had pre-existing agreements with the EU ‘rolled over’, meaning that UK businesses can continue to benefit from them after the UK has left the EU.
Notably, some 44% were unsure of a specific country. Moreover, large numbers of respondents also named countries where no agreements had been rolled over such as Canada, Japan and Brazil. 29% selected Canada (the highest of any countries listed); 24% selected Japan; and 8% selected Brazil. A further 9% selected the option of ‘none of these’.
Meanwhile, 28% selected Switzerland, 14% selected the Faroe Islands, and 12% selected Israel, all of which were correct. Given the high rate of false recall where an agreement had not been rolled over, we should be cautious about assuming that respondents selecting these countries had in-fact heard anything specific to TAC.
| Figure 5.12: Recall of countries where agreements had been ‘rolled over’ | Percentage |
|---|---|
| Canada | 29% |
| Switzerland | 28% |
| Japan | 24% |
| Faroe Islands | 14% |
| Israel | 12% |
| Brazil | 8% |
| None of these | 9% |
| Don’t know | 44% |
TAC2. Below is a list of countries. Which of these countries do you recall having had pre-existing agreements with the EU ‘rolled over’, meaning that UK businesses can continue to benefit from them after the UK has left the EU? At the time of writing the correct answers were Faroe Islands, Switzerland, and Israel.
The agreement with Switzerland was signed 11 February. The agreement with Faroe Islands was signed on 1 February. The agreement with Israel was signed on the 18 February.
Red = decoy (no TAC at the time of survey). Green = correct (TAC at the time of survey).
Unweighted base: Where read seen or heard something (763)
Respondents were more likely to say they thought the government should prioritise both rolling over existing trade agreements and preparing for new trade agreements, rather than prioritising one over the other. However, when pushed, more think the government should prioritise making sure trade agreements we already have through the EU continue after the UK has left.
As well as exploring respondent awareness of TAC, the survey also asked the respondents whether they would prefer the government to prioritise rolling over trade agreements with other countries made by the EU, or preparing to set up new trade agreements with other countries. The question was asked in two stages, with those respondents who said both priorities were equally important at the first time of asking then asked if they were ‘leaning’ towards either of the priorities.
As Figure 5.13 presents, at the first time of asking, the most common response was that the government should prioritise both (42%).One in four (26%) prioritised maintaining trade agreements we already have through the EU after the UK has left and with one in five (19%) prioritised the creation of new trade agreements.
After accounting for responses at the ‘squeeze’ question for those who said both considerations were equally important, we continue to find more respondents selecting continuing agreements through the EU as more of a priority (38%) than creating new trade agreements (31%). Meanwhile, one in five (19%) continued to state that both priorities were equally important.
Figure 5.13: Recall of countries where agreements had been ‘rolled over’
Initial
| Both of these are equally important | Making sure that trade agreements we already have through the EU continue after the UK has left | Creating new trade agreements with other countries | Neither of these is very important | Don’t know |
|---|---|---|---|---|
| 42% | 26% | 19% | 2% | 11% |
Squeeze
| Not leaning either way, I still think both of these are equally important | Making sure that trade agreements we already have through the EU continue after the UK has left | Creating new trade agreements with other countries |
|---|---|---|
| 45% | 30% | 25% |
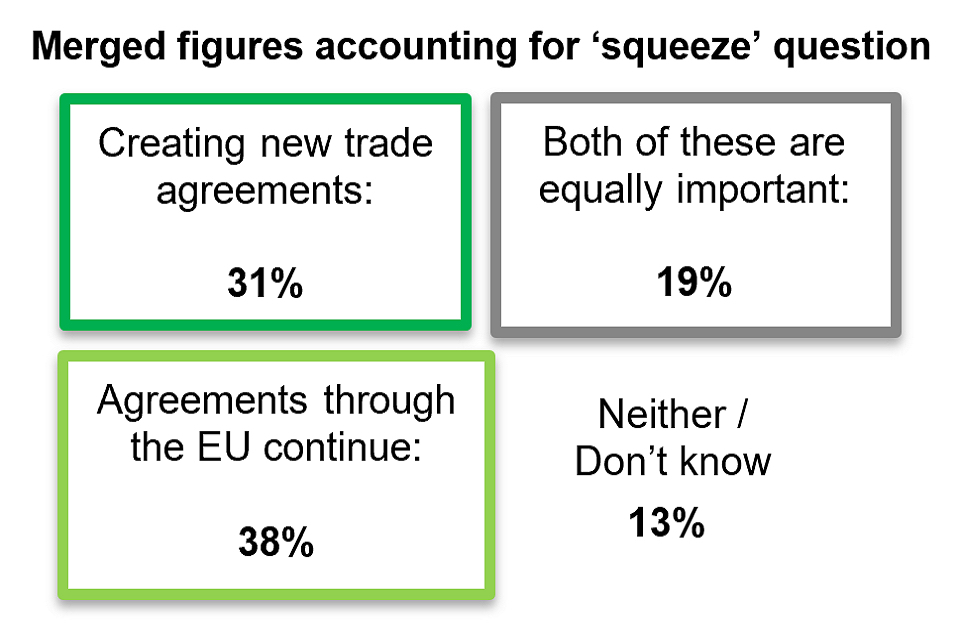
Figure showing merged figures accounting for squeeze question
TAC3. The UK government is currently rolling over trade agreements with other countries made by the EU as well as preparing to set up new trade agreements with other countries. Which do you think the government should prioritise?
TAC3A. … and towards which one are you leaning the most?
TAC3 unweighted base: Where fairly or very knowledgeable about trade (1,080)
TAC3A unweighted base: Where equally important (437)
Trading partner preferences
Trading partner preferences
Support for establishing free trade agreements with selected countries (Australia, New Zealand, USA, China, and India) remains broadly high, but has declined.
Respondents were presented with five non-EU countries and asked to what extent they would support or oppose the UK establishing a free trade agreement with them. The five countries put to respondents remained identical to those asked about at wave one.
Whilst all but one of the countries continue to receive a majority of support, levels of support for establishing a free trade agreement with each of the countries has declined. The decline in percentage point terms is similar for each country, ranging from five to seven percentage points.
Ranking support levels from high to low at wave two, the order remains consistent between waves (see Table 6.1). New Zealand and Australia continue to be the most popular potential partners with whom to establish a free trade agreement, each supported by 64% of respondents (versus 70% at wave one). The USA was the next most popular choice, supported by 57% of respondents (versus 62% at wave one). Meanwhile, India and China continue to receive less support, with 51% (versus 58% at wave one) and 46% (versus 53% at wave one) supportive respectively.
Notably, whilst support has fallen, the results do not show that opposition has increased for any of the countries at wave two (see Table 6.2). Thus, the declines in support have instead happened alongside increased proportions selecting “neither support nor oppose” or “don’t know” between waves.
Table 6.1: Changes in support between wave one and wave two
| Support | Total Wave 1 (2,400) | Total Wave 2 (2,349) |
|---|---|---|
| New Zealand | 70% | 64% |
| Australia | 70% | 64% |
| USA | 62% | 57% |
| Australia | 58% | 51% |
| China | 53% | 46% |
Statistical significance arrows represent significant differences when compares to results observed at wave one.
Table 6.2: Changes in opposition between wave one and wave two
| Opposition | Total Wave 1 (2,400) | Total Wave 2 (2,349) |
|---|---|---|
| New Zealand | 5% | 5% |
| Australia | 5% | 5% |
| USA | 11% | 12% |
| Australia | 10% | 11% |
| China | 15% | 16% |
Compared to each of the other countries listed, more respondents described Japan as having good quality consumer goods.
New for wave two, the survey explored respondents’ perceptions of the quality of consumer goods from a list of six selected countries.
Of the countries listed, more respondents said they perceived Japan as having good quality consumer goods than any of the other countries asked about. Nearly two thirds of respondents (64%) described the quality of consumer goods from Japan as good quality. Slightly fewer described the quality of consumer goods from New Zealand (57%), Australia (57%), and the USA (55%) as good quality.
Fewer perceived the quality of consumer goods from China and India as good, with 29% and 27% describing them as good quality respectively. Notably, the proportions who perceive the quality of consumer goods as poor was much higher in the case of China and India: 28% said they perceived the quality of goods as poor in the case of China; and 23% did so in the case of India.
Figure 6.3: the perceived quality of consumer goods from selected countries
| Country | Very good quality | Good quality | Neither poor nor good quality | Poor quality | Very poor quality | Don’t know |
|---|---|---|---|---|---|---|
| Japan | 26% | 38% | 14% | 4% | 1% | 17% |
| New Zealand | 16% | 41% | 15% | 1% | 1% | 26% |
| Australia | 13% | 44% | 15% | 1% | 1% | 26% |
| USA | 13% | 42% | 21% | 6% | 2% | 16% |
| China | 5% | 25% | 28% | 23% | 6% | 14% |
| India | 4% | 23% | 30% | 19% | 4% | 20% |
There is a moderate relationship between believing the quality of consumer goods from each of the countries is high, and supporting the UK establishing a free trade agreement with that respective country.
For each of the countries included in both questions, analysis shows a moderate relationship between believing the quality of consumer goods is high, and supporting the UK establishing a free trade agreement with that respective country.
To take the USA as an example (see Figure 6.4), we find support among those who believe the quality of consumer goods is good at 75%, which compares to just 30% among those who said they believe the quality of goods is poor. Likewise, 51% of those who said the quality of goods from the USA is poor were in opposition to the notion of the UK establishing a free trade agreement with the USA, which compares to just 8% for those who described the quality as good.
Figure 6.4: Support for establishing free trade agreement with USA by perceptions of quality of consumer goods from USA
| Support or opposition for FTA with USA | Poor quality (204) | Good quality (1,274) |
|---|---|---|
| Support | 30% | 75% |
| Oppose | 51% | 8% |
| Neither support nor oppose | 15% | 11% |
| Don’t know | 5% | 6% |
Unweighted base sizes in parenthesis
TP2. To what extent would you support or oppose the UK establishing a free trade agreement with each of the following countries? – USA
Statistical significance arrows represent significant differences against the average result for wave two.
The relationship between perceptions of consumer good quality and support for striking a free trade deal was measured more formally using correlation and regression analysis. The results of the Spearman’s correlation test, shown below in Table 6.5, reveals a moderate relationship for each the five countries. The relationship is strongest in the case of the USA (r = 0.39).
Table 6.5: Spearman’s correlation between ‘to what extent would you support or oppose the UK establishing a free trade agreement with each of the following countries (TP2)’ and ‘which of the following best describes your view of the quality of consumer goods from the following countries (CG)’
| Country | Spearman rank (r) |
|---|---|
| USA | 0.39 (sig) |
| New Zealand | 0.36 (sig) |
| India | 0.32 (sig) |
| Australia | 0.31 (sig) |
| China | 0.29 (sig) |
Regression analysis confirms the strength of the relationships even after other variables have been controlled for. In each case, perception about quality compared to all the other variables we looked at, is the most powerful driver of support for striking a trade deal with each of the respective countries.
When asked to select trade negotiation priorities, a host of priorities were selected by respondents as important irrespective of the country in question, but some priorities were country-specific.
In wave two, respondents were asked to think about what considerations the UK government should give priority to when negotiating free trade agreements with Australia, New Zealand, the USA, and China. For each of the countries, respondents could select up to three considerations they saw as highest priority from a pre-suggested list. Results are presented in Figures 6.6 – 6.9.
Certain priorities were selected as important irrespective of the country in question. These included considerations around creating new jobs in the UK overall, maintaining product and food standards, and maintaining environmental standards.
However, we also find some interesting differences between priorities for countries, two of which are particularly notable:
- The consideration selected by most respondents in the case of the USA was protecting public services like the BBC and the NHS, selected by 34%. Notably, this is the only country where this consideration made it into the top three, with this item ranking 8th, 7th and 7th in the list of priorities for Australia, New Zealand and China respectively.
- China was the only country where more people selected protecting existing jobs over creating new jobs in the UK overall.
Top three considerations when negotiating free trade agreements
Australia:
- creating new jobs in the UK overall (32%)
- maintaining current UK food standards (27%)
- protecting UK farmers (26%)
New Zealand:
- creating new jobs in the UK overall (32%)
- maintaining environmental standards in the UK (31%)
- maintaining product standards in the UK (31%)
USA:
- protecting public services like the BBC and NHS (34%)
- maintaining current UK food standards (30%)
- creating new jobs in the UK overall (29%)
China:
- maintaining product standards in the UK (32%)
- maintaining environmental standards in the UK (29%)
- protecting existing jobs in the UK overall (29%)
Unweighted base sizes in parenthesis
TP2c. ‘Please select up to three considerations you think the UK government should be giving the highest priority to when negotiating free trade agreements with the following countries?
Multiple response question. Respondents could select up to three options.
Unweighted base: All respondents (2,349)
Figure 6.7.1: Considerations to be given the highest priority when negotiating an FTA with Australia
| Consideration | Level of support |
|---|---|
| Creating new jobs in the UK overall | 32% |
| Maintaining current UK food standards | 27% |
| Protecting UK farmers | 26% |
| Maintaining product standards in the UK | 26% |
| Maintaining environmental standards in the UK | 26% |
| Protecting existing jobs in the UK overall | 26% |
| Protecting rights for UK workers | 25% |
| Protecting public services like the BBC and NHS | 25% |
| Not increasing the cost of goods and services in the UK | 25% |
| Increasing UK exports to Australia | 22% |
| Ensuring that people in the UK and Australia have the same rights to live and work in each other’s countries | 18% |
| Protecting human rights in Australia | 6% |
Figure 6.7.2: Considerations to be given the highest priority when negotiating an FTA with New Zealand
| Consideration | Level of support |
|---|---|
| Creating new jobs in the UK overall | 32% |
| Maintaining environmental standards in the UK | 31% |
| Maintaining product standards in the UK | 31% |
| Increasing UK exports to New Zealand | 28% |
| Protecting UK farmers | 26% |
| Not increasing the cost of goods and services in the UK | 26% |
| Protecting public services like the BBC and NHS | 22% |
| Protecting existing jobs in the UK overall | 22% |
| Maintaining current UK food standards | 21% |
| Ensuring that people in the UK and New Zealand have the same rights to live and work in each other’s countries | 20% |
| Protecting rights for UK workers | 15% |
| Protecting human rights in Australia | 8% |
Figure 6.7.3: Considerations to be given the highest priority when negotiating an FTA with the USA
| Consideration | Level of support |
|---|---|
| Protecting public services like the BBC and NHS | 34% |
| Maintaining current UK food standards | 30% |
| Creating new jobs in the UK overall | 29% |
| Maintaining environmental standards in the UK | 29% |
| Maintaining product standards in the UK | 29% |
| Protecting existing jobs in the UK overall | 26% |
| Protecting UK farmers | 23% |
| Not increasing the cost of goods and services in the UK | 23% |
| Increasing UK exports to the USA | 23% |
| Protecting rights for UK workers | 21% |
| Ensuring that people in the UK and the USA have the same rights to live and work in each other’s countries | 15% |
| Protecting human rights in the USA | 7% |
Figure 6.7.3: Considerations to be given the highest priority when negotiating an FTA with China
| Consideration | Level of support |
|---|---|
| Maintaining product standards in the UK | 32% |
| Maintaining environmental standards in the UK | 29% |
| Protecting existing jobs in the UK overall | 29% |
| Maintaining current UK food standards | 27% |
| Creating new jobs in the UK overall | 27% |
| Protecting rights for UK workers | 26% |
| Protecting public services like the BBC and NHS | 25% |
| Not increasing the cost of goods and services in the UK | 21% |
| Protecting human rights in China | 20% |
| Increasing UK exports to China | 20% |
| Protecting UK farmers | 20% |
| Ensuring that people in the UK and China have the same rights to live and work in each other’s countries | 10% |
TP2c. ‘Please select up to three considerations you think the UK government should be giving the highest priority to when negotiating free trade agreements with the following countries? Multiple response question. Respondents could select up to three options. Unweighted base: All respondents (2,349)
Respondents were also asked which three considerations they think the Government should give the lowest priority to when negotiating free trade agreements (see Figure 6.8). Again, respondents were asked to select from the same list of options, excluding those they had given the highest priority to.
For each of the listed countries, three considerations were consistently selected by the majority of respondents as the lowest priorities, suggesting these are areas of lowest concern amongst the UK public. For trade deals with the USA, Australia, and New Zealand, nearly half (48%) felt protecting human rights was a low priority. Fewer selected protecting human rights in China as a low priority, although it was still the second most selected item (37%). The increase of UK exports was another low priority selected by nearly one-quarter of the respondents for the USA (26%), Australia (24%) and New Zealand (24%). Slightly more selected it for China (29%).
Meanwhile, the consideration which was the lowest priority among the public when considering a free trade agreement with China was ensuring that people in the UK and China have the same rights to live and work in each other’s countries (44%). Again, this was also selected as a low priority for many respondents when considering a free trade agreement with the USA (39%), Australia (33%), and New Zealand (31%) (see Figure 6.9).
Considerations to be given the lowest priority when negotiating free trade agreements
Australia:
- protecting human rights in Australia (48%)
- ensuring that people in the UK and Australia have the same rights to live and work in each other’s countries (33%)
- increasing UK exports to Australia (24%)
New Zealand:
- protecting human rights in New Zealand (48%)
- ensuring that people in the UK and New Zealand have the same rights to live and work in each other’s countries (31%)
- increasing UK exports to New Zealand (24%)
USA:
- protecting human rights in the USA (48%)
- ensuring that people in the UK and the USA have the same rights to live and work in each other’s countries (39%)
- increasing UK exports to the USA (26%)
China:
- ensuring that people in the UK and China have the same rights to live and work in each other’s countries (44%)
- protecting human rights in the USA (37%)
- increasing UK exports to the USA (29%)
‘TP2d. ‘Please select up to three considerations you think the UK government should be giving the least priority to when negotiating free trade agreements with the following countries?
Multiple response question. Respondents could select up to three options.
Unweighted base: All respondents (2,349)
Figure 6.9.1: Considerations to be given the lowest priority when negotiating an FTA with Australia
| Consideration | Level of support |
|---|---|
| Protecting human rights in Australia | 48% |
| Ensuring that people in the UK and Australia have the same rights to live and work in each other’s countries | 33% |
| Increasing UK exports to Australia | 24% |
| Not increasing the cost of goods and services in the UK | 21% |
| Protecting public services like the BBC and NHS | 20% |
| Protecting UK farmers | 19% |
| Maintaining environmental standards in the UK | 14% |
| Creating new jobs in the UK overall | 14% |
| Maintaining product standards in the UK | 12% |
| Protecting rights for UK workers | 11% |
| Protecting existing jobs in the UK overall | 10% |
| Maintaining current UK food standards | 10% |
Figure 6.9.2: Considerations to be given the lowest priority when negotiating an FTA with New Zealand
| Consideration | Level of support |
|---|---|
| Protecting human rights in New Zealand | 48% |
| Ensuring that people in the UK and New Zealand have the same rights to live and work in each other’s countries | 31% |
| Increasing UK exports to New Zealand | 24% |
| Not increasing the cost of goods and services in the UK | 21% |
| Protecting public services like the BBC and NHS | 19% |
| Protecting UK farmers | 16% |
| Creating new jobs in the UK overall | 15% |
| Maintaining environmental standards in the UK | 14% |
| Protecting existing jobs in the UK overall | 12% |
| Protecting rights for UK workers | 12% |
| Maintaining product standards in the UK | 12% |
| Maintaining current UK food standards | 11% |
Figure 6.9.3: Considerations to be given the lowest priority when negotiating an FTA with the USA
| Consideration | Level of support |
|---|---|
| Protecting human rights in the USA | 48% |
| Ensuring that people in the UK and the USA have the same rights to live and work in each other’s countries | 39% |
| Increasing UK exports to the USA | 26% |
| Not increasing the cost of goods and services in the UK | 20% |
| Protecting UK farmers | 18% |
| Protecting public services like the BBC and NHS | 16% |
| Creating new jobs in the UK overall | 13% |
| Maintaining environmental standards in the UK | 13% |
| Protecting rights for UK workers | 12% |
| Maintaining current UK food standards | 11% |
| Maintaining product standards in the UK | 11% |
| Protecting existing jobs in the UK overall | 10% |
Figure 6.9.4: Considerations to be given the lowest priority when negotiating an FTA with China
| Consideration | Level of support |
|---|---|
| Ensuring that people in the UK and China have the same rights to live and work in each other’s countries | 44% |
| Protecting human rights in China | 37% |
| Increasing UK exports to China | 29% |
| Not increasing the cost of goods and services in the UK | 22% |
| Protecting public services like the BBC and NHS | 18% |
| Protecting UK farmers | 18% |
| Creating new jobs in the UK overall | 13% |
| Maintaining environmental standards in the UK | 12% |
| Protecting rights for UK workers | 11% |
| Maintaining product standards in the UK | 11% |
| Maintaining current UK food standards | 11% |
| Protecting existing jobs in the UK overall | 9% |
TP2d. ‘Please select up to three considerations you think the UK government should be giving the least priority to when negotiating free trade agreements with the following countries?
Multiple response question. Respondents could select up to three options.
Unweighted base: All respondents (2,349)
Appendix
Appendix 1: Breakdown of SEG classifications
| SEG classification | Description | Example(s) |
|---|---|---|
| A | Higher managerial/professional/administrative | Established doctor, Solicitor, Board Director in a large organisation (200+ employees, top level civil servant/public service employee |
| B | Intermediate managerial/professional/administrative | Newly qualified (under 3 years) doctor, solicitor, board director small organisation, middle manager in large organisation, principal officer in civil service/local government |
| C1 | Supervisory or clerical/junior managerial/professional/administrative | Office worker, student doctor, foreman with 25+ employees, salesperson |
| C2 | Skilled manual worker | Skilled bricklayer, carpenter, plumber, painter, bus/ambulance driver, HGV driver, AA patrolman, pub/bar worker |
| D | Semi or unskilled manual work | Manual workers, all apprentices to be skilled trades, caretaker, park keeper, non-HGV driver, shop assistant |
| C | - | Full time student |
| E | - | Casual worker (not in permanent employment), housewife/homemaker, retired and living on state pension (no private or work-related pension scheme), unemployed or not working due to long-term sickness, full-time carer of another household member, other |
Appendix: Statement of terms
Compliance with International Standards
BMG complies with the International Standard for Quality Management Systems requirements (ISO 9001:2015) and the International Standard for Market, opinion and social research service requirements (ISO 20252:2012) and The International Standard for Information Security Management (ISO 27001:2013).
Interpretation and publication of results
The interpretation of the results as reported in this document pertain to the research problem and are supported by the empirical findings of this research project and, where applicable, by other data. These interpretations and recommendations are based on empirical findings and are distinguishable from personal views and opinions.
BMG will not publish any part of these results without the written and informed consent of the client.
Ethical practice
BMG promotes ethical practice in research: We conduct our work responsibly and in light of the legal and moral codes of society.
We have a responsibility to maintain high scientific standards in the methods employed in the collection and dissemination of data, in the impartial assessment and dissemination of findings and in the maintenance of standards commensurate with professional integrity.
We recognise we have a duty of care to all those undertaking and participating in research and strive to protect subjects from undue harm arising as a consequence of their participation in research. This requires that subjects’ participation should be as fully informed as possible and no group should be disadvantaged by routinely being excluded from consideration. All adequate steps shall be taken by both agency and client to ensure that the identity of each respondent participating in the research is protected.
-
As of January 2020, the UK has left the EU. The Withdrawal Agreement sets out how the UK is able to continue to be covered by EU-third country trade agreements until 31 December 2020. On this basis, EU trade agreements can continue to apply to the UK. After 31 December 2020, EU trade agreements will no longer apply to the UK and trade continuity agreements will enter into effect. ↩
-
Cross-sectional studies interview a fresh sample of people each time the survey is conducted. This differs from longitudinal studies where the respondents in the same sample are interviewed over time. ↩
-
West, T. (2016) ‘Explaining Interviewer Effects: A Research Synthesis’ ↩
-
Strack, F. (1992) ‘“Order Effects” in Survey Research: Activation and Information Functions of Preceding Questions’ ↩
-
See the wave two technical report for information on the cognitive testing process followed ↩
-
A detailed methodological breakdown can be found in the wave two technical report ↩
-
Interviewers were instructed to avoid assisting with interpretation of questions so as to minimise any potential interviewer effects. However, interviewers did provide technical support and assistance where necessary. ↩
-
The IMD is a measure of relative deprivation for small areas (lower super output areas (LSOAs)). It is a combined measure of deprivation based on a total of 37 separate indicators that have been grouped into seven domains, each of which reflects a different aspect of deprivation experienced by individuals living in an area. For more information, see: The English Index of Multiple Deprivation (IMD) 2015 Guidance (PDF, 139KB). ↩
-
See data tables ↩
-
Further discussion on quota and probability sampling, and the consequences for statistical tests is provided in the wave two technical report ↩
-
For more information on effects of social desirability bias and associated effects on survey questions, see Krumpal, I. (2013) ‘Determinants of social desirability bias in sensitive surveys: a literature review’ ↩
-
Whilst not set out in full, responses to the question about interest in how the UK trades with countries inside the EU follow a similar pattern. ↩
-
More detail on SEG classifications is provided in the appendix. ↩
-
Gender differences in interest levels with respect to political related issues is a common phenomenon within survey research. See: Coffe, H. (2013) ‘Women Stay Local, Men Go National and Global? Gender Differences in Political Interest’ ↩
-
Whilst not set out in full, responses to the question about how knowledgeable they feel about how the UK trades with countries inside the EU follow a similar pattern. ↩
-
Evidence from academia suggests that this can often be partly explained by a variety of factors that are often not related to the ‘actual’ knowledge levels of respondents. For example, some studies suggest that women are more risk-averse when answering knowledge related questions and are more likely to state ‘don’t know’. Other studies suggest that women tend to be more interested in political information related to local affairs rather than national and international issues. For further discussion, please see Lizotte, M and Sidman, A. (2009) ‘Explaining the Gender Gap in Political Knowledge’. ↩
-
Given the different fieldwork periods, and thus the different events that took place in each, results between wave one and wave two have not been compared. ↩
-
The question specifically referenced “free trade agreements”. There is some evidence to suggest that changes in question wording can impact levels of support, with the public slightly more supportive of “free trade” as compared to “free trade agreements”. See: Pew Research Center: Americans, Like Many in Other Advanced Economies, Not Convinced of Trade’s Benefits (2018) ↩
-
Those who said they “don’t know” whether economic conditions would improve, stay the same or get worse over the next 12 months were much less likely to say they supported FTAs. ↩
-
The Trans-Pacific Partnership (TPP) was the predecessor to the CPTPP prior to the USA’s decision not to join the agreement. The agreement shares much of the same text, although some provisions from the original agreement were suspended or otherwise changed, setting aside issues that were priorities for the United States in the original negotiations. ↩