Public attitudes to trade tracker: wave 2 technical report
Published 10 August 2020

© Crown copyright 2020
This publication is licensed under the terms of the Open Government Licence v3.0 except where otherwise stated. To view this licence, visit nationalarchives.gov.uk/doc/open-government-licence/version/3 or write to the Information Policy Team, The National Archives, Kew, London TW9 4DU, or email: psi@nationalarchives.gov.uk.
Where we have identified any third party copyright information you will need to obtain permission from the copyright holders concerned.
This publication is available at https://www.gov.uk/government/publications/public-attitudes-to-trade-tracker-patt-wave-2/public-attitudes-to-trade-tracker-wave-2-technical-report
Methodology note
Aims
Since its creation in July 2016 the Department for International Trade (DIT) is responsible for:
- supporting and encouraging UK businesses, to grow internationally in a sustainable way
- ensuring the UK remains a leading destination for international investment and maintains its number one position for international investment stock in Europe
- opening markets, building a trade framework with new and existing partners which is free and fair
- using trade and investment to underpin the government’s agenda for a Global Britain and its ambitions for prosperity, stability and security worldwide
- building DIT as an effective international economic department where are people are expert, enterprising, engaged and inclusive.
DIT view the UK public as an important group of stakeholders, and the Public Attitudes to Trade Tracker (PATT) has been designed to help ensure that the public’s views are considered during the policy making process and to inform future communications.
In September 2018 DIT commissioned a nationally representative survey of the UK public to examine public attitudes towards trade, to understand the public’s priorities as they relate to trade policy, and to track how these may change over time.
Fieldwork for wave one of the research concluded in January 2019, with final reports published by DIT in July 2019. Results from wave one provide a baseline to track and measure shifts in the UK public’s attitudes towards UK trade policy and strategy over time. This report outlines the methodology and approach for wave two of the research.[footnote 1] Fieldwork for this wave was carried out between June and August 2019.
Methodology
To ensure that results can be tracked robustly, the approach and methodology at wave two was entirely consistent with that used at wave one.
The research followed a mixed mode approach encompassing post-to-online invites ((also known as CAWI – Computer-Assisted Web Interviewing) and face-to-face interviews administered via Computer-Assisted Self Interviewing (CASI) interviews. To ensure consistency, both methodologies rely on respondents to self-complete survey questions, thereby reducing possible biases related to interviewer effects[footnote 2] and leading to few social desirability effects.
In total 2,349 interviews were achieved. 1,219 interviews were conducted using a CASI methodology. Initial screening questions were conducted by the field interviewer, after which a tablet device was handed over to the respondent who then completed the survey themselves without interviewer involvement. The remaining 1,130 respondents completed the postal to online survey. Letters were sent to UK addresses inviting members of the public to complete the survey online.
This approach combined the benefits of a quick, responsive, adaptive self-completion design, provided interviewer support where respondents needed it, and ensured that poorly connected and low-responding hard-to-reach groups were included.
Research phasing
The research was administered by BMG Research.
Timings of wave two of the research were:
- cognitive interviews from 20 May 2019 to 26 May 2019
- main stage fieldwork postal to online from 10 June 2019 to 13 August 2019
- man stage fieldwork face to face from 20 June 2019 to 2 August 2019
The main stage of fieldwork was timed such that the interviewing concluded by mid-August 2019.
Sampling
The Public Attitudes to Trade Tracker sample frame is designed to be representative of private households in the United Kingdom.
The survey sample was drawn via two different approaches to cater for the mixture of methodologies.
Post to Online sample frame
The post-to-online sample was selected via a stratified random probability design proportional to the UK population (with sample boosts in Northern Ireland, Scotland and Wales) consistent with the approach employed in wave one.
The Great Britain sample frame was drawn from the Royal Mail’s small users Postcode Address File (PAF). The small users PAF is limited to addresses which receive, on average, fewer than 50 items of post per day and which are not flagged with Royal Mail’s “organisation code”. An updated version of this list is obtained twice a year. By using only the small-user delivery points most large institutions and businesses are excluded from the sample. Small-user delivery points which are flagged as small business addresses are also excluded. However, some small businesses and other ineligible addresses remain on the sampling frame and if these were selected, the letters were returned to BMG as undelivered and recorded as ineligible.
The sampling frame employed for addresses in Northern Ireland is the Pointer address database. Pointer is the most comprehensive and authoritative address database in Northern Ireland, with approximately 650,000 address records available for selection. This list of domestic properties is maintained by Land and Property Services (LPS), with input from Local Councils, Royal Mail and Ordnance Survey of Northern Ireland (OSNI).
A systematic random sample of addresses was selected for Northern Ireland from the Pointer address database. Addresses are sorted by district council and ward, so the sample is effectively stratified geographically.
The total database size in 2019 was 6,120 individual residence addresses.
In order to ensure sufficient base sizes to allow reliable regional analysis, the number of invites were boosted in each of the devolved nations.
Face-to-face sample frame
Alongside the post-to-online approach and mirroring that employed in wave one, BMG conducted 1,219 (52%) of the target interviews through a face to face approach.
The face-to-face sample frame was constructed using a random locational quota design within 100 Lower Super Output Areas (LSOA). Selection was conducted by stratifying by region and other key variables (ONS defined Urban/Rural and Indices of Multiple Deprivations (IMD)).
The sampling frame for the face to face element uses a stratified clustered probability sample design. The survey samples 100 Lower Super output level areas, from over 35,000 in the United Kingdom, with a probability of selection that is proportional to size. Each LSOA sector is known as a primary sampling unit (PSU).
The PSUs are stratified by 27 regions and also by three other variables, described below, derived from the 2011 Census of Population. Stratifying ensures that the proportions of the sample falling into each group reflect those of the population. This deliberate component of the design also targeted poorly connected and low-responding hard-to-reach groups.
From this total population, 100 LSOAs were selected at random and exclusive to those selected for wave one, and each defined as a Primary Sampling Unit (PSU) to be allocated to a specific interviewer. Once selected, each PSU was then attributed with a quota ensuring that interviewers achieved a representative sample for that region and that minimum sufficient numbers for key groups were met.
Targeting poorly connected households and hard-to-reach groups
It was an important consideration to ensure that the resulting data was as representative as possible. Although the internet is an increasingly ‘normalised’ mode of responding to surveys, there is a significant proportion of people who are not online or at least not online often (9% of adults in Great Britain have not used the internet at least weekly in 2019.[footnote 3] Consistent with the approach at wave one, to ensure that the sample included those who are not heavy online users and that there would be sufficient responses from young, the very old, deprived, BAME and hard-to-reach respondents the face-to-face sample was skewed slightly towards LSOAs that have a higher than average population of these groups. Calibration weighting at the data analysis stage corrected for any slight oversampling.
Sampling stratification
Within the population of interest, it is often key to explore how views may differ within groups and areas of key interest relative to the study subject matter. Proportionately dividing the sample into these groups is used to stratify the sample. This means that the population as well as the sample will be divided into subpopulation / subsamples described by stratification variables.
A 240-cell sample stratification matrix was devised for the Public Attitudes to Trade study, with the targets within each cell informed by the 2018 ONS mid-year population estimates.[footnote 4] This was entirely consistent with the selection process utilised in wave one 2018.
Using pre-set targets within each sample stratification cell for ‘initial sample drawn’, the sample was drawn on a ‘1 in n’ basis. These cells are listed below in Table 1.
Table 1: Variables used in sample stratification
| Variables used in the sample stratification | |
|---|---|
| English region / devolved nation (x12) | East Midland |
| East of England | |
| London | |
| North East | |
| North West | |
| South East | |
| South West | |
| West Midlands | |
| Yorkshire and The Humber | |
| Scotland | |
| Northern Ireland | |
| Wales | |
| Urban / Rural (multiplied by 2 classifications) | Urban |
| Rural | |
| Indices of Multiple Deprivation (multiplied by 10 indices) | 1 to 10 |
Quota sampling and probability sampling
The aim of probability sampling is to generalise, or make inferences, about the whole population sampled from, and to be able to quantify the precision of this inference. The statistical theory which underpins this only applies if the sample is unbiased – i.e. there is no systematic difference from the ‘true’ population – and each respondent in the population has a known non-zero probability of selection.
Probability samples of households have traditionally been conducted face-to-face, with the sample selected from the Postcode Address File (PAF). Combined with the need to make repeated efforts to interview a sampled respondent, this methodology can be very expensive and time-consuming. Although quota samples are traditionally considered quicker and cheaper than probability samples, we made sure that due care and attention was given to training interviewers, randomly selecting data collection points in their areas.
That said, any differences observed in the data need to be interpreted with caution. There are a number of issues with using formal statistical significance tests on quota sample data - for example bias and lack of known sampling probability. Strictly speaking, confidence intervals cannot be applied to quota samples because they do not use equal or known probabilities of selection. However, it is common practice to derive them and this can give some indication of the relative levels of variation to help users of the data understand that the percentages provided are statistics, not absolute numbers.
Quotas
When utilising a split sample of post to online and face to face CASI, a number of controls need to be put in place to guarantee a balanced final sample; this is most related to the response rates and timeliness of response from post to online sample.
Regional quotas for the initial 2,000 interviews were defined as set out in Table 2. Additional boosts within devolved nations were established to allow for representative bases within each country for robust analysis which brought the final sample size up to 2,349[footnote 5].
Table 2: Country targets [footnote 6]
| Devolved nation | Natural fallout from 2,000 sample | Boost | Post to online | Face to face CASI | Total | Margin of error (95%) |
|---|---|---|---|---|---|---|
| England | ~1,680 | 0 | 840 | 840 | 1,680 | 2.37 |
| Scotland | ~160 | 40 | 100 | 100 | 200 | 6.92 |
| Wales | ~100 | 100 | 100 | 100 | 200 | 6.92 |
| Northern Ireland | ~60 | 140 | 100 | 100 | 200 | 6.92 |
| Total | 2,000 | 280 | 1,140 | 1,140 | 2,280 | 2.03 |
Regional quotas were established, which interlocked between age and gender. These were based on ONS 2018 mid-year population estimates. The exact targets are outlined below in Table 3. Based on the rate of initial post to online completes received and the frequencies of age / gender categories that responded, proportional quotas were then modelled for the face to face methodology so that residents could be targeted per location. These estimated regional targets are outlined in Table 4 below.
Whilst these quotas were soft, they allowed for the specific targeting of household residents aged 16 to 54, who are least likely to respond to the postal invitations.
Table 3: Total regional and devolved nation targets
| Region | Target | 16 to 24 | 25 to 34 | 35 to 44 | 45 to 54 | 55 to 64 | 65 to 74 | 75 and above |
|---|---|---|---|---|---|---|---|---|
| East Midlands | 145 | 21 | 22 | 21 | 26 | 21 | 19 | 15 |
| East of England | 186 | 23 | 29 | 29 | 33 | 27 | 24 | 20 |
| London | 263 | 35 | 63 | 52 | 43 | 30 | 21 | 18 |
| North East | 81 | 12 | 13 | 11 | 14 | 13 | 11 | 9 |
| North West | 220 | 31 | 36 | 33 | 39 | 32 | 27 | 22 |
| Northern Ireland | 200 | 29 | 34 | 33 | 35 | 29 | 23 | 18 |
| Scotland | 200 | 27 | 32 | 30 | 36 | 31 | 25 | 20 |
| South East | 274 | 36 | 41 | 44 | 49 | 39 | 35 | 29 |
| South West | 171 | 22 | 24 | 24 | 29 | 26 | 24 | 20 |
| Wales | 200 | 28 | 30 | 28 | 34 | 30 | 28 | 22 |
| West Midlands | 175 | 25 | 29 | 26 | 30 | 25 | 22 | 18 |
| Yorkshire and The Humber | 165 | 24 | 27 | 25 | 29 | 24 | 20 | 17 |
| Total | 2,280 | 315 | 380 | 356 | 396 | 327 | 278 | 227 |
Table 4: Estimated regional and devolved nation face to face targets
| Region | Target | 16 to 24 | 25 to 34 | 35 to 44 | 45 to 54 | 55 to 64 | 65 to 74 | 75 and above |
|---|---|---|---|---|---|---|---|---|
| East Midlands | 72 | 14 | 11 | 10 | 12 | 10 | 8 | 7 |
| East of England | 94 | 15 | 17 | 14 | 16 | 12 | 11 | 9 |
| London | 132 | 22 | 32 | 27 | 20 | 14 | 9 | 8 |
| North East | 35 | 6 | 6 | 4 | 6 | 6 | 4 | 3 |
| North West | 111 | 20 | 19 | 16 | 18 | 15 | 13 | 10 |
| Northern Ireland | 100 | 18 | 18 | 15 | 17 | 14 | 10 | 8 |
| Scotland | 100 | 17 | 17 | 16 | 17 | 14 | 11 | 8 |
| South East | 141 | 25 | 22 | 21 | 24 | 18 | 17 | 14 |
| South West | 85 | 14 | 14 | 11 | 14 | 12 | 11 | 9 |
| Wales | 100 | 17 | 16 | 14 | 16 | 14 | 13 | 10 |
| West Midlands | 88 | 16 | 16 | 12 | 14 | 11 | 9 | 7 |
| Yorkshire and The Humber | 82 | 15 | 14 | 12 | 14 | 11 | 9 | 7 |
| Total | 1,140 | 199 | 202 | 172 | 188 | 152 | 126 | 101 |
Questionnaire design
Following considerable work developing the questionnaire in advance of wave one, most of the questions included in the questionnaire at wave two remained identical, with a similar order and structure of sections so as to minimise potential order effects. However, a number of additions and changes were made at wave two, including:
- additional questions which examined respondents’ awareness and priorities as they relate to the process of trade agreement continuity work being carried out by DIT
- new questions exploring respondents’ perceptions as to the quality of consumer goods in a variety of countries
- building on what was asked at wave one, the questionnaire explored respondents’ priorities for free trade agreements with individual countries, rather than simply their priorities for free trade agreements more generally
Cognitive interviewing
The quality of data collected in a survey is partially determined by the notion that the meaning of the question as written by the questionnaire designer is consistent with the way respondents interpret it.
Pretesting attempts to ensure this by subjecting the questionnaire to some type of evaluation, to assess its ability to collect the desired data.
A commonly used method of pretesting, the cognitive interview, has traditionally been used as a front-end tool for identifying problems in a questionnaire at a relatively early stage of its development. Currently, cognitive interviewing[footnote 7] is the most widely used pretesting tool, in which respondents are asked to report directly on the internal cognitive processes employed to answer survey questions. Interviewers often probe the meaning of specific terms or the intent of specific questions throughout the interview. Generally, only a very small number of purposively chosen respondents are interviewed and the results are not generalisable to a larger population.
For this Wave, a total of 14 questions were tested in 10 verbal cognitive interviews. Given that extensive testing had been conducted at wave one, the questions tested focused on potential new additions and amended questions.
Interviews were conducted either face-to-face or via telephone between Monday 20 May and Sunday 26 May 2019. Cognitive interview participants completing interviews via telephone were emailed a copy of the questionnaire prior to the interview. Participants completing the interview face-to-face were asked to complete the cognitive interview using paper versions of the cognitive specific survey.
Interviews were conducted with a broad demographic and regional mix of participants.
Interviews followed a verbal probe approach using a semi-concurrent probing technique. Participants were asked to complete the survey in sections. Following each section, participants were asked about their experiences when answering each of the questions in the previous section. Many probes were tailored to be question specific, but typical probes included:
- how did you find answering this question?
- can you tell me in your own words what the question was asking?
- how easy or difficult did you find this question to answer?
- what did [insert question or response term] mean to you?
The changes recommended were mostly nuances to question wording to enable greater audience comprehension, alongside minor routing edits.
Questionnaire scripting, testing and review
The final scripted questionnaire was signed-off ahead of a soft-launch phase to gather around 100 responses.
As a result of the initial soft launch, interim top-line results were extracted and reviewed to ‘sense-check’ the data, the number of valid responses, and variance in response distribution ahead of agreement on the study being fully launched.
Data collection
Post-to-online:
All 6,120 sampled households were sent an initial invitation and reminder letters were sent to those who had not yet completed the survey. The letters contained information about the purpose of the survey, instructions on what to do including login details, and contact details for the BMG Research support-line should they have difficulties taking part (this included a freephone number, email address and FAQs on the BMG website).
Table 5: Invitations and reminders
| Letter sent | Number of letters sent | Number of completed surveys | Response rate of letters sent |
|---|---|---|---|
| Initial invitation | 6,120 | 239 | 3.9% |
| First reminder | 5,897 | 385 | 6.5% |
| Second reminder | 5,455 | 280 | 5.1% |
| Third reminder | 5,043 | 226 | 4.4% |
Out of the 6,120 letter invitations posted, 1,130 responded by completing the online survey which gave a response rate of 19%. In our experience, this response rate is in line with similar postal surveys with full governmental branding. Only ONS census postal experiments have received higher response rates from a random probability sample.
In order to ensure sufficient bases for all devolved nations, the main sample was boosted in each of the devolved nations. Completes in each region, including comparative figures for wave one, are outlined in Table 6 and Figure 1.
A total of 2,349 completed surveys were achieved, 69 greater than the target of 2,280. This slight increase was a by-product of the split sample methodology, with a final batch of post to online completes submitted towards the end of the fieldwork period; whereby assumed shortfalls in this half of the methodology had been covered in the face to face element.
Table 6: Total unweighted and weighted completes
| Region | Wave 1: Unweighted Counts | Wave 2: Unweighted Counts | Wave 1: Weighted Counts | Wave 2: Weighted Counts |
|---|---|---|---|---|
| England | 1,819 | 1,747 | 2,017 | 1,973 |
| Scotland | 202 | 202 | 202 | 198 |
| Wales | 213 | 203 | 115 | 113 |
| Northern Ireland | 166 | 197 | 66 | 65 |
| Total | 2,400 | 2,349 | 2,400 | 2,349 |
Figure 1: Geographic distribution of Public Attitudes Tracker sample
| Geographic locations | Sample distribution |
|---|---|
| South East | 14% |
| London | 11% |
| North West | 10% |
| East of England | 9% |
| Scotland | 9% |
| Wales | 9% |
| Northern Ireland | 8% |
| West Midlands | 7% |
| South West | 7% |
| Yorkshire and Humber | 7% |
| East Midlands | 6% |
| North East | 3% |
Unweighted base: All respondents (2,349)
Weighting
Weights are applied to survey data to ensure that they match the profile of the population of interest (in this case national representativeness of the UK public).
Weighting schema
Results were merged and calibration weighing applied to the profile of UK adults.
Weighting targets were defined by:
- 2018 ONS Mid-year population estimates: proportional by Age, Gender and Region[footnote 8]
- the Index of Multiple Deprivation (IMD)
- statistics from the Electoral Commission on EU Referendum Vote[footnote 9]
Table 7, below, outlines the effective sample sizes post weighting across each region:
Table 7: Country effective sample sizes
| Region | Unweighted sample size | Effective sample size | Effective Proportion |
|---|---|---|---|
| England | 1,747 | 1,605 | 92% |
| Scotland | 202 | 186 | 82% |
| Wales | 203 | 175 | 86% |
| Northern Ireland | 197 | 148 | 75% |
| Total | 2,349 | 2,015 | 86% |
Tables 8.1, 8.2, 9 and 10 outline the weighted composition of the final sample by age, gender, region and EU Referendum Vote.
Table 8.1: Country population weight by gender
| Gender | Age | England | Scotland | Wales | Northern Ireland |
|---|---|---|---|---|---|
| Male | 16 to 24 | 14.37% | 14.18% | 14.92% | 15.42% |
| 25 to 34 | 17.34% | 16.60% | 15.54% | 17.11% | |
| 35 to 44 | 16.11% | 15.11% | 14.10% | 16.28% | |
| 45 to 54 | 17.49% | 17.92% | 17.01% | 17.88% | |
| 55 to 64 | 14.18% | 15.61% | 15.14% | 14.69% | |
| 65 to 74 | 11.90% | 12.29% | 13.72% | 11.12% | |
| 75 and above | 8.60% | 8.29% | 9.57% | 7.50% | |
| Total Male | 100% | 100% | 100% | 100% |
Table 8.2: Country population weight by gender
| Gender | Age | England | Scotland | Wales | Northern Ireland |
|---|---|---|---|---|---|
| Female | 16 to 24 | 13.09% | 12.92% | 13.26% | 13.76% |
| 25 to 34 | 16.48% | 15.78% | 14.50% | 16.54% | |
| 35 to 44 | 15.60% | 14.56% | 13.78% | 16.25% | |
| 45 to 54 | 17.19% | 17.69% | 17.00% | 17.59% | |
| 55 to 64 | 14.02% | 15.25% | 15.16% | 14.17% | |
| 65 to 74 | 12.29% | 12.50% | 13.87% | 11.40% | |
| 75 and above | 11.33% | 11.30% | 12.43% | 10.29% | |
| Total Female | 100% | 100% | 100% | 100% |
Table 9: Region proportional population weight
| Region | Weight |
|---|---|
| East | 9% |
| East Midlands | 7% |
| London | 13% |
| North East | 4% |
| North West | 11% |
| Northern Ireland | 3% |
| Scotland | 8% |
| South East | 14% |
| South West | 9% |
| Wales | 5% |
| West Midlands | 9% |
| Yorkshire and The Humber | 8% |
| Total | 100% |
Table 10: EU Referendum voting behaviour weight
| EU Referendum vote | Weight |
|---|---|
| Leave | 37.44% |
| Remain | 34.71% |
| Did not vote | 27.85% |
| Total | 100% |
Date and rate of response
As illustrated in Figure 2, face-to-face fieldwork experienced a slow and progressive start, with survey completes spiking after two weeks of thorough door knocking by interviewers. This allowed for appointments to be established and addresses that were not willing to be engaged eliminated from the selected sample pool.
Figure 2: Number of Face to Face CAPI completions by date
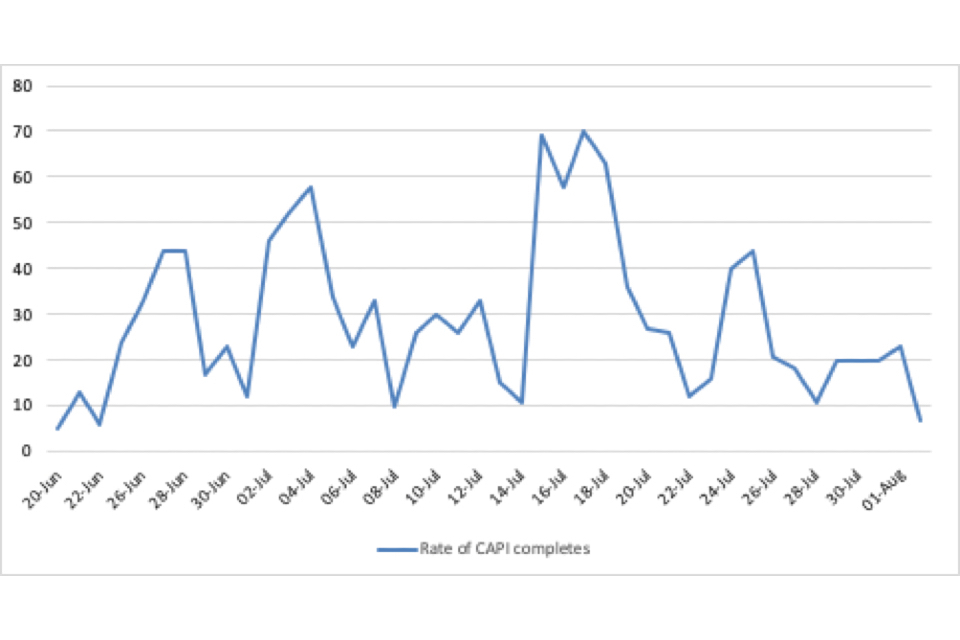
Line graph showing number of face-to-face CAPI surveys completed by date
Postal to online completions saw an entirely different rate of delivery, as illustrated below in Figure 3. Spikes in numbers of completes can be attributed to the sending of initial invitation letters and subsequent rounds of reminder letters, each instigating a near-instant response.
Figure 3: Number of Postal to Online CAWI completions
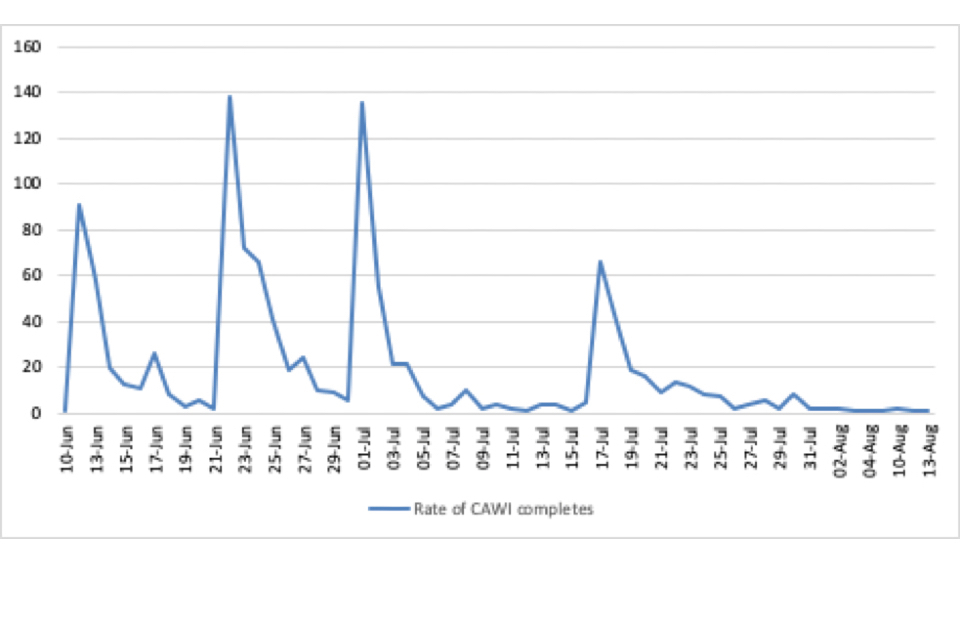
Line graph showing number of postal and online CAWI surveys completed by date
Data processing
With the exception of the coding of responses to open-ended questions, no data entry phase was required for this CAPI and CAWI survey. The programmed script ensured that all question routing was performed automatically and no post-editing of the data was required in the way that might be necessary for surveys administered using a ‘Pencil and Paper’ method.
Responses from fully open-ended questions were collated and code frames created to reflect all key themes in the responses. Responses from questions with an ‘other – specify’ option were analysed and, if appropriate, back-coded into one of the pre-coded categories. If the response could not be assigned to an existing code but gained a sufficient number of mentions, a new code was created which all relevant responses were assigned to. Coding was carried out by a specialist team. All coders who worked on the study were briefed on the subject matter of the study and a written set of instructions was made available to ensure accuracy. Code frames were created by the coding team in the first instance and approved by the research team.
Survey structure
Published as a separate document, see public attitudes to trade tracker: wave 2 survey
-
For more information on interviewer effects, please see West, T. ‘Explaining Interviewer Effects: A Research Synthesis’ (2016) ↩
-
ONS: Internet access for households and individuals, Great Britain: 2019 ↩
-
A total of 2,349 completed surveys were achieved, 69 greater than the target of 2,280. This slight increase was a by-product of the split sample methodology, with a final batch of post to online completes submitted towards the end of the fieldwork period; whereby assumed shortfalls in this half of the methodology had been covered in the face to face element. ↩
-
The margin of sampling error describes how close we can reasonably expect a survey result to fall relative to the true population value. ↩
-
The Psychology of Survey Response by Roger Tourangeau; Lance J. Rips; Kenneth Rasinski ↩