Public attitudes to data and AI: Tracker survey (Wave 2)
Published 2 November 2022
1. Foreword
The Centre for Data Ethics and Innovation (CDEI) leads the UK government’s work to enable trustworthy innovation in data-driven technologies and AI. As such, it is critical to understand public priorities and concerns for these technologies.
Greater data access has the potential to change our lives for the better. The more accurate information we have, the easier it is to solve complex problems and make informed decisions. From civil society-led global dashboards to monitor COVID-19, to DeepMind’s breakthrough AlphaFold solution to predict protein structures, we live in a time where the opportunities of data and AI use are becoming clearer by the day.
Despite the potential benefits, there are public concerns about increasing the use of data. Citizens want to know that information about them is being used responsibly and stored safely; and to understand how data is informing decisions being made about them. Low public trust acts as a barrier to data-driven innovation. For example, without justified trust, citizens may be wary of opting-in to data sharing schemes that could deliver wide public benefits, leading to unrepresentative datasets and risks of unfair outcomes.
Building on Wave 1, this second iteration of the Public Attitudes to Data and AI (PADAI) Tracker Survey, provides insight into issues including where citizens see the greatest value in data use, where they see the greatest risks, trust in institutions to use data, and preferences for data sharing.
Public attitudes towards data use are, of course, context dependent, and vary across the population based on existing views and experiences. To draw out these nuances, the CDEI used a large sample of over 4,000 respondents, and also conducted telephone interviews with an additional 200 respondents with very low levels of digital familiarity.
This tracker survey, alongside other qualitative and quantitative research at CDEI, provides an evidence base which sits at the heart of our work on responsible innovation. For example, the survey’s research findings on demographic data will inform work to support organisations to access demographic data to monitor their products and services for algorithmic bias.
We want this report to be used by the wider data ecosystem, including government, industry and civil society - and we are grateful to those of you who have contributed to the design of the survey. Beyond this summary report, we have provided the survey’s raw data to enable further analysis and support organisations to innovate in data and AI. We would welcome further thoughts about how to make this research as useful as possible, and are always keen to hear how you are using these findings at public-attitudes@cdei.gov.uk.
We hope you find this work useful, and look forward to working with you to help achieve trustworthy innovation in data and AI.
Edwina Dunn, Chair, CDEI Advisory Board
2. Executive summary
Below is a summary of the key findings of this Wave 2 report (June - July 2022), and how these findings differ from Wave 1 (November - December 2021):
1. Health and the economy are perceived as the greatest opportunities for data use.
‘Health’ and ‘the economy’ represent the greatest perceived opportunities for data to be used for public benefit. These mirror the areas where the public perceive the biggest issues facing the UK: ‘the economy’ and ‘tax’ have both increased in importance as key issues faced by the UK since the last wave, while health remains a priority issue. In general, UK adults remain broadly optimistic about data use, with reasonably high agreement that data is useful for creating products and services that benefit individuals, and that collecting and analysing data is good for society. Nevertheless, it is important to recognise that differences persist across population groups, with younger people, and those within higher socio-economic grades, seeing various aspects of data use in a more positive light.
2. Data security and privacy are the top concerns, reflecting the most commonly recalled news stories.
UK adults report a slight increase in perceived risks related to data security since December 2021, with ‘data not being held securely / being hacked or stolen’ and ‘data being sold onto other organisations for profit’ representing the two greatest perceived risks. These concerns are reflected in the news stories that people recall about data, resulting in a predominantly negative overall recall. At the same time, the UK adult population expresses low confidence that concerns related to data are being addressed.
3. Trust in data actors is strongly related to overall trust in those organisations.
Trust in actors to use data safely, effectively, transparently, and with accountability remains strongly related to overall trust in those organisations to act in one’s best interests. This is therefore affected by other events which impact on the level of trust in those organisations (such as public discussions about the current energy crisis, and mismanagement of sewage affecting public trust in utility companies). While trust in the NHS and academic researchers to use data remains high, a drop in the public’s trust in the government and utility companies and their data practices has been reported since the previous wave. Trust in big technology companies to act in people’s best interest has also fallen since 2021, particularly amongst those who are most positive and knowledgeable about technology. Trust in social media companies remains low.
4. UK adults do not want to be identifiable in shared data - but will share personal data in the interests of protecting fairness.
When it comes to data governance, people want their data to be managed by experts, and for the privacy of their data to be prioritised. ‘Identifiability’ stands out as the most important consideration for an individual to be willing to share data, and UK adults express a clear preference that they are not personally identifiable in data that is shared. People also express a preference for experts to be involved in the decision-making process for data sharing, over a public or self-assessed review.
While identifiability is the most important criterion driving willingness to share data, the wider UK adult population is willing to share demographic data for the purpose of evaluating systems for fairness towards all groups. The proportion of people who would be comfortable sharing information about their ethnicity, gender, or the region they live in, to enable testing of systems for fairness is 69%, 68% and 61% respectively. In comparison, adults with very low digital familiarity are less comfortable sharing information about their ethnicity (47%), gender or region they live in (both 55%).
5. The UK adult population prefers experts to be involved in the review process for how their data is managed.
Out of all types of governance tested, people value the involvement of experts in the review process over the involvement of the public, self-assessed review, or no review, suggesting that the public prefers to delegate decisions around data management to professionals skilled in this field. This preference for experts to be involved in decision-making processes related to shared data is stronger among adults with low levels of trust in institutions tested compared to those with high levels of trust.
6. People are positive about the added conveniences of AI, but expect strong governance in higher risk scenarios.
The UK adult population has a positive expectation that AI will improve the efficiency and effectiveness of regular tasks. However, public views are split on the fairness of the impact of AI on society, and on the effect AI might have on job opportunities. People have higher demands for governance in AI use cases that are deemed higher risk or more complex, such as in healthcare and policing. Healthcare is the area in which UK adults expect there to be the biggest changes as a result of AI. However, overall AI still ranks fairly low against other societal concerns, signalling this is not yet a front of mind topic or concern for people.
7. Those with very low digital familiarity express concerns about the control and security of their data, but are positive about its potential for society.
Members of the public with very low digital familiarity have low confidence in their knowledge and control over their personal data, with the majority saying that they know little or nothing about how their data is used and collected (76%). Few feel that their data is stored safely and securely (28%). As a result, they are less likely than the wider UK adult population to feel they personally benefit from technology. However, they are reasonably open to sharing data to benefit society, and the majority consider collecting and analysing data to be good for society (57%).
3. Overview
The Centre for Data Ethics and Innovation (CDEI)’s Public Attitudes to Data and AI (PADAI) Tracker Survey monitors public attitudes towards data and AI over time. This report summarises the second wave (Wave 2) of research and makes comparisons to the first wave (Wave 1). The research was conducted by Savanta ComRes on behalf of the CDEI.
The research uses a mixed-mode data collection approach comprising online interviews (Computer Assisted Web Interviews - CAWI) and a smaller telephone survey (Computer Assisted Telephone Interviews - CATI) to ensure that those with low or no digital skills are represented in the data.
The Wave 1 online survey (CAWI) ran amongst the general adult population (18+) from 29th November 2021 to 20th December 2021 with a total of 4,250 interviews collected in that time frame. A further 200 Telephone interviews (CATI) with the ‘very low digital familiarity’ sample were conducted between 15th December 2021 and 14th January 2022.
For Wave 2, there were a total of 4,320 online surveys (CAWI) across a demographically representative sample of UK adults (18+). This survey ran from 27th June 2022 to 18th July 2022. A further 200 UK adults were interviewed via telephone (CATI) between 1st and 20th July 2022. Any respondents who participated in Wave 1 of the online survey were excluded from participation in Wave 2. This was done to ensure that the surveyed sample does not include any individuals who have built up knowledge in this area by filling in the Wave 1 survey.
With thanks to Better Statistics and the Office for Statistical Regulation for their ongoing support and advice with the methodological approach for this survey.
Please see the ‘Methodology’ section at the end of this report for further detail.
4. The value of data for society
Health and the economy have risen above COVID-19 as the areas with greatest perceived opportunities for data to bring benefits to the public. People remain optimistic about data use, with reasonably high agreement that data is useful for creating products and services that benefit individuals.
Opinions on the greatest opportunities for data use to benefit the public have shifted since 2021, reflecting a shift in public priorities. 20% of people surveyed consider ‘health’ to be the issue where data presents the greatest opportunity to benefit the public, compared to 14% in 2021. The proportion of respondents selecting ‘COVID-19’ as an opportunity area for data use has declined from 20% in 2021 to 8% in 2022. ‘The economy’ and ‘tax’ have both risen as perceived opportunities for data use, with ‘the economy’ rising from 7% in 2021 to 15% in 2022, and ‘tax’ rising from 3% to 4% in the same period.
Chart 1: The greatest opportunities for data use to benefit the public, November/December 2021 and June/July 2022 (Showing mentions > 5% for Jun/Jul ‘22)
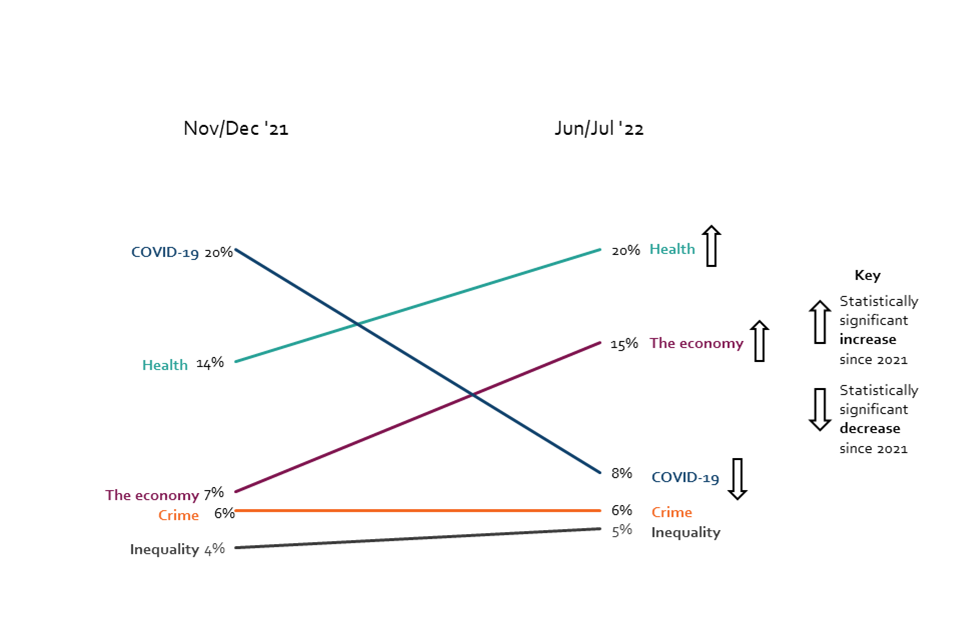
Line chart showing opportunities for data use. Respondents see a bigger opportunity for data use in both health and the economy, compared to the last wave.
Q16. In which of these issues do you think the use of data presents the greatest opportunity for making improvements that benefit the public in this country? BASE: All online respondents: Nov/Dec ’21 (Wave 1) n=4250, Jun/Jul ’22 (Wave 2) n=4320
Where the public sees the potential for data to be used for good is mirrored in what they identify as the biggest issues facing the UK. The economy and health stand out as the top issues, and as ones that present opportunities for data use. While COVID-19 and climate change are both considered to be important issues facing the country (20% and 23% respectively), more UK adults (8%) perceive that data presents an opportunity for improving how we tackle COVID-19, than perceive that data presents an opportunity for making improvements regarding climate change (4%).
In Wave 2, the economy and tax have quickly increased in importance as the most important issues facing the UK. 57% of adults say the economy is the most important issue, compared to 33% in 2021. 18% of people select tax as their top issue, compared to 7% in 2021. The prevalence of COVID-19 as a key issue facing the country has significantly declined. Over half (56%) of the public selected COVID-19 as one of the top three most important issues in 2021, falling to just 20% in 2022.
Chart 2: The most important issues facing the country and opportunities for data use, June/July 2022 (Showing any issues for the UK selected by at least 10% of respondents; axes split along median value)
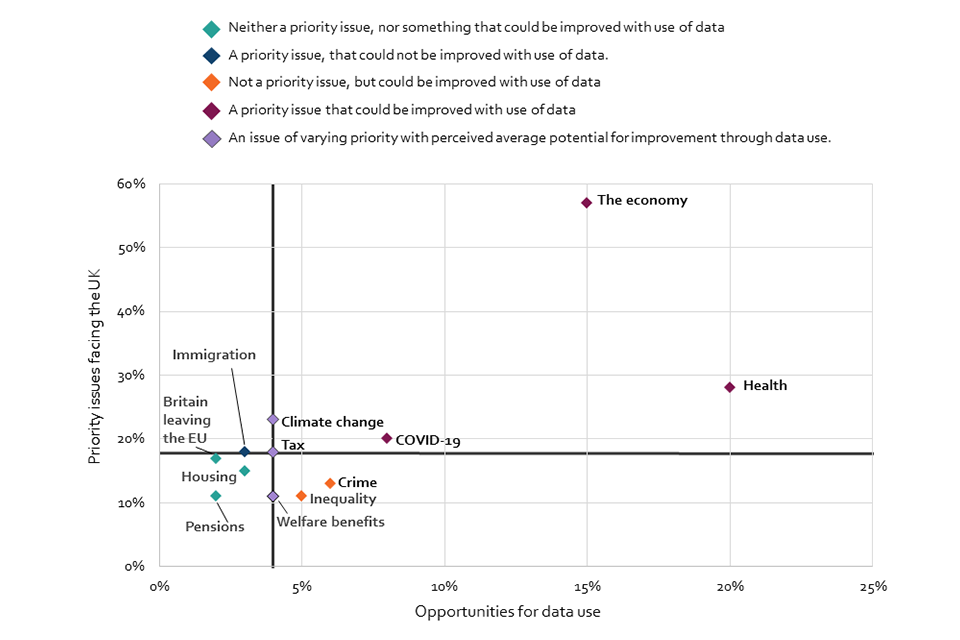
Scatter graph showing the relationship between the most important issues facing the country and the issues presenting the greatest opportunity for data use to benefit the public. The economy and health stand out as the top issues across both metrics.
Q15b. Which of the following do you think are the most important issues facing the country for you personally at this time? Q16. In which of these issues do you think the use of data presents the greatest opportunity for making improvements that benefit the public in this country? BASE: All online respondents: Jun/Jul ’22 (Wave 2) n=4320
There were also several respondents (112) that selected ‘other’ issues that they feel the country is facing, choosing to fill in an elective open-text box. A high proportion of these (67% of all ‘other’ responses) highlighted the ‘cost of living’ as a key concern. Although overall this comprises a small percentage of overall responses, the number of spontaneous mentions indicates it is at the forefront of the public’s mind.
The optimism around data use has remained stable since 2021. When asked how much people agree that ‘data is useful for creating products and services that benefit me’, 53% of respondents agreed (consistent with 51% in 2021), while only 15% disagreed in 2022. In Wave 2, perceptions of the value of data to create products that benefit individuals is more than double amongst those with high digital familiarity, where 62% agree, compared to those with low digital familiarity, where only 27% agree.
The collection and analysis of data is seen in a reasonably positive light, and is in line with the previous wave in 2021. 39% of respondents agreed that ‘collecting and analysing data is good for society’, consistent with 40% in 2021. 22% of the UK adult population disagree with this statement, compared to 20% in 2021.
Regression analysis[footnote 1] indicates greater agreement for both of the abovementioned statements amongst younger respondents and respondents from a higher socio-economic grade (ABC1)[footnote 2] in comparison to older respondents and those from a lower socio-economic grade (C2DE) (Annex, Models 1 & 2). This suggests greater optimism amongst these groups when it comes to the use of data in society.
5. Risks related to data and its portrayal in the media
Chart 3: The greatest risk posed by data use in society, November/December 2021 and June/July 2022 (Showing % selected each option)
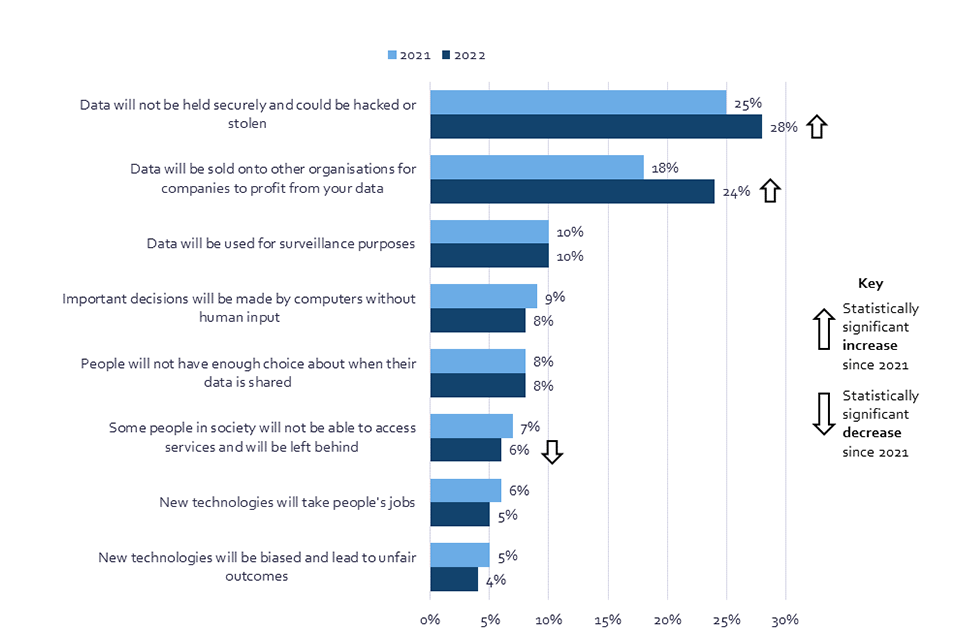
Bar chart shows the change in the proportion of respondents that selected an option as representing the greatest risk for data use in society, in 2021 and 2022.
Q17. Which of the following do you think represents the greatest risk for data use in society? BASE: All online respondents: Nov/Dec ’21 (Wave 1) n=4250, Jun/Jul ’22 (Wave 2) n=4320
The top perceived risks of data use are related to data being hacked or stolen, or being sold on to other companies. These fears reflect the most commonly recalled media stories related to data.
The main perceived risks associated with data use are related to data security and selling data for a profit, both of which have increased in concern since the previous wave of research in 2021. When the UK public was asked to select the greatest risk for data use in society from a list, 28% expressed concern that data will not be held securely and could be hacked or stolen, compared with 25% in 2021, while 24% selected ‘data will be sold onto other organisations for companies to profit’ as the greatest risk, compared with 18% in 2021[footnote 3]. Both of these concerns are especially high amongst those who are aged over 55 (for ‘data will not be held securely’: 32% of those aged 55+, compared to 23% of those aged 18-34; for ‘data will be sold onto other organisations or companies to profit’: 28% of those aged 55+, compared to 21% of those aged 18-34).
Concerns about data security differ across the population. Those who feel they have less knowledge about data and technology are more likely to have concerns surrounding data security. 31% of those who report having little or no knowledge about how the technology sector is regulated select data security as their main concern, compared to 20% of those who know a great or fair amount about regulation. Similarly, those who report little or no knowledge about how data is used and collected in day-to-day life are also more likely to select data security as a concern, with 31% choosing this option, compared to 25% of those who know a great or fair amount about data use.
Conversely, confident technology users are more likely to report concerns about data being sold onto other organisations for profit. 25% of those who report being confident completing activities online say that they are concerned about their data being sold on to other companies, compared to 16% of those who are not confident completing activities online.
A considerable share of UK adults express confidence that their data security and privacy concerns are being addressed. 41% feel that ‘when organisations misuse data, they are held accountable’. Those with a higher digital familiarity are more likely to agree that those who misuse data are held accountable (45% agree), while those with medium or low familiarity express lower confidence (35% for those with low familiarity). Regression analysis indicates that those of Asian ethnicity[footnote 4] are 1.86 times more likely and those from Black ethnicity[footnote 5] 1.43 times more likely than UK adults from a White ethnic background[footnote 6] to express confidence in accountability in instances of data misuse (Annex, Model 3).
There is evidence that suggests that the news media may contribute to negative associations related to data use. When respondents were asked to describe stories they remember seeing or hearing about data, they were predominantly negative, and this has increased since the previous wave in 2021: in 2021, 37% said that the news story about data they could recall was mainly negative, but this has jumped to 53% in 2022. There has been an accompanying decrease in recall of stories that are presented as neutral, from 35% in 2021 to 29% in 2022, or positive, from 25% in 2021 to 15% in 2022. Those with a greater digital familiarity are more likely to recall news stories that are presented in a negative light; 57% of those with high familiarity say that the news story they recalled was mostly negative, compared to 48% of those with a medium digital familiarity, and 38% of those with a low digital familiarity.
Chart 4: The recalled presentation of data in news stories, November/December 2021 and June/July 2022 (Showing % selected each option)
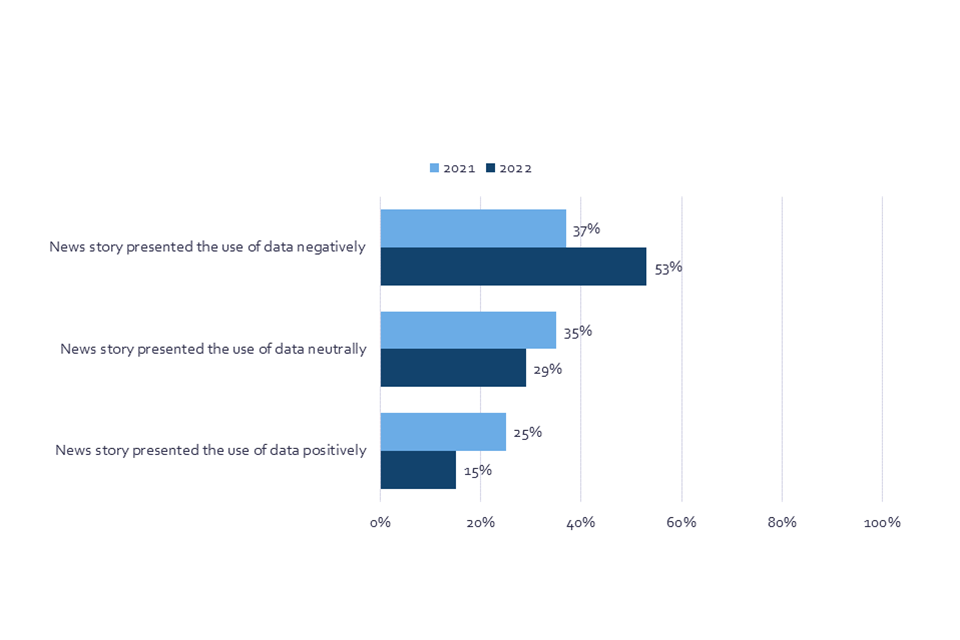
Bar chart that shows the change in the proportion of respondents that said a news story they recalled about data presented the use of data either negatively, neutrally, or positively, in 2021 and 2022.
Q11. Overall, do you think this news story presented the way data was being used positively or negatively? Base: All online respondents who say they have read, seen or heard a news story about data in the last 6 months: Nov/Dec ‘21 (Wave 1) n=1499, Jun/Jul ’22 (Wave 2) n=1678
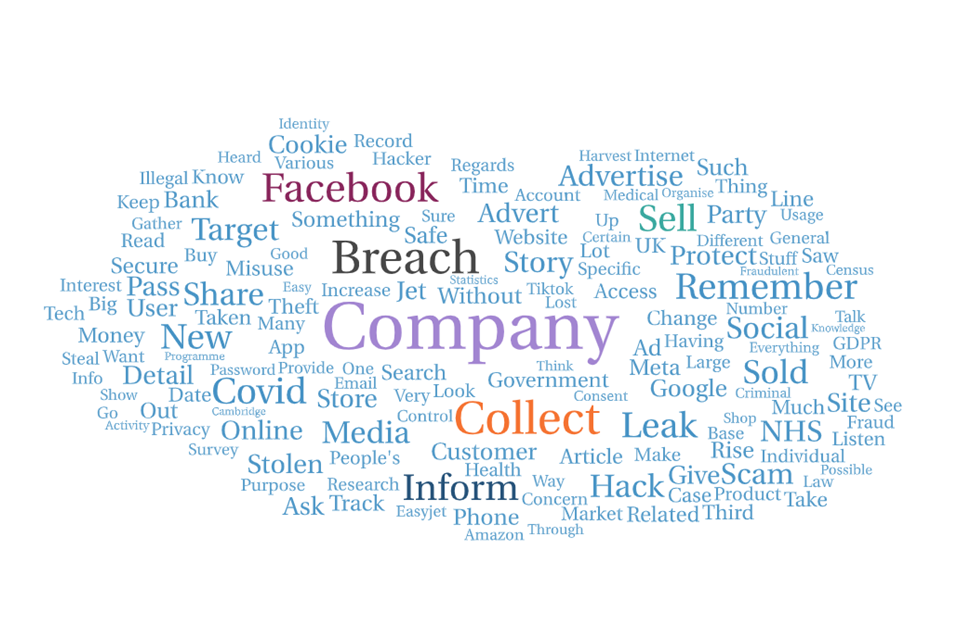
When respondents were asked to describe stories they remember seeing or hearing about data, open-text responses are dominated by references to data breaches, and social media companies’ misuse of data and targeted advertising. Stories about data breaches saw a slight increase in June/July 2022 compared to November/December 2021, with 12% of respondents in 2021 to 14% (346) in this wave.
Media monitoring identifies that this recall reflects the numerous stories about data breaches during this time, including those of health and financial data as well as cyber attacks and data breaches in relation to the war in Ukraine which were prominent in the first months of 2022. Respondents’ recall of news stories about the use of data by social media platforms including Facebook/Meta, TikTok, and Instagram are common.
Of the number of media stories that UK adults could recall about data, just 4% were related to COVID-19 in 2022, compared to 13% in 2021. Of the recalled stories in Wave 2, 3% referenced health data and the NHS. Recall of media stories also highlight changing laws and regulations around GDPR and cookies.
Image 1: Word cloud of public recall of data-related news stories
Word cloud of public recall of data-related news stories
Q10. In a couple of sentences, please could you briefly tell us what the story you saw about data was about? Base: All CAWI respondents who say they have seen a news story about data in the last 6 months: Jun/Jul ’22 (Wave 2) n=1725. Size of words corresponds to the number of times they occur in responses. All words mentioned nine times or less are removed.
Spontaneous recall of data-related news stories vary by levels of digital familiarity. Those with a high digital familiarity recall a wide range of news stories, with positive stories focused on benefits of data to society, such as the use of data in the response to COVID-19, uses of census data, and other data that helps us gain a better understanding of business, society, and our world. Negative stories recalled by those with high digital familiarity are predominantly stories related to data and security, and often demonstrate a good level of technical knowledge about the stories, for example mentioning use of cookies, companies passively collecting data from phones, social media bots, and blockchain technology.
Image 2: Word cloud of public recall of data-related news stories – by UK adults who recall that the story was mainly positive, and have high digital familiarity.

Word cloud of public recall of data-related news stories – by UK adults who recall that the story was mainly positive, and have high digital familiarity
Q10. In a couple of sentences, please could you briefly tell us what the story you saw about data was about? Base: All online respondents who say they have seen a news story about data in the last 6 months, and who say that story was mainly positive, and who have high digital familiarity: Jun/Jul ’22 (Wave 2) n=156. Size of words corresponds to the number of times they occur in responses. All words mentioned two times or less are removed.
Image 3: Word cloud of public recall of data-related news stories – by UK adults who recall that the story was mainly negative, and have high digital familiarity.

Word cloud of public recall of data-related news stories – by UK adults who recall that the story was mainly negative, and have high digital familiarity.
Q10. In a couple of sentences, please could you briefly tell us what the story you saw about data was about? Base: All online respondents who say they have seen a news story about data in the last 6 months, and who say that story was mainly negative, and who have high digital familiarity: Jun/Jul ’22 (Wave 2) n=596. Size of words corresponds to the number of times they occur in responses. All words mentioned four times or less are removed.
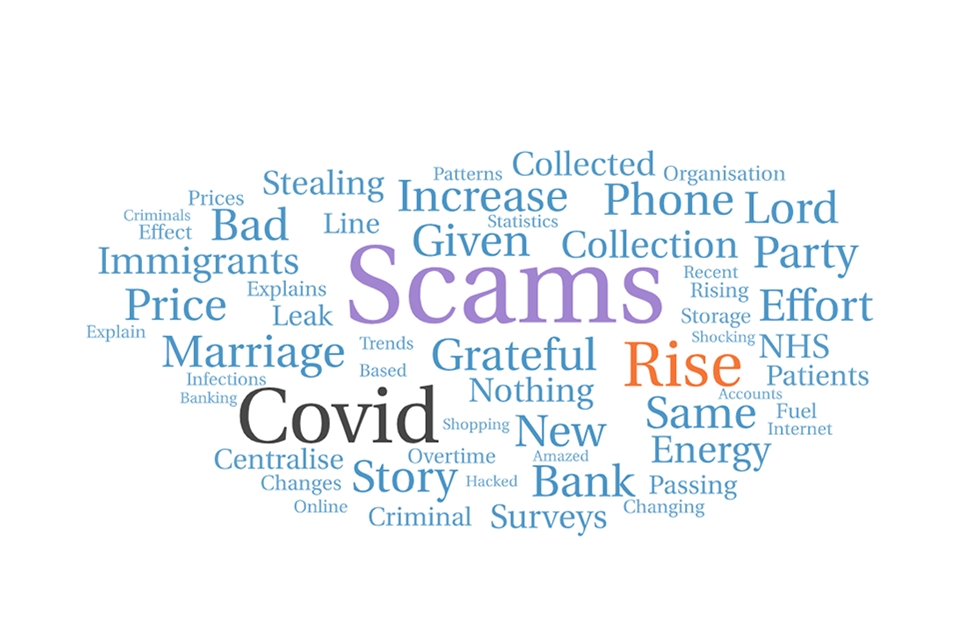
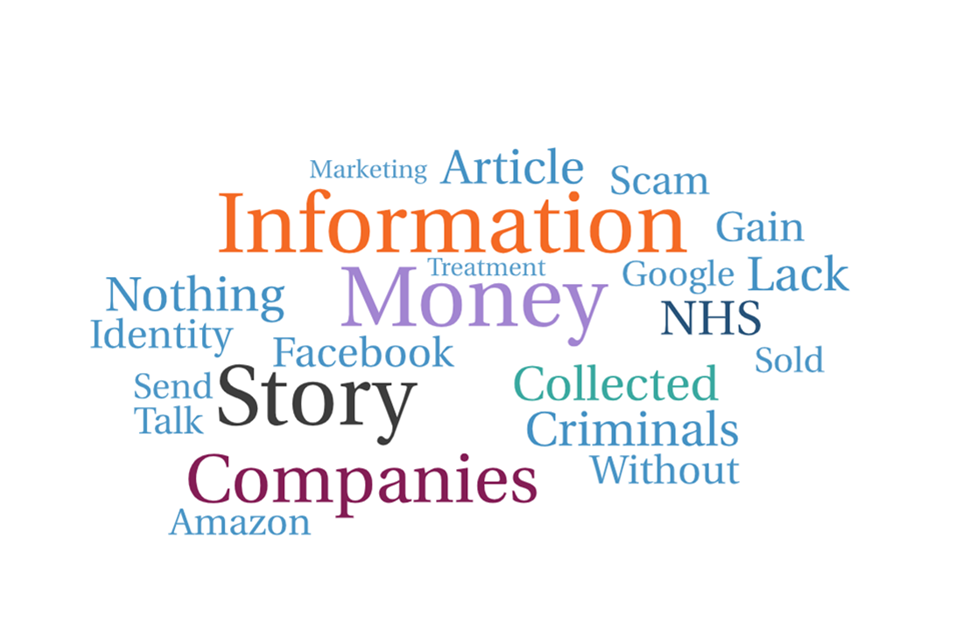
Those with low digital familiarity also recall media stories that fall into similar themes as those with higher digital familiarity, but express a smaller range in topics, with concerns about data breaches and scams dominating both positive and negative stories that are recalled. Far less technical detail is mentioned, compared to those with high digital familiarity, meaning the stories recalled are more limited to a description of risk and impact of these risks.
Image 4: Word cloud of public recall of data-related news stories – by UK adults who recall that the story was mainly positive, and have low digital familiarity (*low base size).
Word cloud of public recall of data-related news stories – by UK adults who recall that the story was mainly positive, and have low digital familiarity (*low base size)
Q10. In a couple of sentences, please could you briefly tell us what the story you saw about data was about? Base: All online respondents who say they have seen a news story about data in the last 6 months, and who say that story was mainly positive, and who have low digital familiarity: Jun/Jul ’22 (Wave 2) n=28*. Size of words corresponds to the number of times they occur in responses.
Image 5: Word cloud of public recall of data-related news stories – by UK adults who recall that the story was mainly negative, and have low digital familiarity (*low base size).
Word cloud of public recall of data-related news stories – by UK adults who recall that the story was mainly negative, and have low digital familiarity (*low base size)
Q10. In a couple of sentences, please could you briefly tell us what the story you saw about data was about? Base: All online respondents who say they have seen a news story about data in the last 6 months, and who say that story was mainly negative, and who have low digital familiarity: Jun/Jul ’22 (Wave 2) n=40*. Size of words corresponds to the number of times they occur in responses. All words mentioned once are removed.
While UK adult recall of media stories related to data is fairly low, it is predominantly negative. Only 40% of UK adults recall a story about data in the last 6 months. Those who have greater knowledge about technology are more likely to report a higher recall of media stories about data. 52% of those who report that they have a great or fair amount of knowledge about how their data is used and collected in day-to-day life recall seeing a news story related to data, compared to 31% of those who say they know just a little or nothing at all.
It is also worth noting that recall of news stories being predominantly negative could in part be explained by a higher number of negative news stories in the media, people being more likely to remember the negative stories, and the fact that when data plays a role in facilitating a positive outcome it can be the outcome that is the focus, whereas the data takes ‘centre stage’ when something goes wrong.
6. Trust in data actors
Trust in organisations to use data safely, effectively, transparently and with accountability remains strongly related to overall trust in those organisations to act in one’s best interests.
Trust in data actors to act in one’s best interest follows a very similar pattern to trust in these actors to take actions with data safely, effectively, transparently, and with accountability. The majority of UK adults, 73%, select the NHS as the most trusted actor to take actions with data safely, effectively, transparently, and with accountability. This is followed by researchers in two different areas: academic researchers (61%) and researchers at pharmaceutical companies (57%). Next, 49% of UK adults trust regulators to use data and a slightly lower share of people trust utility providers (45%) and big technology companies (43%) to do so. Trust levels in data practices of the government and social media companies are rather low compared to other actors tested (40% and 30% respectively).
Table 1: Trust in organisations, and in their actions with data (Showing % Sum: Trust)
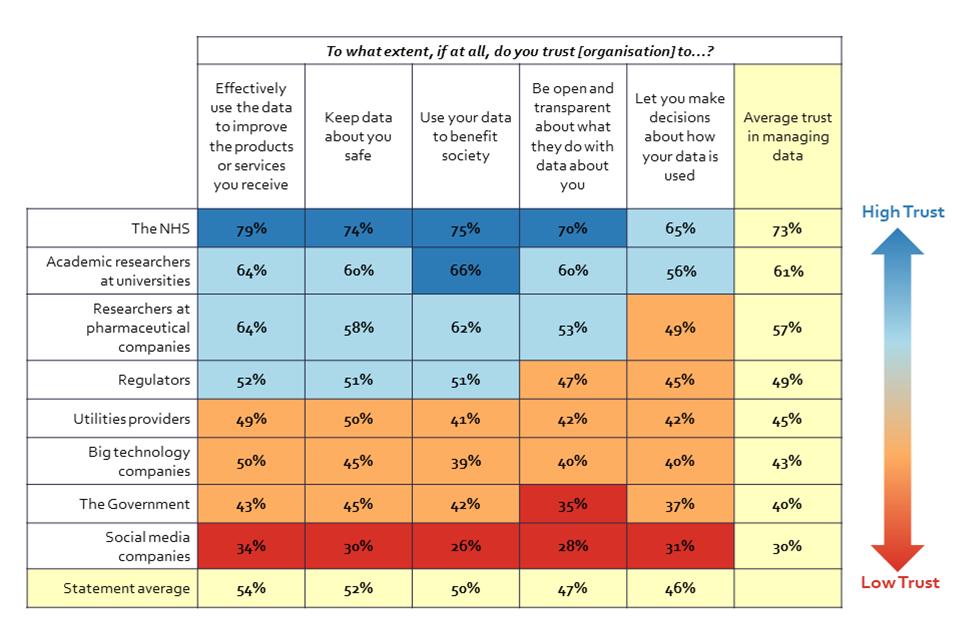
Table showing trust in organisations to take data actions and to act in one’s best interest.
Q14. To what extent, if at all, do you trust the [organisation] to…? BASE: Half of all online respondents per organisation n=2092, Jun/Jul ’22 (Wave 2) n=2676
Some significant changes in overall trust levels have been recorded since the previous survey wave. Firstly, overall trust in the government and utility companies and their data practices has fallen since 2021 (40% to 33%, and 61% to 46% respectively).
Table 2: Trust in selected organisations, and in their actions with data (Showing % Sum: Trust)
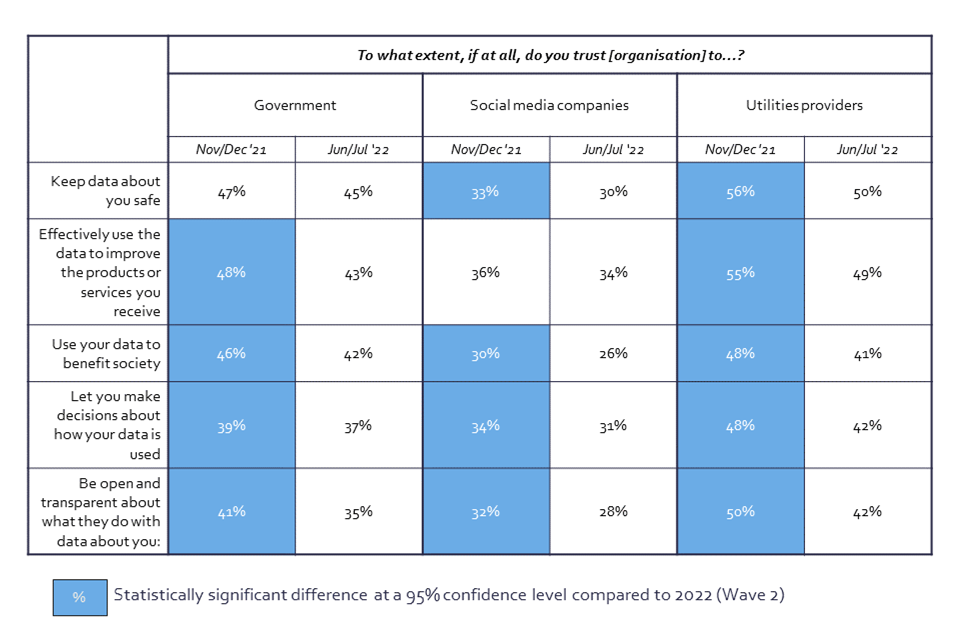
Data table that shows the proportion of respondents that trust the government, Utility Providers, and Social Media Companies to perform six data actions, in November/December 2021 and June/July 2022.
Q14. To what extent, if at all, do you trust the [organisation] to…? BASE: Half of all online respondents per organisation - Nov/Dec ‘21 (Wave 1) n=2092, Jun/Jul ’22 (Wave 2) n=2676
Public trust in government to use data has fallen since 2021 in most dimensions tested in the survey, including ‘use data to improve products or services you use’ (48% to 43%), ‘use your data to benefit society’ (46% to 42%), and ‘let you make decisions about how your data is used’ (39% to 37%). The largest drop has been reported to ‘be open and transparent about data use’ (41% to 35%). The greatest fall in trust in the government across the tested actions is seen among those in a higher socio-economic grade (ABC1: from 47% in 2021 to 41% in 2022), while trust has remained consistent amongst those from socio-economic grades C2DE (41% in 2021 and 39% in 2022). Those from the higher socio-economic grades (ABC1) show a drop from Wave 1 in reported trust in the government to ‘keep data about you safe’ (50% to 46%), ‘use data to improve products or services you use’ (51% to 44%), and ‘use your data to benefit society’ (50% to 43%). The drop in trust amongst those from higher socio-economic grades (ABC1) brings their levels of trust more in line with those from the lower socio-economic grades (C2DE).
Comfort levels with the government’s use of data have also decreased, in line with the reported fall in trust. The proportion of the public who are comfortable providing the government with information about them so that they can deliver public services has dropped from 62% in 2021 to 56% in 2022. In addition, there has been a decrease in the share of UK adults who feel comfortable providing the government with information about them so that this information can inform policies from 56% in 2021 to 50% in 2022.
Chart 5: Level of comfort with providing personal information to selected organisations (Showing % SUM: Comfortable)
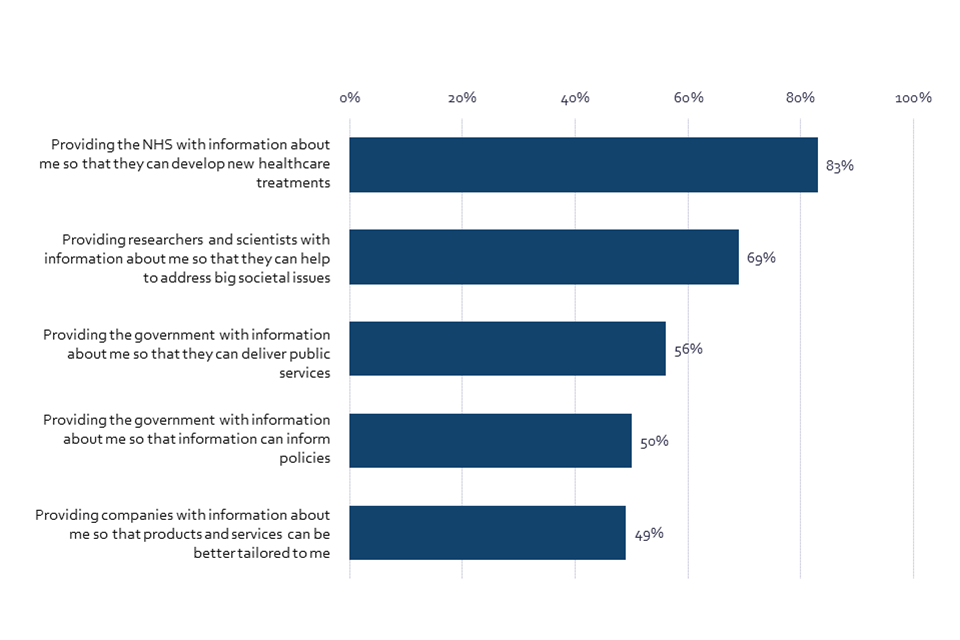
Bar chart showing comfort in providing personal information in various scenarios. Respondents are far more comfortable sharing their information with the NHS than the government.
Q13. Personal data is information that can be used to identify you, for example, your name, address, telephone number, email, or information about you, like your ethnicity, income, or online activity. Please indicate how comfortable or uncomfortable you are with providing personal information about yourself in the following instances? BASE: All online respondents Jun/Jul ’22 (Wave 2) n=4320
Regression analysis indicates that being comfortable with the use of data by government is strongly related to overall trust in government. Those who report that they trust the government to act in their best interests, controlling for other demographic factors, are 3.11 times more likely to say they are comfortable providing data to government to enable the delivery of public services (Chart 6; Annex, Model 5) and 3.37 times more likely to be comfortable providing their information for policy development (Chart 7; Annex, Model 4). Although unsurprising, this demonstrates the strong tie between trust of the government and wider attitudes towards government data use. A wider belief that data is good for society is also strongly associated with being comfortable sharing data for these purposes – those with this view are 2.94 times more likely to be comfortable sharing data for delivering public services and 3.14 times more likely to be comfortable sharing data to inform policies (Chart 6; Annex, Model 5).
Chart 6: Logistic regression model showing predictors of comfort providing data to government to enable the delivery of public services
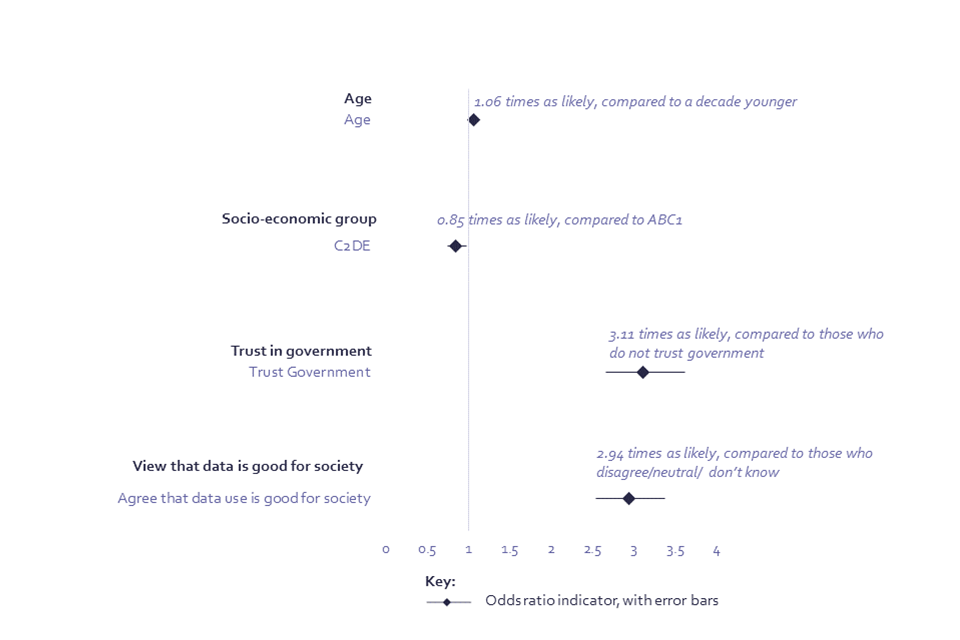
Logistic regression model showing predictors of comfort providing data to government to enable the delivery of public services
Age: The odds ratio[footnote 7] for age is applied by decade, and so, for example, someone is 1.06 times more likely to be comfortable providing data to the government to enable the delivery of public services, compared to someone a decade younger.
Socio-economic group is defined in a footnote in the first chapter of this report.
Q13. Personal data is information that can be used to identify you, for example, your name, address, telephone number, email, or information about you, like your ethnicity, income, or online activity. Please indicate how comfortable or uncomfortable you are with providing personal information about yourself in the following instances? Providing the government with information about me so that they can deliver public services. BASE: All online respondents Jun/Jul ’22 (Wave 2) n=4320
Chart 7: Logistic regression model showing predictors of comfort providing data to government for policy development
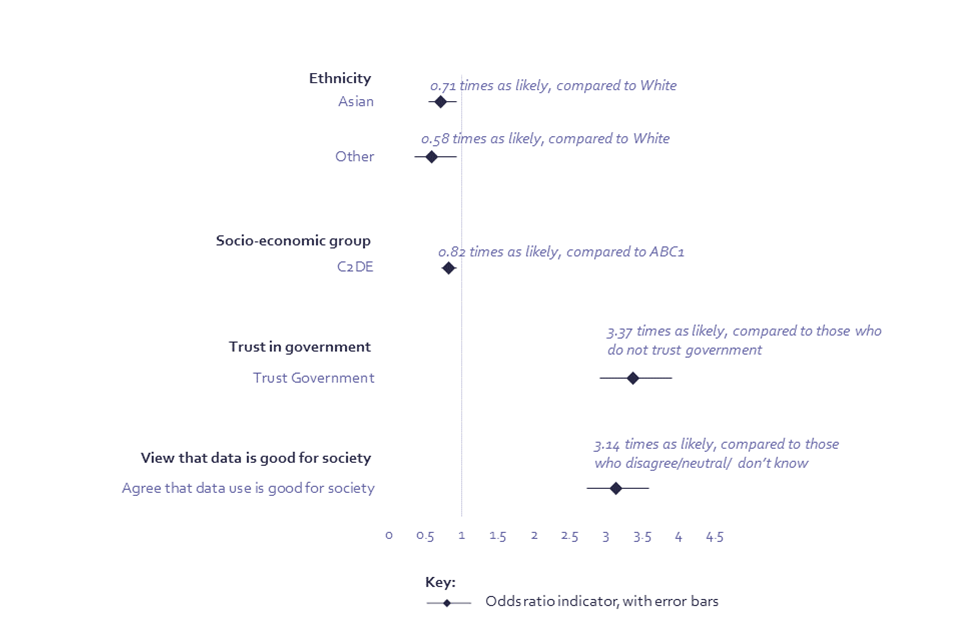
Logistic regression model showing predictors of comfort providing data to government for policy development
Q13. Personal data is information that can be used to identify you, for example, your name, address, telephone number, email, or information about you, like your ethnicity, income, or online activity. Please indicate how comfortable or uncomfortable you are with providing personal information about yourself in the following instances? Providing the government with information about me so that information can inform policies. BASE: All online respondents Jun/Jul ’22 (Wave 2) n=4320
With regards to other actors, the general public’s overall trust in utility providers to act in one’s best interests, and to carry out specific data actions, has fallen since 2021. 46% of UK adults report an overall trust in utility companies, compared to 61% in 2021, and trust has fallen across most demographic groups surveyed.
The UK public also reports lower trust levels in big technology companies (e.g. Amazon, Microsoft) to act in people’s best interest – this share has fallen from 60% in 2021 to 57% in 2022. While this fall is small, it is statistically significant, and what makes it notable is that this fall in trust is larger among people who think technology makes the lives of people like them better - from 66% in 2021 to 60% in 2022 - in other words, the people who think technology makes their lives better are less likely to report trust in these big tech companies. In addition, a similar drop in trust is noted amongst those who claim to have a great or fair amount of knowledge about how the UK technology sector is regulated: 74% in 2021, compared to 68% in 2022. In essence, this decline in overall trust in big technology companies is the largest amongst the most positive and knowledgeable about technology.
Unlike other data actors, trust in the NHS and academic researchers remains high. In 2022, the UK public is most likely to trust the NHS (89%) and academic researchers at universities (78%) to act in their best interests. These levels of trust have remained high since 2021 and have even slightly grown in the case of academic researchers from 76% in 2021 to 78% in 2022. The percentage of UK adults comfortable sharing their data with the NHS to develop new healthcare treatments has increased since Wave 1: 81% in 2021, compared to 83% in 2022. The share of UK adults comfortable sharing data about themselves with researchers and academics so that they can help to address big societal issues has remained consistently high and represents 69% of respondents in both survey waves.
7. Public preferences for data governance
Identifiability, or the ability to identify individuals within shared data, stands out as the most important governance consideration impacting willingness to share data, over transparency about data use and the review process of data sharing. Respondents show a preference for non-identifiable information being shared, even if this means individuals can’t be helped as a result of data sharing.
In order to test people’s preferences for different data sharing governance mechanisms, we used a ‘conjoint experiment’. This is a survey-based research approach for measuring the value that individuals place on different features and considerations for decision making. It works by asking respondents to directly compare different pairs of scenarios that vary by features to determine how they value each feature.
We use a conjoint experiment to test preferences for three attributes of data sharing governance:
- the level of identifiability of the data[footnote 8]
- the type and availability of transparency information[footnote 9]
- the review / accountability process applied to data sharing[footnote 10].
The difference in responses allows us to understand which attributes and features are driving preferences. The experiment tests pairs of data sharing scenarios, asking respondents to select one scenario in which they would be most willing to share their data. Respondents were shown 5 pairs of scenarios each, leading to five selected scenarios in total.
Image 6: Mocked-up example of a scenario presented to the respondent for the conjoint experiment
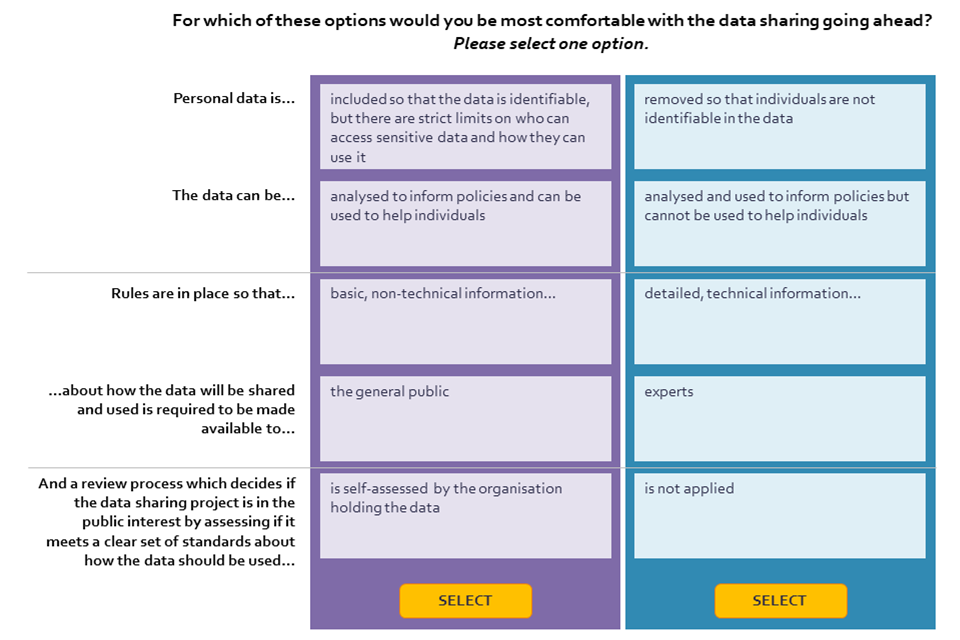
Mocked-up example of a scenario presented to the respondent for the conjoint experiment
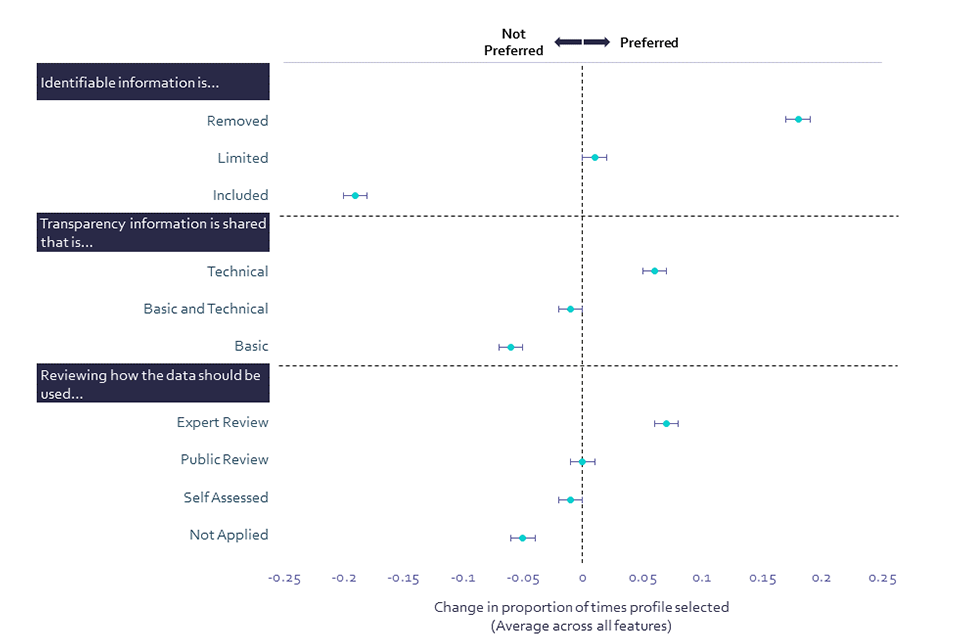
Identifiability (i.e. whether personal data is included in the shared data, which may mean that an individual could be identified from it) stands out as having the biggest impact on willingness to share data, more so than transparency and the inclusion of a review process. Public preference for shared data to exclude identifiable information is expressed, even if this means that the data cannot be analysed in such a way that will help other individuals. This is especially important for older (aged 45+) people and those with a White ethnic background.
In addition, UK adults express a preference for experts to be involved in the review process, over a review by the public, self-assessed review, or no review. This preference runs counter to a prevalent narrative that what people want is to be able to self-manage their privacy, suggesting instead that the public would prefer to delegate consent to others. When it comes to transparency of information about data sharing, people express a preference for technical information to be made available to experts, over technical and basic information made available to experts and the public, and basic, non-technical information made available to the public only. Older people (aged 65+) were more likely to select technical information being made available than their younger counterparts. This finding indicates a public preference for more informed decision-makers to be involved in the review process for how their data is managed.
Chart 8: Public preferences in scenarios affecting willingness to share personal data (Showing % change in proportion of times the option is selected)
Public preferences in scenarios affecting willingness to share personal data
CONJOINTQ. For which of these options would you be most likely to be willing to share your data? Base: All online respondents Jun/Jul ’22 (Wave 2) n=4,257
We also examined differences in preferences between those who, on average, trust selected institutions to perform the data actions tested, and those who do not trust these institutions (see Table 1 for details on the institutions and data actions). While there is consistency in people’s preferences of selected elements across all three dimensions (identifiability, transparency and review) and across both those who trust institutions and those who do not, the conjoint data offer some strong results around identifiability and review.
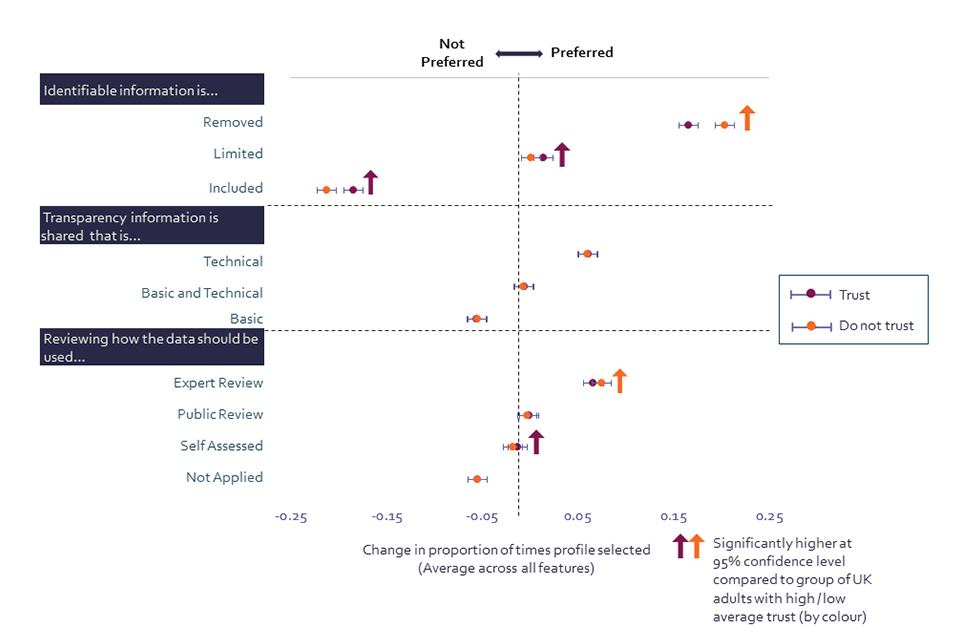
Chart 9: Public preferences in scenarios affecting willingness to share personal data by trust in organisations across all actions with data tested (Showing % change in proportion of times the option is selected)
Public preferences in scenarios affecting willingness to share personal data by trust in organisations across all actions with data tested (Showing % change in proportion of times the option is selected)
CONJOINTQ. For which of these options would you be most likely to be willing to share your data? Base: All online respondents who on average trust all tested organisations across all actions with data (n=2,956); All online respondents who on average do not trust all tested organisations across all actions with data (n=1,353)
Results suggest that UK adults with low trust in institutions (Chart 9) have a strong preference for sharing data with personal data ‘removed so that individuals are not identifiable in the data’. In comparison, adults with high levels of trust (Chart 9) are more likely than those with low trust to express a preference for limited personal data sharing, and for personal data being included in the data shared. This finding indicates that the public’s trust in organisations is directly reflected in their identifiability preferences.
When it comes to review processes, respondents with low levels of trust in institutions (Chart 9) are more likely than those with high trust (Chart 9) to express a preference for experts to be involved in the decision-making process related to shared data. This finding suggests there is a public preference among distrustful adults for informed decision-makers to be involved in review processes. In addition, UK adults with high trust are more likely than those who have low trust to prefer that the organisation holding the data be the one to review how the data should be used.
8. Public preferences for data sharing
Despite general preferences for data to be non-identifiable when shared, there is high public support for access to demographic data to enable systems to be checked for fairness. Governance mechanisms that ensure greater privacy or control over data access would make people feel more comfortable sharing data to check if systems are fair. While links between respondents’ own demographics and their willingness to share certain types of data might be expected, we found no evidence to suggest that respondents’ personal characteristics influenced their willingness to share different types of demographic data.
When algorithms and data are used by both public and private sector organisations to make decisions, this can sometimes lead to unintended unfair outcomes for different groups. To avoid this, we need to test systems for bias, which involves evaluating whether personal information in the input data is affecting the output of the system. Personal information about the affected individuals (e.g. their gender, ethnicity, disability, and sexuality) is therefore needed in order to check if these systems are fair to different groups. Despite strong preferences for non-identifiability in shared data as reported in the previous chapter, most UK adults want systems to be checked for fairness and are comfortable sharing their demographic data to enable this to happen.
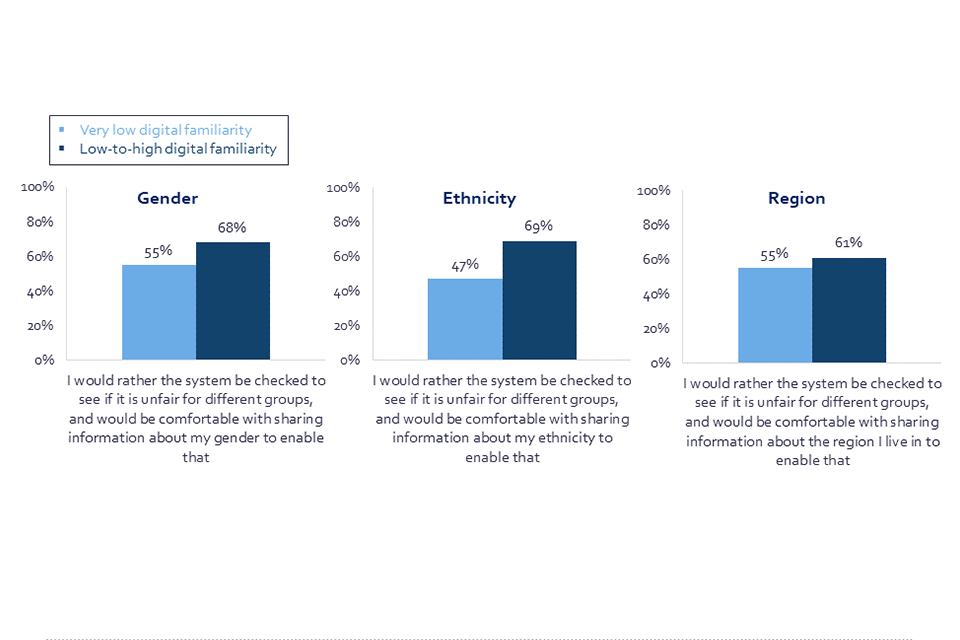
At least three in five UK adults would rather the system be checked to identify whether it is unfair for different groups, and would be comfortable sharing information about their ethnicity (69%), gender (68%), or region they live in (61%) to enable that. On the other hand, a smaller but significant proportion would not feel comfortable providing this data about their ethnicity (21%), gender (21%), or region they live in (25%), even if it means the system cannot be checked to see if it is fair to different groups.
There is a marked difference in the comfort levels of those with very low digital familiarity compared to the wider UK adult population when it comes to sharing personal information in order to see if a system is fair to different groups. Only 55% of those with very low digital familiarity would be happy to share data about their gender (compared to 68% of UK adults), and 55% would share data about their region (compared to 61% of UK adults). Most starkly, only 47% of those with very low digital familiarity would be comfortable sharing their ethnicity (compared to 69% of UK adults). This indicates that those with very low digital familiarity are more protective of ethnicity data, or at least wary about the way institutions might use it.
Chart 10: Comfort sharing demographic data to see if a system is fair to different demographic groups (Showing % comfortable sharing information)
Three column charts showing the proportion of respondents with very low digital familiarity, and the proportion of respondents with low-to-high digital familiarity, comfortable with sharing data about a demographic characteristic.
Q34. Would you rather not provide demographic data, even if it means a system could not be checked to see if it’s unfair to people from different groups, or the system be checked to see if it is unfair for different groups, and would be comfortable with sharing information about demographic data to enable that? BASE[footnote 11]: All online respondents Jun/Jul ’22 (Wave 2), Gender n=1440, Ethnicity n=1438, Region n=1442. All respondents with very low digital familiarity Jun/Jul ‘22 (Wave 2), Gender, n=71, Ethnicity n=69, Region n=60
Regression analysis indicates that, when controlling for other demographic factors, younger respondents and male respondents were less willing to share their demographic data. People of Asian and Mixed ethnicity were also less willing to share demographic data to check if systems are fair. Those living in the North of England, Scotland, and Northern Ireland were significantly more likely to be willing to share this demographic data, compared to those in London (Chart 11; Annex, Model 6).
Chart 11: Logistic regression model showing predictors of willingness to share demographic data to check to see if a system is fair to different demographic groups
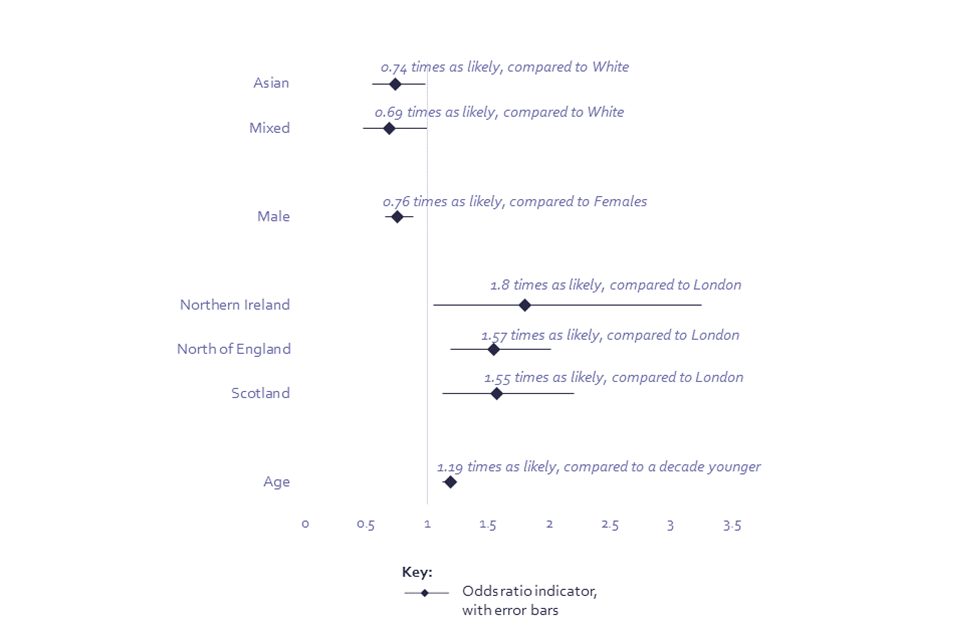
Logistic regression model showing predictors of willingness to share demographic data to check to see if a system is fair to different demographic groups
Age: The odds ratio for age is applied by decade, and so, for example, someone is 1.19 times more likely to be willing to share demographic data to check to see if a system is fair to different demographic groups, compared to someone a decade younger.
Q34. Would you rather not provide demographic data, even if it means a system could not be checked to see if it’s unfair to people from different groups, or the system be checked to see if it is unfair for different groups, and would you be comfortable with sharing information about demographic data to enable that? BASE: All online respondents Jun/Jul ’22 (Wave 2) n=4320[footnote 12]
We might also expect there to be links between respondents’ own demographics and how willing they are to share certain types of data, for example their ethnicity. We tested this hypothesis using interactive effects[footnote 13] on the type of data mentioned in the question and the individual’s demographic characteristics. We found no evidence to suggest that respondents viewed these types of data differently based on their demographics. Rather, there are fairly consistent attitudes across these different data types, potentially highlighting the intersectionality of viewing protected characteristics as sensitive (Annex, Model 7).
The survey also tested whether the presence of additional governance mechanisms which offered greater privacy or control over data impact on an individual’s willingness to share data to check if systems are fair.
Generally, there were high levels of comfort with sharing personal data to check if algorithms are fair, provided governance mechanisms were in place. The option of a dedicated and trusted organisation that ensures personal data about people is stored securely and only shared when privacy protections are in place made the most people comfortable (61%). A similar share of people (57%) said they felt more comfortable with the option of new technologies that allow data to be used without any personal information being given to the organisation.
UK adults were also reasonably likely to feel more comfortable sharing personal data when presented with systems that would give people more control over who accesses their data. These systems include a hypothetical tool that allows individuals to personally assess data sharing requests on a case-by-case basis (60%), and give greater means of review – either by a group of independent experts (54%) or a group of ordinary citizens (40%) (Chart 12).
Chart 12: The impact of certain scenarios on comfort with sharing personal data (Showing % made more comfortable by each scenario)
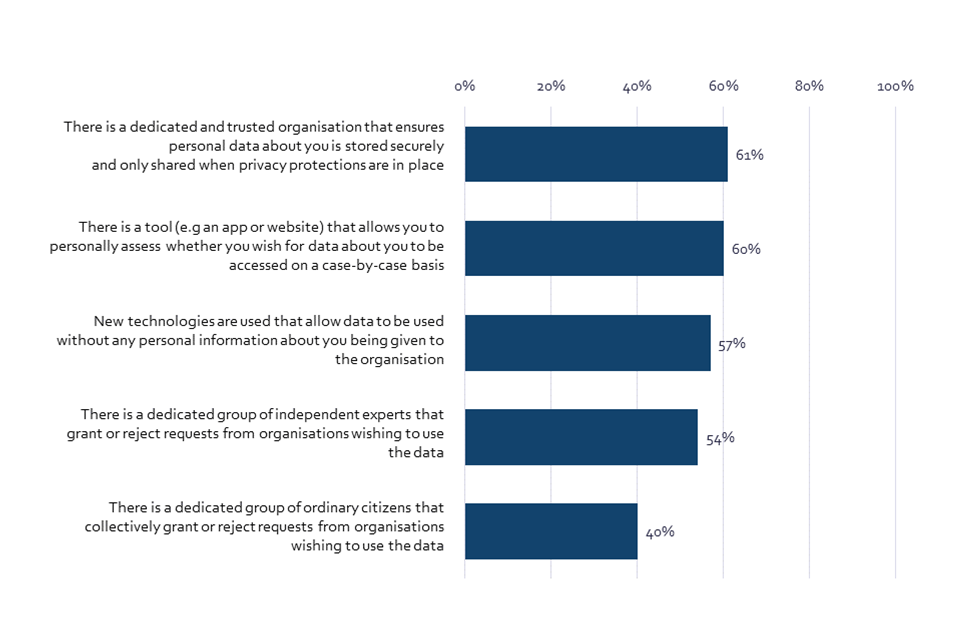
Bar chart showing proportion of respondents made more comfortable with providing personal information by various scenarios.
Q35. Thinking about the different types of personal data that are needed in order to check if the use of algorithms is fair for different groups (e.g. gender, ethnicity, disability, and sexuality), in each of the scenarios would the action make you feel more or less comfortable sharing this data for the purpose of checking if systems are fair. BASE: All online respondents Jun/Jul ’22 (Wave 2) n=4320
Older UK adults (aged 55+) and those with higher socio-economic grade (ABC1) were most likely to report that these mechanisms (see mechanisms in Chart 11 above) would increase their comfort levels. Regression analysis (Annex, Models 8-12) indicates that these groups would feel more comfortable sharing their data, compared to younger respondents and those with lower socio-economic grade (C2DE), if there was:
-
a group of independent experts that grant or reject requests from organisations wishing to use the data,
-
a tool that allows individuals to personally assess whether they wish data about them to be accessed on a case-by-case basis,
-
a dedicated and trusted organisation that ensures personal data is stored securely and only shared when privacy protections are in place,
-
and new technologies that allow data to be used without any personal information being given to the organisation.
Certain groups are also more likely to feel more comfortable sharing their data if a dedicated group of ordinary citizens was in place to review data-sharing requests. Those from a higher socio-economic grade (ABC1), men, and those from Asian and Black ethnic backgrounds are more likely to express comfort in these circumstances, compared to their C2DE, female, and White counterparts (Annex, Model 9). This suggests that some groups are more likely to believe in a democratised voice than expert opinion when it comes to sharing data.
Comfort levels with all of the proposed governance mechanisms are higher amongst those with higher digital familiarity, indicating that those who are less engaged with technology may be harder to reassure.
It is also valuable to identify which governance mechanisms would help those UK adults who are cautious when it comes to sharing their personal data; they represent 23% of the sample. Out of those who would not provide their personal data to check if systems are fair to different groups, 51% would be most comfortable sharing this data when a tool that personally assesses their preference of data usage would be used. This is closely followed by the use of new technologies that allow data to be used without any personal information being given to the organisation (48%) and a dedicated and trusted organisation that ensures personal data about people is stored securely and only shared when privacy protections are in place (46%). This finding suggests that this group of adults has lower levels of trust in involvement of people (experts or citizens) in review processes. Nevertheless, at least half of this group does not feel comfortable with or has no opinion on each of the mechanisms offered, signalling that more would be needed to persuade them to share their personal data.
9. The future of AI and AI governance
People are positive that AI will improve the efficiency of regular tasks, access to healthcare, and saving money on services and goods. However, UK adults are wary of potential negative impacts of AI, for example in producing unfair outcomes or reducing job opportunities. The demand for AI governance is greatest in complex scenarios, with healthcare, policing, the military, and banking and finance seen as the top priorities. The use of AI in healthcare is of high importance as it is also expected to make large changes as a result of digitalisation.
Most (89%) UK adults have heard about Artificial Intelligence (AI) with 46% of respondents saying they are able to give at least a partial explanation of what AI is, compared with 50% in 2021, and only 11% having never heard the term, consistent with 10% in 2021. However, fewer people are aware of AI and feel they could explain what it is in detail; this proportion has slightly declined from 13% in 2021 to 10% in 2022.
The majority of people express moderate or neutral views on their expectations of the impact of AI on society. When asked for their rating on a scale of 0 to 10 where 0 is a very negative impact and 10 is a very positive impact, 58% scored ‘moderate’ (score 4-7). Only 21% gave a negative score (score 0-3), and slightly fewer (16%) gave a positive score (score 8-10).
Older people are more likely to have a negative expectation of the impact of AI on society (24%), compared to 16% of those aged 18-34. Similarly, those from lower socio-economic grades and those with a White ethnic background are also more likely to have this negative expectation: 24% of those from C2DE, compared to 19% of those from ABC1 socio-economic grade, and 21% of those from a White ethnic background, compared to 14% of those from an Asian ethnic background or 17% of those from a Black ethnic background.
Those with a lower digital familiarity are more likely to express scepticism towards AI; 28% of those with low digital familiarity gave a negative rating, compared to 18% of those with a high digital familiarity. Importantly, 48% of those who feel that technology has made life for people like them worse express negative expectations for the impact of AI (score 0-3), compared to only 14% of those who feel that technology has made life better.
Chart 13: Expectations of the positive impact of AI on society (Showing % to score 8-10, where 0=very negative and 10=very positive)
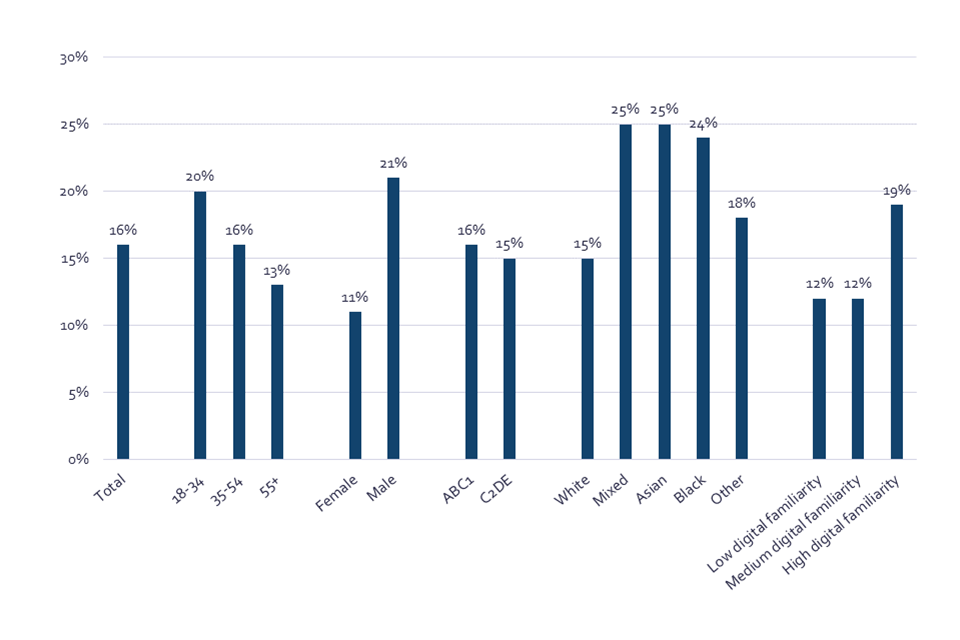
Bar chart showing proportion of different demographic groups that give a positive score (8-10) on their expectations of AI’s impact on society.
Q23b. On a scale from 0-10 where 0=very negative impact and 10=very positive impact, based on your current knowledge and understanding, what impact do you think Artificial Intelligence (AI) will have overall on society? BASE: All online respondents Jun/Jul ’22 (Wave 2) n=4320
While most UK adults express moderate views about the future of AI, some latent anxieties are present. When asked to describe their feelings about the future of AI, the dominant responses are those of caution, confusion, worry, and concern. That said, many also express ambivalence or a lack of knowledge, at least partly explaining the high proportion of neutral scores given about the expected impact of AI. A sense of excitement and potential value also comes through, although they are currently dominated by more fearful sentiments.
Image 7: Word cloud of public sentiment towards AI – by UK adults (CAWI)

Word cloud of public sentiment towards AI – by UK adults
Q22. Please type in one word that best represents how you feel about ‘Artificial Intelligence’. Base: All online respondents to say they have heard of AI Jun/Jul ’22 (Wave 2) n=3838
Those with high digital familiarity express a broad range of emotions about AI, from excitement to fear. Some also express strong expectations for both positive and negative potential impacts of AI on society, and for the governance of AI to protect people from potential harms.
Conversely, those with very low digital familiarity largely report a lack of knowledge and general confusion about AI. 28% of this group feel they could give at least a partial explanation of what AI is[footnote 14], compared with 56% of the wider adult population. Similarly, open-text responses amongst those who have heard of AI reflect low confidence in their knowledge and understanding of AI, and are generally far less engaged.
While most of the public express a moderate or neutral expectation for AI (58% score of 4-7), the 16% who express positive views (score 8-10) mention excitement and fascination with a futuristic vision for what AI might offer society - although they do express some cautiousness too. Amongst the 21% who express negative views about AI (score 0-3), open-text responses are much more nervous and in some cases even fearful about the prospects of AI for our society.
Image 8: Word clouds of public sentiment towards AI – by sentiment towards AI
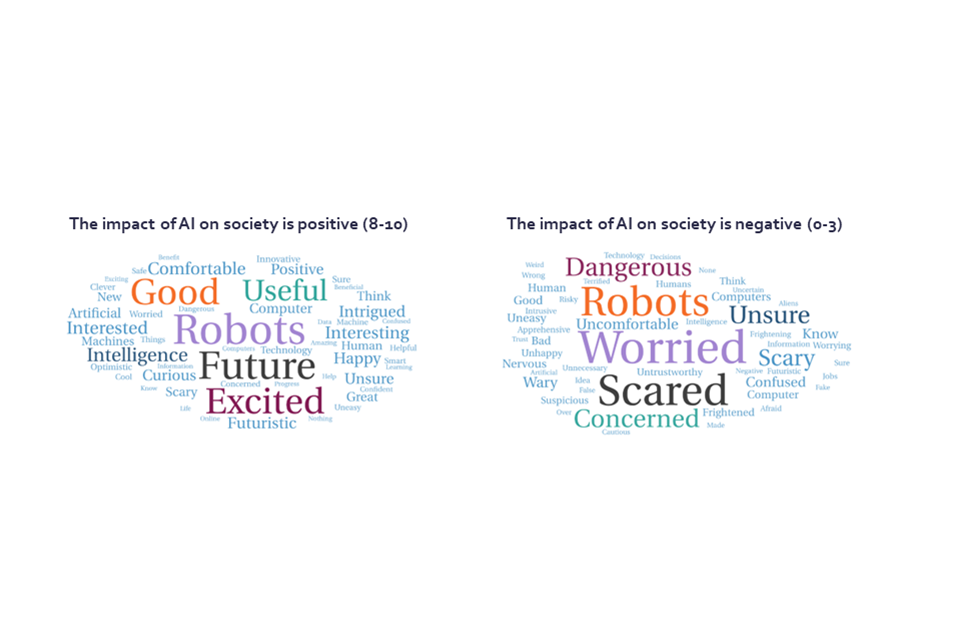
Word clouds of public sentiment towards AI – by sentiment towards AI
Q22. Please type in one word that best represents how you feel about ‘Artificial Intelligence’. Base: All online respondents who say they have heard of AI Jun/Jul ’22 (Wave 2), who say the impact of AI on society is positive (selected 8-10 on a 0-10 scale) n=638, or the impact of AI on society is negative (selected 0-3 on a 0-10 scale) n=786. Size of words corresponds to the number of times they occur in responses. All words mentioned three times and less are removed.
Open-text responses sorted by age group reflect the different expectations for AI, with slightly higher optimism and excitement expressed by younger respondents, while older respondents are more hesitant.
Image 9: Word clouds of public sentiment towards AI – by age
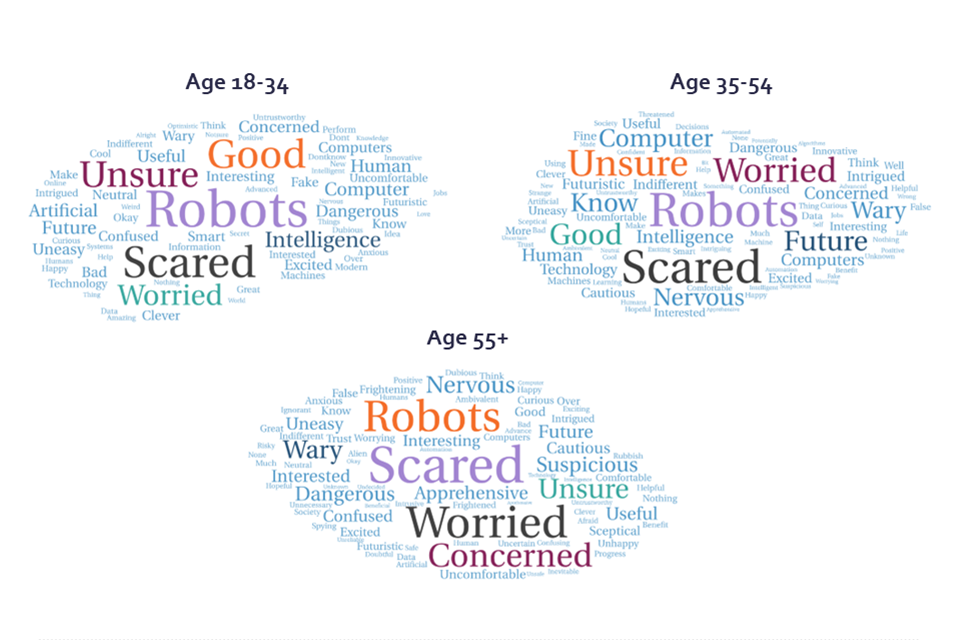
Word clouds of public sentiment towards AI – by age
Q22. Please type in one word that best represents how you feel about ‘Artificial Intelligence’. Base: All online respondents who say they have heard of AI Jun/Jul ’22 (Wave 2), and who are aged 18-34 n=936, or 35-54 n=1306, or 55+ n=1575. Size of words corresponds to the number of times they occur in responses. All words mentioned three times and less are removed.
While some concerns about the future of AI are expressed, these fears are dramatically lower, compared to other societal issues. When asked about the most important issues facing the country only 2% of UK adults focus on how data and Artificial Intelligence (AI) is used in society, compared to other concerns such as the economy (57%), health (28%), and climate change (23%).
Regression analysis indicates that younger people, those from an Asian ethnic background (compared to those from a White ethnic background), and males, are more likely to have a positive view about the impact of AI on job opportunities. Interestingly, views were not found to be statistically significant between those of different social grades despite some jobs being more at risk from automation than others (Annex, Model 7).
Next, we looked at the impact people expect AI to have across four outcomes concerning fairness, the ease and cost of day-to-day tasks and services, job opportunities, and healthcare. Most UK adults expect that AI will have a positive impact on peoples’ everyday lives, improving the easiness of day-to-day tasks (59%), the quality of healthcare (57%), and their ability to save money on services and goods (48%). However, when it comes to both job opportunities and fairness, there are less positive expectations. A similar proportion of people believe that AI will have a positive impact on job opportunities for people like them as they believe it will have a negative impact: 33% positive, compared to 34% negative. The same pattern is seen in expectations for AI’s impact on how fairly people are treated in society: 29% positive, compared to 28% negative.
Chart 14: Belief that AI will have a positive impact on selected types of situations (Showing % SUM: Positive)
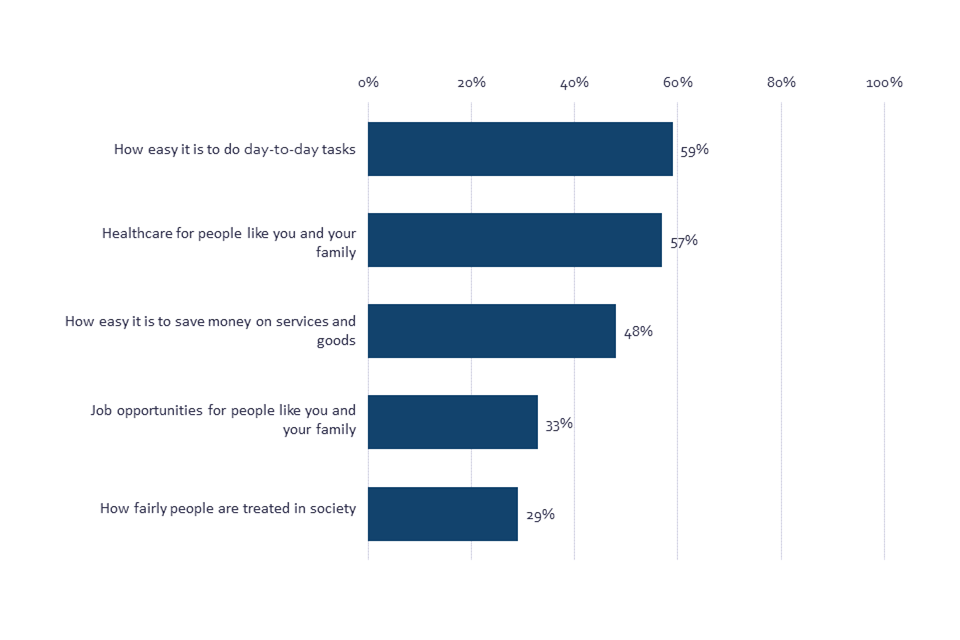
Bar chart showing perceived positive impact of artificial intelligence on situations. Respondents see AI as mainly providing day-to-day and healthcare benefits.
Q25b. To what extent do you think the use of Artificial Intelligence will have a positive or negative impact for the following types of situations? BASE: All online respondents Jun/Jul ’22 (Wave 2) n=4320
Regression analysis was used to identify the demographic and attitudinal dimensions that predict people’s expectations about AI’s impact. Demographic factors were considered in addition to respondents’ reported ability to be able to explain AI (comparing those who could offer at least a partial explanation of AI to those that could not) and overall belief that collecting and analysing data is good for society (comparing those that agreed with this statement to those that did not). This awareness of AI and attitude about data use were found to be strongly linked to people’s expectations about AI outcomes (Annex, Models 14-18).
Unsurprisingly, those who were optimistic about data being good for society were also more likely to believe that AI would lead to positive outcomes across all tested situations (see tested situations in Chart 14 above) (Annex, Models 4-8). Similarly, those that reported they would be able to give at least a partial explanation of AI were more likely to believe it would lead to positive outcomes (Annex, Models 15, 16 & 18). Generally, this implies that those with greater understanding about AI and recognition of the wider benefits of data are more likely to believe AI will lead to positive outcomes, whether that is through the ease of day-to-day tasks, saving money on goods and services, or access to healthcare.
Two exceptions to this are how fairly people are treated in society (Annex, Model 14) and the availability of job opportunities (Annex, Model 17). Those who can offer at least a partial explanation of AI, controlling for other characteristics, are less likely to believe these outcomes will be positive. Therefore, while these groups might be aware of the convenience and innovation benefits of AI they are also wary of the wider societal impacts AI could have.
In terms of demographic differences, the impact of AI on healthcare is a rare case where no demographic differences other than age are found to be statistically significant, and older age ranges are found to be slightly more likely to believe the impacts of AI will be positive (Annex, Model 8).
Across the other outcomes, younger respondents are generally more likely to believe in the positive benefits of AI for how fairly people are treated in society and the availability of job opportunities (Annex, Models 14 & 17). Those of Asian ethnicity, compared to those of White ethnicity were found to be more likely to believe the impacts of AI will be positive across all outcomes, with the exception of healthcare (Annex, Models 14 - 17). Those from lower social grade (C2DE), compared to those of higher social class (ABC1) were less likely to believe in positive AI outcomes of how easy it is to do day-to-day tasks, and save money on goods and services (Annex, Models 15 & 16), potentially reflecting a belief that AI services will not be felt evenly across society. Males were more likely than females to believe AI would lead to positive outcomes on fairness and job opportunities.
Looking at the desired level of governance for AI alongside those areas most expected to change due to the impact of AI enables us to identify the top priorities for AI governance. UK adults most want governance of AI within policing (31%), healthcare (31%), military (26%), social care (23%), banking and finance (22%), and the courts (20%). The highest expectations of change due to AI are within healthcare (38%), autonomous vehicles (29%), banking and finance (24%), employment (23%), the military (22%), and policing (16%). Healthcare, policing, the military, and banking and finance are therefore the four areas that emerge as top governance priorities for the UK public.
Chart 15: Importance of AI governance and expected change due to AI (Top 3) (Axes split along median value)
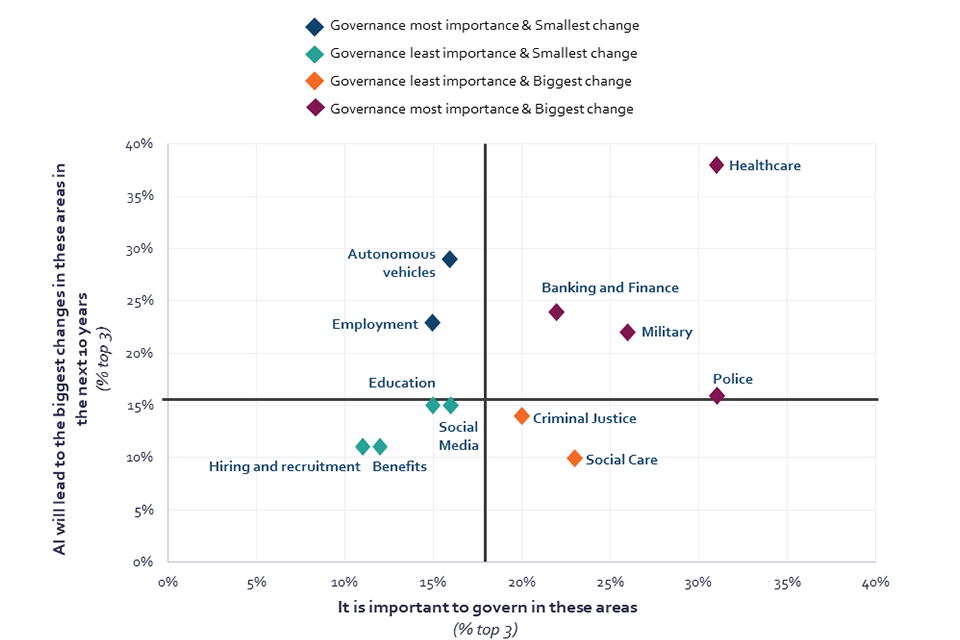
Scatter plot showing importance of artificial intelligence governance and expected change due to AI in various areas. Healthcare clearly emerges as an area that is expected to change and require governance.
Q32. Which of the following areas do you think is important that governments carefully manage to make sure the use of AI does not lead to negative outcomes for users? Q33. In which of the following areas, if any, do you think the use of AI will lead to the biggest changes in society over the next 10 years? BASE: All online respondents Jun/Jul ’22 (Wave 2) n=4320
10. Attitudes of those with very low digital familiarity
Those with very low digital familiarity (the CATI sample) are less likely than the wider UK adult population to feel they personally benefit from technology. However, they are reasonably open to sharing data to benefit society, and the majority consider collecting and analysing data to be good for society.
We define people as having very low digital familiarity if they either agreed with three out of the five statements below, or said that they did not perform the activities in question.
-
I don’t tend to use email
-
I don’t feel comfortable doing tasks such as online banking
-
I feel more comfortable shopping in person than online
-
I find using online devices such as smartphones difficult
-
I usually get help from family and friends when it comes to using the internet
Further information regarding the design of the CATI sample can be found in the Methodology section.
Interviews with those with very low digital familiarity (using a Computer Assisted Telephone Interview – CATI) enable us to ensure that the attitudes and experiences across the full spectrum of digital engagement are captured by this public perceptions tracker. This group has low confidence in the level of knowledge and control they have over their personal data. 34% claim they know nothing at all about how data is used and collected in their everyday lives, compared to 10% of those in the wider UK adult online sample. 43% say that they know just a little about how their data is used and collected about them, and 17% know a great or fair amount. Those with very low digital familiarity also lack confidence in the level of control they have over their data; only 19% agree that they have control over who uses their data and how, compared to 29% of the UK adult sample.
Those with very low digital familiarity are less likely to feel that they benefit personally from technology, compared to the wider UK adult population. 44% of those with very low digital familiarity agree that data is useful for creating products and services that benefit them personally, compared with 53% of the wider UK adult sample. However, respondents with very low digital familiarity are more optimistic than the wider UK adult sample that all groups in society equally benefit from data usage; 33% agree all groups benefit equally, compared to 26% of the wider adult population.
In addition, this group expresses comfort with sharing their personal data for public good. 57% of those with very low digital familiarity believe collecting and analysing data is good for society, whereas amongst the wider UK adult sample, 39% believe the same.
When it comes to attitudes towards different organisations, trust in the government as a data actor is lower amongst those with very low digital familiarity, compared with the wider UK adult population. 27% of those with very low digital familiarity trust the government to keep their data safe, compared to 45% of the general adult sample, and 26% trust the government to use their data effectively, as opposed to 43% of the adult sample who say so. In addition, only 17% trust the government to be open and transparent about how they use this data, compared to 35% of the UK adult sample.
When asked about trust in academic researchers, regulators, and utility providers to keep their data safe, to be transparent and to effectively improve services, levels of trust are lower for those with very low digital familiarity, compared with the majority UK adult population.
When asked about their trust in data practices of other organisations, those with low digital familiarity have lower levels of trust, especially amongst social media and big technology companies. 7% of those with very low digital familiarity trust social media companies to keep data about them safe, compared to 30% UK adults who say so, and 6% trust them to be open and transparent about what they do with the data, compared to 28% of the general UK adult sample who trust them to do the same. Only 14% of those with very low digital familiarity trust big technology companies to keep their data safe, as opposed to 45% of UK adults who do the same. Only 17% trust there will be transparency in the data they use, compared to 40% of the wider UK adult population.
11. Methodology
The Centre for Data Ethics and Innovation (CDEI)’s Public Attitudes to Data and AI Tracker Survey monitors public attitudes towards data and AI over time. This report summarises the second wave (Wave 2) of research and makes comparisons with the first wave (Wave 1).
The research uses a mixed-mode data collection approach comprising online interviews (Computer Assisted Web Interviews - CAWI) and a smaller telephone survey (Computer Assisted Telephone Interviews - CATI) to ensure that those low or no digital skills are represented in the data.
The Wave 1 online survey (CAWI) ran amongst UK the general adult population (18+) adults from 29th November 2021 to 20th December 2021 with a total of 4250 interviews collected in that time frame. A further 200 telephone interviews (CATI) with the ‘very low digital familiarity’ sample were conducted between 15th December 2021 and 14th January 2022.
For Wave 2, Savanta completed a total of 4320 online Interviews (CAWI) across a demographically representative sample of UK adults (18+). This survey ran from 27th June 2022 to 18th July 2022. A further 200 UK adults were interviewed via telephone (CATI) between 1st and 20th July 2022.
With thanks to Better Statistics and the Office for Statistical Regulation for their ongoing support and advice with the methodological approach for this survey. We welcome any further feedback or questions on our approach at public-attitudes@cdei.gov.uk.
11.1 Sampling and Weighting
Representative Online (CAWI) Sample
Quotas have been applied to the online sample to ensure that it is representative of the UK adult population, based on age, gender, socio-economic grade, ethnicity, and region. In addition, interlocked quotas on age and ethnicity, and age and social grade were used during fieldwork to monitor the spread of age across these two categories and ensure a balanced final sample. The online sample was provided by Cint. All the contact data provided is EU General Data Protection Regulation (GDPR) compliant.
The online sample was weighted based on official statistics concerning age, gender, ethnicity, region, and socio-economic grade[footnote 15] in the UK to correct any imbalances between the survey sample and the population to ensure it is nationally representative. Random Iterative Method (RIM) weighting was used for this study, such that the final weighted sample matches the actual population profile.
The most up to date ONS UK population estimates have been used for both the fieldwork quotas and weighting scheme to ensure a nationally representative sample, using 2020 mid-year estimates for age, gender, and region, and the 2011 Census data for socio-economic groups (SEG) and ethnicity.
The online sample weighting used in Wave 2 is the same as Wave 1. Comparisons can therefore be drawn across both waves.
Very low digital familiarity (CATI) Sample
200 respondents with very low digital familiarity were contacted and interviewed via telephone survey (CATI). The named sample list of respondents’ contact details was provided by Datascope. All the contact data provided is GDPR compliant.
This telephone sample captures the views of those who have low to no digital skills and are, therefore, likely to be excluded from online surveys (CAWI). They are likely to be affected by digital issues in different ways to other groups. As the answers respondents give to questions may be impacted by how the question was delivered (e.g. by whether they saw it on a screen, or had it read to them over the phone), any comparisons drawn between the CATI and CAWI samples should be treated with caution.
In order to select those with very low digital familiarity, we asked the below screening question in the Wave 2 telephone survey questionnaire. Respondents needed to agree to the statements or say they do not do the activities for three out of the five statements asked in order to qualify for the telephone interview.
Statements
-
I don’t tend to use email
-
I don’t feel comfortable doing tasks such as online banking
-
I feel more comfortable shopping in person than online
-
I find using online devices such as smartphones difficult
-
I usually get help from family and friends when it comes to using the internet
The sample of those with very low digital familiarity was set fieldwork quotas and weighted to be representative of the digitally excluded population captured in FCA Financial Lives 2020 survey. The FCA Financial Lives 2020 survey was chosen as the basis to weight data rather than other similar datasets, including ONS Data and Lloyds Digital Skills 2021 report, as the FCA Financial Lives survey includes ethnicity breakdowns in data tables. We are aware that this group is slightly skewed towards ethnic minority (excluding White minority) adults, hence, the inclusion of ethnicity breakdown was of great importance.
The quotas used were set on broader bands within key categories of gender, age, ethnicity, employment, UK nations, and regions of England. Random Iterative Method (RIM) weighting was used for this study, such that the final weighted sample matches the actual population profile. Those respondents who prefer not to answer questions on age and ethnicity are weighted to 1.0, and those who do not identify as male or female are also weighted to 1.0.
This weighting of the very low digital familiarity (CATI) sample was used in Wave 2 for the first time, Wave 1 data have not been weighted. Data from both waves should, therefore, not be compared.
Demographic Profile of the Online (CAWI) sample & very low digital familiarity (CATI) sample
The demographic profile of the online and very low digital familiarity (CATI) samples, before and after the weights have been applied, are provided in the table below.
| Online (CAWI) sample | Online (CAWI) sample | Online (CAWI) sample | Online (CAWI) sample | Very low digital familiarity (CATI) sample | Very low digital familiarity (CATI) sample | Very low digital familiarity (CATI) sample | Very low digital familiarity (CATI) sample | |
| Unweighted - Sample Size | Unweighted - Total Sample (%) | Weighted - Sample Size | Weighted - Total Sample (%) | Unweighted - Sample Size | Unweighted - Total Sample (%) | Weighted - Sample Size | Weighted - Total Sample (%) | |
| Gender | ||||||||
|---|---|---|---|---|---|---|---|---|
| Female | 2236 | 52% | 2194 | 51% | 121 | 61% | 117 | 59% |
| Male | 2058 | 48% | 2100 | 49% | 77 | 39% | 81 | 40% |
| Identify in another way | 16 | 0% | 16 | 0% | - | - | - | - |
| Prefer not to say | 10 | 0% | 10 | 0% | 2 | 1% | 2 | 1% |
| Age | ||||||||
| NET: 18-34 | 1139 | 26% | 1193 | 28% | 4 | 2% | 12 | 6% |
| NET: 35-54 | 1459 | 34% | 1422 | 33% | 12 | 6% | 17 | 9% |
| NET: 55+ | 1722 | 40% | 1704 | 39% | 181 | 91% | 168 | 84% |
| Social Grade | ||||||||
| ABC1 | 2494 | 58% | 2392 | 55% | - | - | - | - |
| C2DE | 1826 | 42% | 1928 | 45% | - | - | - | - |
| Region | ||||||||
| Northern Ireland | 107 | 2% | 119 | 3% | 22 | 11% | 12 | 6% |
| Scotland | 389 | 9% | 362 | 8% | 29 | 15% | 22 | 11% |
| North-West | 454 | 11% | 472 | 11% | 24 | 12% | 15 | 7% |
| North-East | 179 | 4% | 174 | 4% | 7 | 4% | 4 | 2% |
| Yorkshire & Humberside | 358 | 8% | 356 | 8% | 26 | 13% | 25 | 12% |
| Wales | 220 | 5% | 207 | 5% | 19 | 10% | 8 | 4% |
| West Midlands | 377 | 9% | 379 | 9% | 17 | 9% | 19 | 9% |
| East Midlands | 326 | 8% | 318 | 7% | 10 | 5% | 12 | 6% |
| South-West | 372 | 9% | 371 | 9% | 20 | 10% | 38 | 19% |
| South-East | 601 | 14% | 590 | 14% | 13 | 7% | 24 | 12% |
| Eastern | 398 | 9% | 402 | 9% | 9 | 5% | 12 | 6% |
| London | 539 | 12 | 569 | 13% | 4 | 2% | 11 | 5% |
| NET England | 3604 | 83% | 3632 | 84% | 130 | 65% | 159 | 79% |
| Ethnicity | ||||||||
| NET: White | 3651 | 85% | 3834 | 89% | 180 | 90% | 166 | 83% |
| NET: Mixed | 150 | 3% | 58 | 1% | 1 | 1% | 1 | 1% |
| NET: Asian | 276 | 6% | 274 | 6% | 13 | 7% | 24 | 12% |
| NET: Black | 157 | 4% | 116 | 3% | 3 | 2% | 5 | 2% |
| NET: Other | 86 | 2% | 39 | 3% | 2 | 1% | 3 | 1% |
| NET: Ethnic minority (excl. White minority) | 669 | 15% | 487 | 11% | 19 | 10% | 33 | 16% |
Wave on wave comparability
The same questions were asked in Waves 1 and 2 of the tracker survey in order to enable comparison between the two time points. For Wave 2 we have replaced some questions from Wave 1 and added or removed some cases-studies and examples from other questions. In future waves we will rotate different items and questions into the survey at different intervals as six-monthly data points are not required for all. Additionally, the question wording has been updated in some instances which are clearly marked in data tables with variable names marked ‘b’.
The following notable edits were applied to CAWI and CATI survey questionnaires in Wave 2:
-
Digital behaviours and use of digital service questions have been reduced.
-
New questions on AI and data governance have been added for Wave 2.
-
Q1 and Q14: New additions in Wave 2 include ‘Regulators’ and ‘Researchers as pharmaceutical companies’. The following actors have been excluded from the survey in Wave 2: ‘Banks’, ‘The Police’, ‘Your local council’, and ‘Local independent businesses (e.g. pubs, hairdressers)’.
-
CAWI Conjoint: Change of conjoint design and content between Wave 1 and Wave 2.
-
CATI DIGITALSKILLS (Screening question): List of statements has changed. New additions in Wave 2 include ‘I don’t feel comfortable doing tasks such as online banking’, ‘I feel more comfortable shopping in person than online’, and ‘I find using online devices such as smartphones difficult’. The following statements have been excluded from the survey: ‘I browse the internet but don’t feel comfortable doing tasks such as online banking’, ‘I can do online banking but feel more confident doing this face to face’, and ‘I am wary of entering my personal details into online websites’.
-
CATI Q1: Question wording has changed slightly since Wave 1. ‘To what extent, if at all, do you trust’ has been replaced with ‘Do you trust or distrust’ in Wave 2. Reduction of scale from five options to three options.
-
CATI Q14: Question wording has changed slightly since Wave 1. ‘To what extent, if at all, do you trust’ has been replaced with ‘Do you trust or distrust’ in Wave 2.
11.2 Analysis
The data from the CAWI survey has been analysed using a combination of descriptive, conjoint and regression analysis. The CATI data has been analysed using descriptive analysis only, due to its relatively smaller sample size (the conjoint module was not included in the CATI survey).
Statistical significance and interpretation
When interpreting the figures in this report, please note that only statistically significant differences (at a 95% confidence level) are reported and that the effect of weighting is taken into account when significance tests are conducted. Significant differences are highlighted in the analytical report and are relative to other directly relevant subgroups (e.g. those identifying as male vs those identifying as female). Where the term ‘significant’ is used throughout this report, statistical significance is meant.
Digital familiarity score
A proxy score for digital familiarity has been used to break up respondents into three groups, using a score based on self-reported levels of confidence in using technology, and frequency of use of four digital services. The scores have been assigned as follows:
-
Q4b: Respondents are given a score of 3 for each digital service used ‘a lot’, score of 1.5 for used ‘occasionally’, 0 for ‘don’t do at all’, with a maximum of 12 points on this question
-
Q5: Respondents are given points for every answer; ‘very confident’ = 12 points, ‘somewhat confident’ = 8, ‘not confident’ = 4, ‘not at all confident’ = 0, any other response = 0.
-
The total maximum score one can have from Q4b and Q5 combined is 24.
The distribution of scores was then analysed using Jenks method to identify logical divisions between the groups:
-
Low digital familiarity: 0-12.5 (394 respondents)
-
Medium digital familiarity: 13-19 (1566 respondents)
-
High digital familiarity: 19.5-24 (2360 respondents)
The CATI survey data has been treated as an extension to this means of dividing the data, providing a ‘very low digital familiarity’ group.
Conjoint Analysis
Conjoint analysis is a survey-based research approach for measuring the value that individuals place on different features and considerations for decision making. It works by asking respondents to directly compare different combinations of features to determine how they value each one.
A conjoint experiment was created to test preferences for three attributes within two data sharing situations (data shared within government and data shared between government and private companies) those attributes were:
-
the level of identifiability of the data
-
the type and availability of transparency information
-
the review process applied to data sharing
The difference in responses allows the researcher to understand which attributes and items are driving preference.
The sample was split evenly between the two situations of data sharing to see if this impacted preferences for governance. Firstly we tested a scenario involving data sharing within government, and secondly, a scenario involving data sharing between the government and private sector companies. Each situation was presented with a conjoint experiment with the same design parameters to ensure comparability. The experiment tested pairs of data sharing scenarios (where the items within attributes varied) asking respondents to select in which scenario they would be most willing to share their data. Respondents were asked 5 pairs of scenarios; each scenario being allocated based on achieving as even a distribution of combinations as possible across the sample. Each pair could contain some identical characteristics, but the pairs as a whole could not be identical. Even with this methodology not all combinations can feasibly be shown though, this problem is addressed in the analysis phase of the work.
A visual example of the conjoint experiment setting (comparing two data sharing scenarios out of five pairs in total) in the online survey is as follows:
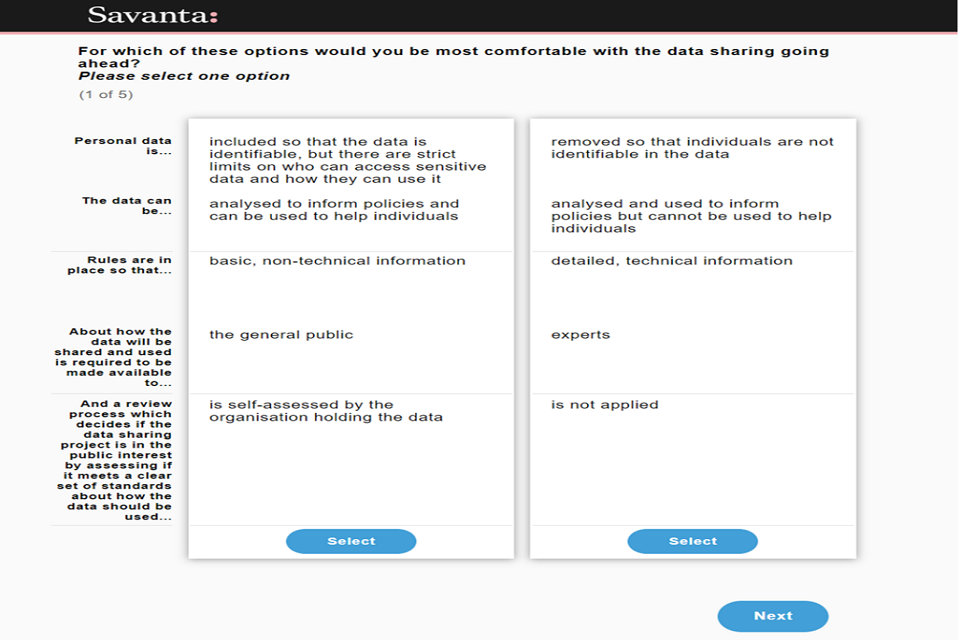
A visual example of the conjoint experiment setting (comparing two data sharing scenarios out of five pairs in total) in the online survey
The data captured was analysed in Sawtooth using a combination of logistic regression and a hierarchical Bayesian (HB) algorithm. An individual respondent’s data was regressed to create utility scores; these scores can be considered to be the appeal of an attribute within the data sharing scenarios. These utility scores were then used to determine the likelihood of a respondent selecting an attribute or combination of attributes (the propositions displayed in the exercise).
The HB algorithm analysed an individual respondent’s utilities for the data sharing scenarios they were shown, compared them to the sample average and then estimated their likely choices for scenarios not shown based on their variation from the sample average.
The utility scores were transformed to show the likelihood that a data sharing scenario was selected, with a probability of 50% being the base probability, 100% being chosen every time, and 0% being never selected.
For further reading on HB analysis please refer to the Sawtooth website.
Regression analysis
Regression analysis is used to test associations between different characteristics and responses, for example, to test for associations between demographic characteristics and attitudes toward data. This technique can identify the size and strength of these relationships, while holding all other variables in the model equal, but not cause and effect.
Logistic regression is used to test for associations between a single ‘dependent’ variable and multiple ‘independent’ variables. Logistic regression is used as many of the ‘dependent’ variables in this report are survey questions based on likert scales and not continuous data. Therefore, the data is transformed into two categories, for example ‘agreeing’ with a statement inclusive of ‘strongly agree’ and ‘somewhat agree’, and ‘not agreeing’ with the statement inclusive of all other responses.
Logistic regression provides us with an ‘odds ratio’. This tells us the odds of someone with a particular characteristic or attitude reporting, for example, that they agree with a statement, compared with someone with another characteristic or attitude, after taking other possible influences into account. For example, regression analysis ran for Wave 2 of this tracker survey showed that males were 1.45 times more likely to think AI will have a positive impact on how fairly people are treated in society, compared to females (Annex, Model 14).
A goodness of fit measure, Akaike Information Criterion (AIC), is reported with all models. This can be used to compare models with the same dependent variable and understand which one is the best fit for the data where a smaller AIC indicates a better fit. AIC penalises models for including more variables, therefore, variables that are not found to be statistically significant are removed from the final models iteratively.
We tested selected hypotheses using interactive effects on the type of data mentioned in the question and the individual’s demographic characteristics. Interaction effects occur in complex study areas when an independent variable interacts with another independent variable and its relationship with a dependent variable changes as a result. This effect on the dependent variable is non-additive, i.e. the joint effect of two variables interacting is significantly greater or significantly less than the sum of the parts. It is important to understand whether this effect occurs because it tells us how two or more independent variables work together to impact the dependent variable, and ensure our interpretation of data is correct. The presence or absence of interactions among independent variables can be revealed with an interaction plot and interaction term effect can be included in an analytic model in order to quantify its significance. When we have statistically significant interaction effects, we have to interpret the main effects considering the interactions.
Media monitoring methodology
Media stories across the key themes of data policy, data breaches, health data, AI, and facial recognition technology were collected between 1st January 2022 - 31st June 2022 from the online sites of major British and international news providers using the media monitoring tool Brandwatch. These topics were identified as key themes in the free text media question asking about recent ‘data stories’ in both Wave 2 and Wave 1 of the Tracker Survey. New stories were collected based on the inclusion of keywords related to these topics within the title. Top stories were selected as those with multiple articles about them or that appeared on the news sites with highest readership. Where stories are reported by large numbers of news outlets they are included as clusters of headlines to demonstrate the different reporting on the topic, for example, the ‘LaMDA and AI sentience’ cluster while those with fewer similar stories are represented by a singular headline.
12. Annex: Regression models
12.1 Overall attitudes to data
Model 1: Data is useful for creating products and services that benefit me
| Characteristic | Odds Ratio | 95% Confidence Interval | p-value |
| Age (decade) | 0.87 | 0.84, 0.90 | <0.001 |
|---|---|---|---|
| Socio-economic classification | |||
| ABC1 | — | — | |
| C2DE | 0.81 | 0.71, 0.91 | <0.001 |
| AIC | 5,896 |
Model 2: Collecting and analysing data is good for society
| Characteristic | Odds Ratio | 95% Confidence Interval | p-value |
| Age (decade) | 0.86 | 0.83, 0.89 | <0.001 |
|---|---|---|---|
| Socio-economic classification | |||
| ABC1 | — | — | |
| C2DE | 0.79 | 0.69, 0.89 | <0.001 |
| AIC | 5,711 |
Model 3: When organisations misuse data, they are held accountable
| Characteristic | Odds Ratio | 95% Confidence Interval | p-value |
| Ethnicity | |||
|---|---|---|---|
| White | — | — | |
| Asian | 1.86 | 1.44, 2.41 | <0.001 |
| Black | 1.43 | 1.02, 2.00 | 0.036 |
| Mixed | 1.35 | 0.96, 1.90 | 0.080 |
| Other | 0.99 | 0.63, 1.54 | >0.9 |
| Age (decade) | 0.92 | 0.89, 0.95 | <0.001 |
| Gender | |||
| Female | — | — | |
| Male | 0.85 | 0.75, 0.96 | 0.009 |
| Other/Undisclosed | 1.12 | 0.50, 2.46 | 0.8 |
| Socio-economic classification | |||
| ABC1 | — | — | |
| C2DE | 1.14 | 1.01, 1.29 | 0.038 |
| Region | |||
| London | — | — | |
| Midlands | 0.88 | 0.70, 1.09 | 0.2 |
| N Ireland | 0.66 | 0.42, 1.02 | 0.067 |
| North | 0.88 | 0.71, 1.10 | 0.3 |
| Scotland | 0.69 | 0.52, 0.91 | 0.009 |
| South | 0.83 | 0.66, 1.04 | 0.10 |
| Wales | 1.10 | 0.79, 1.52 | 0.6 |
| AIC | 5,782 |
12.2 Trust in government and government data use
Model 4: Providing the government with information about me so that information can inform policies
| Characteristic | Odds Ratio | 95% Confidence Interval | p-value |
| Ethnicity | |||
|---|---|---|---|
| White | — | — | |
| Asian | 0.71 | 0.54, 0.94 | 0.016 |
| Black | 0.87 | 0.61, 1.24 | 0.4 |
| Mixed | 0.96 | 0.66, 1.39 | 0.8 |
| Other | 0.58 | 0.35, 0.94 | 0.029 |
| Socio-economic classification | |||
| ABC1 | — | — | |
| C2DE | 0.82 | 0.72, 0.94 | 0.005 |
| Trust in government | |||
| Do not trust government | — | — | |
| Trust government | 3.37 | 2.91, 3.91 | <0.001 |
| Data use is good for society | |||
| Neutral / Disagree / dk | — | — | |
| Agree | 3.14 | 2.74, 3.60 | <0.001 |
| AIC | 5,050 |
Model 5: Providing the government with information about me so that they can deliver public services
| Characteristic | Odds Ratio | 95% Confidence Interval | p-value |
| Age (decade) | 1.06 | 1.02, 1.10 | 0.002 |
|---|---|---|---|
| Socio-economic classification | |||
| ABC1 | — | — | |
| C2DE | 0.85 | 0.75, 0.98 | 0.021 |
| Trust in government | |||
| Do not trust government | — | — | |
| Trust government | 3.11 | 2.67, 3.62 | <0.001 |
| Data use is good for society | |||
| Neutral / Disagree / dk | — | — | |
| Agree | 2.94 | 2.55, 3.38 | <0.001 |
| AIC | 5,057 |
12.3 Sharing demographic Data (Q34)
Would you rather not provide demographic data, even if it means a system could not be checked to see if it’s unfair to people from different groups, or the system be checked to see if it is unfair for different groups, and would be comfortable with sharing information about demographic data to enable that?
Model 6: Demographic differences in attitudes
| Characteristic | Odds Ratio | 95% Confidence Interval | p-value |
| Ethnicity | |||
|---|---|---|---|
| White | — | — | |
| Asian | 0.73 | 0.55, 0.99 | 0.037 |
| Black | 0.93 | 0.63, 1.39 | 0.7 |
| Mixed | 0.66 | 0.46, 0.97 | 0.030 |
| Other | 0.62 | 0.37, 1.05 | 0.068 |
| Age (decade) | 1.21 | 1.16, 1.27 | <0.001 |
| Gender | |||
| Female | — | — | |
| Male | 0.76 | 0.65, 0.89 | <0.001 |
| Other/Undisclosed | 2.28 | 0.75, 9.91 | 0.2 |
| Region | |||
| London | — | — | |
| Midlands | 1.25 | 0.97, 1.61 | 0.085 |
| N Ireland | 1.80 | 1.04, 3.24 | 0.041 |
| North | 1.56 | 1.20, 2.03 | 0.001 |
| Scotland | 1.64 | 1.17, 2.30 | 0.004 |
| South | 1.31 | 1.00, 1.71 | 0.046 |
| Wales | 1.27 | 0.85, 1.91 | 0.2 |
| Data use is good for society | |||
| Neutral / Disagree / dk | — | — | |
| Agree | 1.70 | 1.45, 1.99 | <0.001 |
| AIC | 4,187 |
Model 7: Types of data and interactive effects with demographics
| Characteristic | Odds Ratio | 95% Confidence Interval | p-value |
| Ethnicity | |||
|---|---|---|---|
| White | — | — | |
| Asian | 0.63 | 0.37, 1.08 | 0.085 |
| Black | 1.36 | 0.67, 2.94 | 0.4 |
| Mixed | 0.56 | 0.28, 1.13 | 0.10 |
| Other | 1.29 | 0.50, 3.74 | 0.6 |
| Data type | |||
| my gender | — | — | |
| my ethnicity | 1.19 | 0.65, 2.17 | 0.6 |
| the region I live in | 0.73 | 0.41, 1.30 | 0.3 |
| Age (decade) | 1.19 | 1.14, 1.24 | <0.001 |
| Gender | |||
| Female | — | — | |
| Male | 0.69 | 0.53, 0.91 | 0.008 |
| Other/Undisclosed | 1.32 | 0.20, 25.8 | 0.8 |
| Region | |||
| London | — | — | |
| Midlands | 1.38 | 0.87, 2.16 | 0.2 |
| N Ireland | 1.73 | 0.68, 5.02 | 0.3 |
| North | 1.81 | 1.12, 2.90 | 0.015 |
| Scotland | 2.17 | 1.17, 4.14 | 0.015 |
| South | 1.32 | 0.82, 2.10 | 0.2 |
| Wales | 1.42 | 0.70, 3.03 | 0.3 |
| Ethnicity * Data type | |||
| Asian * my ethnicity | 1.16 | 0.54, 2.49 | 0.7 |
| Black * my ethnicity | 0.58 | 0.22, 1.49 | 0.3 |
| Mixed * my ethnicity | 1.50 | 0.59, 3.89 | 0.4 |
| Other * my ethnicity | 0.24 | 0.05, 1.00 | 0.053 |
| Asian * the region I live in | 1.41 | 0.70, 2.80 | 0.3 |
| Black * the region I live in | 0.67 | 0.24, 1.81 | 0.4 |
| Mixed * the region I live in | 1.24 | 0.49, 3.11 | 0.6 |
| Other * the region I live in | 0.46 | 0.13, 1.56 | 0.2 |
| Data type * Gender | |||
| my ethnicity * Male | 1.07 | 0.73, 1.56 | 0.7 |
| the region I live in * Male | 1.20 | 0.83, 1.73 | 0.3 |
| my ethnicity * Other/Undisclosed | 2.81 | 0.09, 88.9 | 0.5 |
| the region I live in * Other/Undisclosed | 1.39 | 0.04, 43.8 | 0.8 |
| Data type * Region | |||
| my ethnicity * Midlands | 0.89 | 0.47, 1.68 | 0.7 |
| the region I live in * Midlands | 0.84 | 0.45, 1.56 | 0.6 |
| my ethnicity * N Ireland | 1.16 | 0.26, 5.56 | 0.8 |
| the region I live in * N Ireland | 1.05 | 0.27, 3.89 | >0.9 |
| my ethnicity * North | 0.67 | 0.35, 1.30 | 0.2 |
| the region I live in * North | 0.95 | 0.50, 1.81 | 0.9 |
| my ethnicity * Scotland | 0.59 | 0.25, 1.36 | 0.2 |
| the region I live in * Scotland | 0.65 | 0.27, 1.53 | 0.3 |
| my ethnicity * South | 0.78 | 0.41, 1.51 | 0.5 |
| the region I live in * South | 1.22 | 0.64, 2.33 | 0.5 |
| my ethnicity * Wales | 1.20 | 0.41, 3.58 | 0.7 |
| the region I live in * Wales | 0.74 | 0.28, 1.93 | 0.5 |
| AIC | 4,252 |
12.4 Interventions to increase comfort with sharing data (Q35)
Thinking about the different types of personal data that are needed in order to check if the use of algorithms is fair for different groups (e.g. gender, ethnicity, disability and sexuality), in each of the scenarios would the action make you feel more or less comfortable sharing this data for the purpose of checking if systems are fair.
Model 8: There is a dedicated group of independent experts that grant or reject requests from organisations wishing to use the data
| Characteristic | Odds Ratio | 95% Confidence Interval | p-value |
| Age (decade) | 1.05 | 1.01, 1.09 | 0.008 |
|---|---|---|---|
| Socio-economic classification | |||
| ABC1 | — | — | |
| C2DE | 0.74 | 0.66, 0.84 | <0.001 |
| Ethnicity | |||
| White | — | — | |
| Asian | 0.77 | 0.60, 0.99 | 0.044 |
| Black | 0.82 | 0.59, 1.13 | 0.2 |
| Mixed | 0.96 | 0.69, 1.34 | 0.8 |
| Other | 0.57 | 0.37, 0.88 | 0.013 |
| AIC | 5,928 |
Model 9: There is a dedicated group of ordinary citizens that collectively grant or reject requests from organisations wishing to use the data
| Characteristic | Odds Ratio | 95% Confidence Interval | p-value |
| Socio-economic classification | |||
|---|---|---|---|
| ABC1 | — | — | |
| C2DE | 0.78 | 0.69, 0.88 | <0.001 |
| Gender | |||
| Female | — | — | |
| Male | 1.28 | 1.13, 1.45 | <0.001 |
| Other/Undisclosed | 1.47 | 0.66, 3.22 | 0.3 |
| Ethnicity | |||
| White | — | — | |
| Asian | 1.30 | 1.02, 1.67 | 0.035 |
| Black | 1.42 | 1.03, 1.96 | 0.032 |
| Mixed | 1.21 | 0.87, 1.69 | 0.3 |
| Other | 1.21 | 0.78, 1.86 | 0.4 |
| AIC | 5,785 |
Model 10: There is a tool (e.g an app or website) that allows you to personally assess whether you wish for data about you to be accessed on a case-by-case basis
| Characteristic | Odds Ratio | 95% Confidence Interval | p-value |
| Age (decade) | 1.06 | 1.02, 1.09 | 0.001 |
|---|---|---|---|
| Socio-economic classification | |||
| ABC1 | — | — | |
| C2DE | 0.77 | 0.68, 0.87 | <0.001 |
| AIC | 5,796 |
Model 11: There is a dedicated and trusted organisation that ensures personal data about you is stored securely and only shared when privacy protections are in place
| Characteristic | Odds Ratio | 95% Confidence Interval | p-value |
| Age (decade) | 1.10 | 1.06, 1.14 | <0.001 |
|---|---|---|---|
| Socio-economic classification | |||
| ABC1 | — | — | |
| C2DE | 0.70 | 0.62, 0.79 | <0.001 |
| Ethnicity | |||
| White | — | — | |
| Asian | 0.79 | 0.61, 1.01 | 0.061 |
| Black | 0.80 | 0.58, 1.12 | 0.2 |
| Mixed | 0.71 | 0.51, 0.99 | 0.042 |
| Other | 0.65 | 0.42, 1.00 | 0.047 |
| AIC | 5,705 |
Model 12: New technologies are used that allow data to be used without any personal information about you being given to the organisation
| Characteristic | Odds Ratio | 95% Confidence Interval | p-value |
| Age (decade) | 1.09 | 1.05, 1.13 | <0.001 |
|---|---|---|---|
| Socio-economic classification | |||
| ABC1 | — | — | |
| C2DE | 0.74 | 0.66, 0.84 | <0.001 |
| Region | |||
| London | — | — | |
| Midlands | 1.12 | 0.90, 1.39 | 0.3 |
| N Ireland | 1.26 | 0.82, 1.95 | 0.3 |
| North | 1.25 | 1.00, 1.57 | 0.047 |
| Scotland | 1.15 | 0.87, 1.52 | 0.3 |
| South | 0.98 | 0.78, 1.23 | 0.9 |
| Wales | 1.05 | 0.76, 1.46 | 0.8 |
| Ethnicity | |||
| White | — | — | |
| Asian | 1.01 | 0.78, 1.31 | >0.9 |
| Black | 1.26 | 0.90, 1.78 | 0.2 |
| Mixed | 1.05 | 0.75, 1.47 | 0.8 |
| Other | 0.60 | 0.38, 0.93 | 0.024 |
| AIC | 5,876 |
12.5 AI Outcomes (Q25b)
To what extent do you think the use of Artificial Intelligence will have a positive or negative impact for the following types of situations?
Model 14: How fairly people are treated in society
| Characteristic | Odds Ratio | 95% Confidence Interval | p-value |
| Ethnicity | |||
|---|---|---|---|
| White | — | — | |
| Asian | 1.33 | 1.01, 1.75 | 0.042 |
| Black | 1.03 | 0.72, 1.48 | 0.9 |
| Mixed | 1.55 | 1.08, 2.21 | 0.015 |
| Other | 1.13 | 0.68, 1.85 | 0.6 |
| Age (decade) | 0.87 | 0.84, 0.91 | <0.001 |
| Gender | |||
| Female | — | — | |
| Male | 1.45 | 1.25, 1.69 | <0.001 |
| Other/Undisclosed | 2.20 | 0.91, 5.12 | 0.069 |
| At least partially explain AI | |||
| Cannot explain AI | — | — | |
| Can explain AI | 0.84 | 0.72, 0.97 | 0.018 |
| Data use is good for society | |||
| Neutral / Disagree / dk | — | — | |
| Agree | 2.83 | 2.46, 3.26 | <0.001 |
| AIC | 4,665 |
Model 15: How easy it is to do day-to-day tasks (e.g. plan travel routes, order food, find information online)
| Characteristic | Odds Ratio | 95% Confidence Interval | p-value |
| Ethnicity | |||
|---|---|---|---|
| White | — | — | |
| Asian | 1.33 | 1.01, 1.76 | 0.044 |
| Black | 1.05 | 0.74, 1.51 | 0.8 |
| Mixed | 0.94 | 0.66, 1.35 | 0.7 |
| Other | 1.28 | 0.80, 2.11 | 0.3 |
| Socio-economic classification | |||
| ABC1 | — | — | |
| C2DE | 0.86 | 0.75, 0.98 | 0.025 |
| At least partially explain AI | |||
| Cannot explain AI | — | — | |
| Can explain AI | 1.83 | 1.61, 2.09 | <0.001 |
| Data use is good for society | |||
| Neutral / Disagree / dk | — | — | |
| Agree | 2.72 | 2.37, 3.12 | <0.001 |
| AIC | 5,217 |
Model 16: How easy it is to save money on services and goods (e.g. transportation, energy, food)
| Characteristic | Odds Ratio | 95% Confidence Interval | p-value |
| Ethnicity | |||
|---|---|---|---|
| White | — | — | |
| Asian | 1.47 | 1.13, 1.91 | 0.004 |
| Black | 1.28 | 0.91, 1.83 | 0.2 |
| Mixed | 1.13 | 0.80, 1.59 | 0.5 |
| Other | 1.01 | 0.63, 1.62 | >0.9 |
| Socio-economic classification | |||
| ABC1 | — | — | |
| C2DE | 0.83 | 0.73, 0.95 | 0.006 |
| At least partially explain AI | |||
| Cannot explain AI | — | — | |
| Can explain AI | 1.41 | 1.24, 1.61 | <0.001 |
| Data use is good for society | |||
| Neutral / Disagree / dk | — | — | |
| Agree | 2.50 | 2.19, 2.85 | <0.001 |
| AIC | 5,394 |
Model 17: Job opportunities for people like you and your family
| Characteristic | Odds Ratio | 95% Confidence Interval | p-value |
| Ethnicity | |||
|---|---|---|---|
| White | — | — | |
| Asian | 1.73 | 1.33, 2.25 | <0.001 |
| Black | 0.94 | 0.66, 1.33 | 0.7 |
| Mixed | 0.96 | 0.66, 1.37 | 0.8 |
| Other | 1.20 | 0.75, 1.92 | 0.4 |
| Age (decade) | 0.90 | 0.87, 0.94 | <0.001 |
| Gender | |||
| Female | — | — | |
| Male | 1.33 | 1.16, 1.53 | <0.001 |
| Other/Undisclosed | 0.75 | 0.27, 1.85 | 0.6 |
| At least partially explain AI | |||
| Cannot explain AI | — | — | |
| Can explain AI | 0.83 | 0.73, 0.96 | 0.011 |
| Data use is good for society | |||
| Neutral / Disagree / dk | — | — | |
| Agree | 2.32 | 2.03, 2.66 | <0.001 |
| AIC | 5,022 |
Model 18: Healthcare for people like you and your family (e.g. the speed of disease diagnosis and quality of treatment)
| Characteristic | Odds Ratio | 95% Confidence Interval | p-value |
| Age (decade) | 1.09 | 1.05, 1.13 | <0.001 |
|---|---|---|---|
| At least partially explain AI | |||
| Cannot explain AI | — | — | |
| Can explain AI | 1.55 | 1.36, 1.76 | <0.001 |
| Data use is good for society | |||
| Neutral / Disagree / dk | — | — | |
| Agree | 2.45 | 2.15, 2.81 | <0.001 |
-
All models are logistic regression models, reported in the appendix in full. ↩
-
Throughout this report we refer to socio economic grade or “SEG”, with the main SEG categories being AB, C1, C2 and DE. Those in the AB category occupy higher or intermediate professional, managerial or administrative jobs; students or those in clerical or junior managerial, professional or administrative roles fall into the C1 definition. C2 comprises skilled manual workers and D semi- or unskilled manual workers. Those who are not in paid work, are homemakers or carers, are in casual work or are retired fall into category E. ↩
-
Please note that these risks have increased comparatively since Wave 1. At this question, respondents are asked to select one risk out of a list of eight different risks. As a result, all answers are summed to a total of 100%. Any increases in proportions across survey waves happen at the expense of other risks from the list, i.e. an increase of one leads to the decrease of other. ↩
-
Those from an Asian ethnic background in our analysis are comprised of those who answered that their background was Indian, Pakistani, Bangladeshi, Chinese, or any other Asian background. The full question as it was asked in the survey can be found in the questionnaire in the appendix. ↩
-
Those from a Black ethnic background in our analysis are comprised of those who answered that their background was Black African, Black Caribbean, Black British or any other Black background. The full question as it was asked in the survey can be found in the questionnaire in the appendix. ↩
-
Those from a White ethnic background in our analysis are comprised of those who answered that their background was White English / Welsh / Scottish / Northern Irish / British, White Irish, Gypsy or Irish Traveller, or any other White background. The full question as it was asked in the survey can be found in the questionnaire in the appendix. ↩
-
Logistic regression provides us with an ‘odds ratio’. This tells us the odds of someone with a particular characteristic or attitude reporting, for example, that they agree with a statement, compared with someone with another characteristic or attitude, after taking other possible influences into account. ↩
-
Identifiability refers to individuals being identifiable in the data shared between actors thanks to their personal information being included in the data. ↩
-
Transparency refers to rules that are in place about how the data will be shared and used. ↩
-
Review refers to the review process which decides if the data sharing project is in the public interest by assessing if it meets a clear set of standards about how the data should be used. ↩
-
In order to avoid respondent fatigue, the sample was divided into three subsamples and each subsample presented with one demographic characteristic (gender, ethnicity, or region). This was applied to both general public online (CAWI) and very low digital familiarity (CATI) samples. ↩
-
For the purpose of the regression analysis, the three gender, ethnicity, and region subsamples at Q34 were analysed together. ↩
-
Interaction effects occur when a third variable influences the relationship between an independent and dependent variable, i.e. these variables interact ↩
-
Sum of those to say “I have heard of AI and could give a partial explanation of what it is” and “I have heard of AI and could explain what it is in detail”. ↩
-
Throughout this report we refer to socio economic grade or “SEG”, with the main SEG categories being AB, C1, C2 and DE. Those in the AB category occupy higher or intermediate professional, managerial or administrative jobs; students or those in clerical or junior managerial, professional or administrative roles fall into the C1 definition. C2 comprises skilled manual workers and D semi- or unskilled manual workers. Those who are not in paid work, are homemakers or carers, are in casual work or are retired fall into category E. ↩
