Project Gigabit Voucher Scheme - Voucher Recipient Survey Report Technical Annex
Published 20 November 2026

© Crown copyright 2026
This publication is licensed under the terms of the Open Government Licence v3.0 except where otherwise stated. To view this licence, visit nationalarchives.gov.uk/doc/open-government-licence/version/3 or write to the Information Policy Team, The National Archives, Kew, London TW9 4DU, or email: psi@nationalarchives.gov.uk.
Where we have identified any third party copyright information you will need to obtain permission from the copyright holders concerned.
This publication is available at https://www.gov.uk/government/publications/project-gigabit-voucher-scheme-voucher-recipient-survey-report/project-gigabit-voucher-scheme-voucher-recipient-survey-report-technical-annex
1. Econometric analysis
This Annex sets out the technical details of the econometric analysis underpinning the evaluation of the Project Gigabit Vouchers Scheme. The report sets out the details of the strand of analysis exploring the impacts of the programme on gigabit connectivity. Specifically, an analysis of Connected Nations data on the gigabit capable connectivity in postcode areas using a staggered difference-in-difference approach.
1.1 Overview of approach
The methodology used followed a staggered Difference-in-Difference (Callaway and Sant’Anna, 2024)[footnote 1] approach using Propensity Score Matching (PSM) to assess the impacts of voucher offerings on gigabit capable network rollout. The following stages of data preparation and analysis were taken:
-
Data collection: Baseline (2020) local area statistics (Local Authority District (LAD) median weekly wages, LAD employment and unemployment rates, population density, premises density, working age population, above 65 population, urban/rural classification), and connectivity statistics (properties characterised as ‘white’ in the earliest Open Market Review data, Ultrafast broadband and gigabit capable broadband coverage) were collected for all postcode areas in the UK.
-
Matching: A comprehensive examination of PSM techniques was conducted in order to achieve suitable covariate balance between the treatment and control sample. The selected model was a nearest neighbour probit model with replacement and no discarding.
-
Analysis: A staggered Difference-in-Difference analysis was performed in R to estimate the impacts of voucher take-up on gigabit capable rollout in treated areas between 2020 and 2024.
1.2 Data assembly
Implementation of this form of analysis required access to local area statistics and data on the outcomes of interest for the analysis. Given this analysis was conducted at the postcode level, the data used in this analysis was sought at the lowest administrative level. For some variables, this was possible at the postcode level; higher-level administrative areas were used in cases where postcode data was not available.
1.2.1 Matching variables and outcome variable data
The primary challenge for this type of analysis was establishing a suitable control sample of postcodes that were as similar as possible to the final treated sample of postcodes in terms of covariates assumed to influence the outcomes of interest (in this case, gigabit capable connectivity). To achieve this, several local area statistics were assembled and processed:
- Working Age Population (%) and Population Aged 65+ (%) (Output Area): the proportion of the population that were working age (16 to 64), and the proportion of the population that were aged 65+ in the year closest to the baseline year. Data at the Output Area level was sourced from the Census (2021) for England, Wales and Northern Ireland (ONS) and Scotland’s Census (2022) (National Records of Scotland). Data for all Output Areas was available at the time of collection.
-
Population density (population per square km) (Output Area): A ratio of resident population per square km area (measured as “Extent of the Realm Area”) was calculated in the year closest to the baseline year (2021) at the Output Area. This was estimated using Census population estimates and Standard Area Measurements (SAM) sourced from ONS and National Records of Scotland.
-
Premises density (premises per square km) (Postcode): A ratio of premises per square km area was calculated in the year closest to the baseline year (2021) at the postcode level. This was estimated using premise records obtained from the National Statistics UPRN Lookup and SAM sourced from ONS and National Records of Scotland.
-
Gross weekly earnings in Local Authorities (£): Median gross weekly earnings (£) of all employees in LADs/Local Government Districts were extracted for the baseline year (2020) where data was available. Data was sourced from the Annual Survey of Hours and Earnings. Eight of the 350 England, Wales and Scotland LADs had no available estimates in 2020 due to missing figures/unreliable estimates. In these instances, the closest available 12-month period estimate was taken within a 1 year bound on either side.
-
Employment and unemployment rates in Local Authorities (%): Employment rates in LADs were extracted for the baseline year (2020) where data was available. Data for England, Wales, and Scotland was sourced from the Annual Population Survey, and the Labour Force Survey for Northern Ireland. One of the 350 England, Wales and Scotland LADs (Isles of Scilly) had no employment rate estimates in 2020 due to missing figures. No estimates were available for other years close to 2020 and hence postcodes located in this LAD were dropped. 55 of the 350 England, Wales and Scotland LADs had no unemployment rate estimates in 2020 due to missing figures/unreliable estimates. In these instances, the closest available estimate was taken within a 1 year upper and lower bound. This resulted in figures available for 339 of 350 LADs. Those without data available were dropped from the sample.
- Urban / rural classification (Postcode / Output Area): Rural classification for each postcode was accessed through the National Statistics Postcode Lookup database for England, Wales and Scotland. Data was only available for 2011 rather than 2021. However, it is assumed that postcode rurality does not change significantly between Censuses. Rural classifications were not captured at the postcode level for Northern Ireland. Hence, data was collected at the Data Zone level for Northern Ireland. Due to variations in rural classification measurement, additional data processing was needed to bring estimates into a single binary rural/urban classification.
Additionally, postcode-level connectivity data was assembled and processed:
Pre-2020 and baseline (2020) connectivity data:
- Gigabit capable (previously Fibre to the Premises (FTTP)) and ultrafast broadband connectivity (Postcode): The proportion of premises with FTTP and ultrafast broadband connectivity in 2019 and 2020 at the postcode level was sourced via Connected Nations.
- “White” Gigabit premises: The proportion of premises identified as “White” (unlikely to receive commercial deployments of superfast broadband infrastructure) at a premise level was provided by BDUK, taken from the earliest version of the Open Market Review data. This was aggregated to a postcode level variable showing the proportion of premises on the postcode which were characterised as “white”.
Post-intervention (2021 to 2024) gigabit capable connectivity data:
- Gigabit capable connectivity (Postcode): The proportion of premises with FTTP connectivity in 2021 to 2024 at the postcode level was sourced via Connected Nations.
Table 1.1 below provides the percentage of postcodes retained for each of the variables (percentages below 100 are due to postcodes being dropped because of missing data or postcode mismatches). The starting sample (1.77 million) of treated and non-treated postcodes was 111,979 and 1,658,937 respectively.
Table 1.1: Data Assembly – Retain Rate
| Variable | Number of treated postcodes retained (%) | Number of non-treated postcodes retained (%) |
|---|---|---|
| Working age population | 111,610 (99.7%) | 1,656,467 (99.8%) |
| Population aged 65+ | 111,944 (99.9%) | 1,657,543 (99.9%) |
| Population density (population per square km) | 111,965 (99.9%) | 1,658,792 (99.9%) |
| Premises density (premises per square km) | 111,965 (99.9%) | 1,658,792 (99.9%) |
| Gross weekly earnings | 109,080 (97.4%) | 1,607,738 (96.9%) |
| Employment rate | 111,965 (99.9%) | 1,658,697 (99.9%) |
| Unemployment rate | 109,868 (98.1%) | 1,639,643 (98.8%) |
| Urban / rural classification | 111,965 (99.9%) | 1,658,792 (99.9%) |
| White gigabit % | 111,977 (99.9%) | 1,658,937 (100%) |
| Pre-intervention (2019) gigabit capable connectivity rate | 108,772 (97.1%) | 1,549,581 (93.4%) |
| Pre-intervention (2019) ultrafast connectivity rate | 108,772 (97.1%) | 1,549,581 (93.4%) |
| Baseline (2020) gigabit capable connectivity rate | 109,149 (97.5%) | 1,560,633 (94.1%) |
| Baseline (2020) ultrafast connectivity rate | 109,149 (97.5%) | 1,560,633 (94.1%) |
| Post-intervention (2021) gigabit capable connectivity rate | 109,484 (97.8%) | 1,569,314 (94.6%) |
| Post-intervention (2022) gigabit capable connectivity rate | 110,306 (98.5%) | 1,584,250 (95.5%) |
| Post-intervention (2023) gigabit capable connectivity rate | 110,575 (98.7%) | 1,593,261 (96.0%) |
| Post-intervention (2024) gigabit capable connectivity rate | 110,822 (99.0%) | 1,600,386 (96.5%) |
Source: Ipsos analysis
The total sample at the end of the data assembly stage was 1,582,123, comprised of 103,363 treated postcodes and 1,478,760 non-treated postcodes.
1.2.2 Treatment data
The second stage of data processing involved filtering out postcodes that the database recorded as having received a voucher in year previous to the 2020 baseline or for which a date of receipt was not available. This resulted in a total sample of 1,538,206 at the end of the preliminary data processing stage, split by 66,079 treated and 1,472,127 non-treated postcodes.
1.3 Propensity Score Matching
A propensity score matching exercise was undertaken to match the sample of postcodes receiving the vouchers to postcodes that did not receive any vouchers. The first stage of this process involved the implementation of a logistic regression model to examine the relationship between the likelihood that a postcode received the vouchers intervention and the characteristics of the postcode in terms of the aforementioned matching variables:
- Premises density helps account for the concentration of buildings and infrastructure, which could influence the feasibility and cost-effectiveness of broadband deployment.
- Gross weekly earnings reflect the economic well-being of an area and can influence both the demand for high-speed broadband and the ability of residents and businesses to invest in or switch to new services.
- Employment and unemployment rates act as an indicator of economic health and can affect broadband adoption and usage patterns. Areas with higher employment might pursue more digital connectivity initiatives, while areas with higher unemployment may have different access and response to broadband improvements.
- Population density can affect the logistics and costs associated with infrastructure provision, influencing broadband availability and uptake.
- Urban areas typically have more developed infrastructure and higher broadband demand.
- Working age population indicates the potential labour force that might utilise broadband for work, education, and other activities, while the population aged 65+ variable accounts for an age group that might have distinct needs and adoption patterns regarding broadband.
The results of the first stage logit models are shown in Table 1.2 below.
Table 1.2: Propensity Score Matching – 1st Stage Logit Model
| Variable | Coefficient | Standard Error |
|---|---|---|
| Premises density (premises per square km) | -0.00003*** | 0.00001 |
| Gross weekly earnings | 0.00061*** | 0.00009 |
| Employment rate | -0.02995*** | 0.00122 |
| Population density (population per square km) | -0.00008*** | 0.00001 |
| Urban / rural classification | -3.38696*** | 0.02108 |
| Unemployment rate | -0.07944*** | 0.00293 |
| Working age population | 0.00798*** | 0.00125 |
| Population aged 65+ | 0.02174*** | 0.00093 |
| White gigabit % | 0.78319*** | 0.01847 |
| Ultrafast 2019 | -0.01672*** | 0.00078 |
| Gigabit capable 2019 | 0.01479*** | 0.00083 |
| Ultrafast 2020 | -0.00443*** | 0.00075 |
| Gigabit capable 2020 | -0.01078*** | 0.00078 |
Source: See data sources, Ipsos analysis. ***, **, and * indicate if an estimated coefficient is significant at the 99, 95 or 90 percent level of confidence.
The second stage of the PSM process matched postcodes where they shared similar estimated probabilities of receiving a voucher. Postcodes receiving the vouchers were matched to their nearest statistical neighbour in the comparison pool (with replacement, i.e., potential comparison postcodes can be used multiple times as matches). A total of 66,079 postcodes receiving vouchers were matched to 49,801 comparison postcodes using this algorithm. To examine the effectiveness of PSM in balancing observed covariates between the treatment and control groups, we examined Standardised Mean Differences (SMDs), mean differences, and p-values for each covariate before and after matching. The SMD quantifies the difference in means between groups, standardised by the pooled standard deviation, and is not affected by sample size. An SMD less than 0.1 is commonly regarded as indicating acceptable balance. The performance of the PSM in terms of balancing the samples of postcodes receiving the vouchers and those that did not are reported in table 1.3 below.
Before matching, all covariates exhibited substantial imbalance. After matching, balance improved across all covariates. All covariates had post-matching SMDs below the conventional 0.1 threshold, suggesting that matching was effective in creating comparable groups on observed characteristics.
Table 1.3: Characteristics of sampled postcodes receiving vouchers and postcodes that did not
| Unmatched sample | Matched sample | |||||
|---|---|---|---|---|---|---|
| Means (Treated Postcodes) | Means (Comparison Postcodes) | SMD | Means (Treated Postcodes) | Means (Comparison Postcodes) | SMD | |
| Premises density (premises per square km) | 621.72 | 3089.31 | -2.23 | 621.72 | 604.39 | 0.02 |
| Gross weekly earnings | 458.75 | 483.01 | -0.50 | 458.75 | 459.63 | -0.02 |
| Employment rate | 76.17 | 75.25 | 0.24 | 76.17 | 76.39 | -0.06 |
| Population density (population per square km) | 927.58 | 4709.70 | -2.39 | 927.58 | 897.94 | 0.02 |
| Urban / rural classification | 0.04 | 0.77 | -3.66 | 0.04 | 0.04 | 0.00 |
| Unemployment rate | 4.08 | 4.76 | -0.44 | 4.08 | 4.05 | 0.02 |
| Working age population | 57.12 | 62.43 | -0.84 | 57.12 | 57.16 | -0.01 |
| Population aged 65+ | 27.93 | 20.33 | 0.89 | 27.93 | 27.94 | 0.00 |
| White gigabit % | 0.72 | 0.61 | 0.50 | 0.72 | 0.72 | 0.01 |
| Ultrafast 2019 | 4.53 | 47.86 | -2.33 | 4.53 | 4.51 | 0.00 |
| Gigabit capable 2019 | 3.46 | 10.39 | -0.42 | 3.46 | 3.51 | 0.00 |
| Ultrafast 2020 | 5.85 | 53.03 | -2.23 | 5.85 | 5.83 | 0.00 |
| Gigabit capable 2020 | 4.62 | 25.24 | -1.08 | 4.62 | 4.67 | 0.00 |
1.4 Parallel trends
The validity of estimates of impacts derived from difference-in-differences models depends on the degree to which the parallel trends assumption holds (i.e. that postcodes not receiving vouchers would have followed similar trends to those receiving vouchers in the absence of the programme). This cannot be established directly, but evidence in support of the assumption can be obtained by testing for the presence of differential trends before the programme.
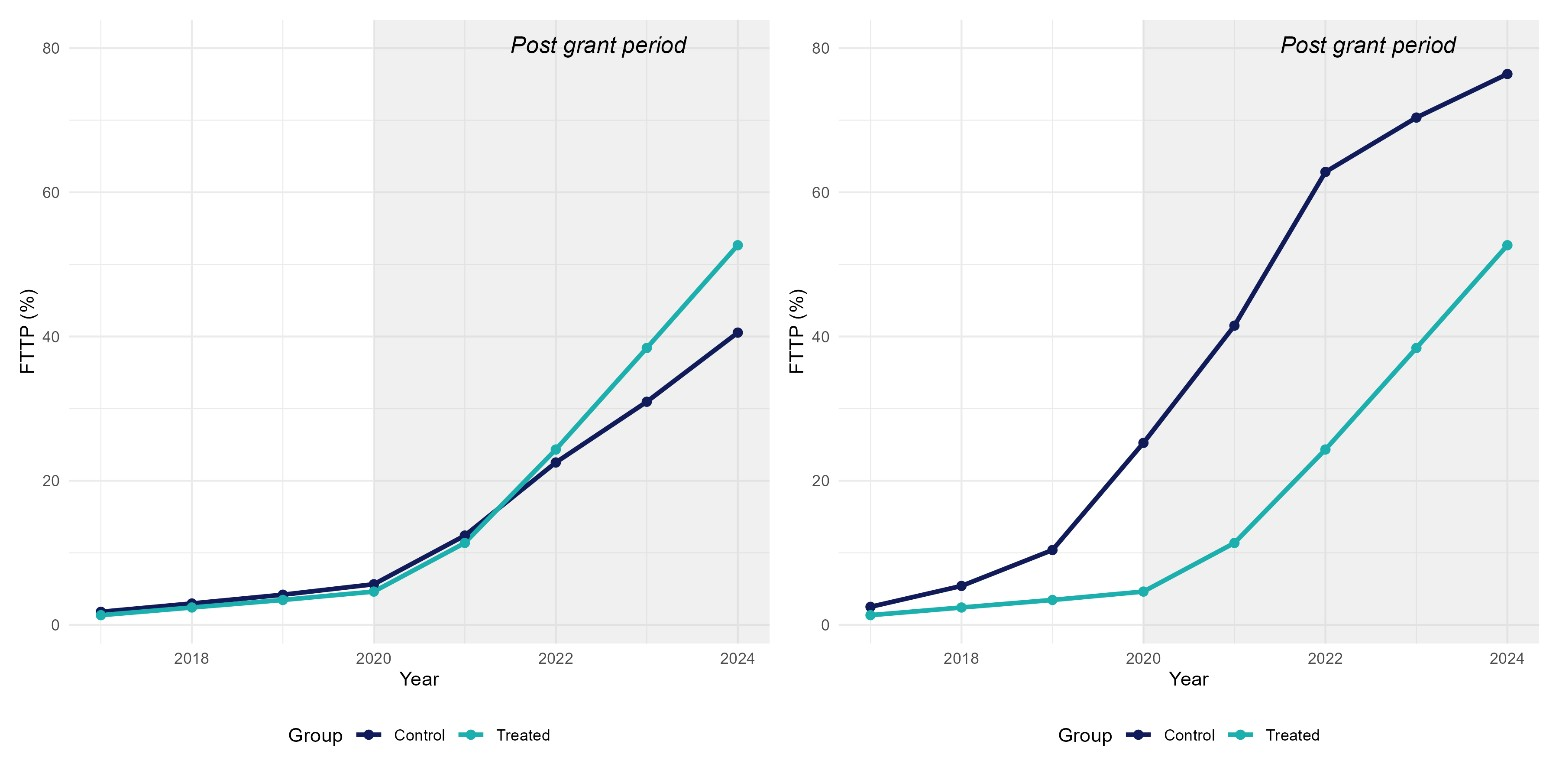
Figure 1.1 provides descriptive comparisons of changes in the average gigabit capable connectivity between 2017 and 2024 for postcodes receiving vouchers and the two comparison samples (PSM on the left and unmatched on the right). The analysis shows the pre-2020 trajectory of gigabit capable connectivity was clearly divergent when comparing treated postcodes with the full unmatched sample of non-treated postcodes. The extent of this divergence was substantially reduced in the samples of postcodes matched using PSM.
Figure 1.1: Average FTTP – postcodes receiving vouchers versus matched comparison sample (left panel) and unmatched/full comparison sample (right panel)
Source: Connected Nations, Ipsos analysis.
1.5 Econometric analysis
Counterfactual selection will not fully eliminate all the potential sources of bias, in fact some issues are related to postcodes’ time invariant characteristics (e.g. rurality) or to specific time shocks that cannot be controlled for by a standard Ordinary Least Squares regression model. To mitigate these issues, we estimated the impact of the programme using a ‘two-way fixed effects’ models as follows:
yit = α + βTit + ρ∙Xit ∙t + αi + αt + uit
This model explains the relationship between the outcomes of interest for postcode i in period t (𝑦𝑖𝑡) as a function of whether a postcode received any vouchers through the scheme (the Tit indicator, that took the value of 1 for beneficiary postcode areas and a value of 0 for non-beneficiary postcode areas). The parameter 𝛽 provides an estimate of the causal effect of the schemes’ participation on the outcome of interest. This approach is robust to any time invariant but unobserved differences between postcodes (αi) and unobserved but time specific shocks (αt).
Traditional Difference in Difference(DiD) methods using two-way fixed effects regressions are commonly used to assess the impact of policies introduced at various times. However, new research highlights that these models may provide misleading results, especially when treatment effects differ across groups or change over time. To tackle these issues, researchers have created more adaptable estimators that consider staggered treatment timing and differences in treatment effects.
This analysis uses a recent advancement of the DiD framework designed for scenarios with continuous treatment and multiple time periods, developed by Callaway, Goodman-Bacon, and Sant’Anna (2024)[footnote 2]. Their method extends the typical DiD approach to handle treatments with varying intensities, such as partial or phased exposure, instead of just treated versus untreated cases. Specifically, they apply a nonparametric estimator to identify level treatment effects, meaning the impact of moving from no treatment to a specific treatment intensity, assuming a generalised parallel trends condition. The model tracks outcome changes for treated postcodes with varying intensities and compares them to a control group of postcodes that never receive treatment, using an event-study design to measure dynamic effects over time. These group-time effects are combined using dose-weighted averages to offer a clear summary of the programme’s impact across different groups and periods.
The group-time average treatment effect estimator can be written as:
ATT(d|d)g,t = E[Yit - Yi,g-1 | Gi = g] - E[Yit - Yi,g-1 | Di = 0, t≥g]
Where:
E[Yit - Yi,g-1 | Gi=g] is the observed change in the outcome (FTTP take-up) from pre-treatment (g-1) to time t, for postcodes first treated in year g.
E[Yit - Yi,g-1 | Di = 0,t ≥ g] is the counterfactual trend, i.e. how postcodes that were never treated evolved over the same time window, used as the comparison group.
The equation above gives the treatment effect time t for postcodes first treated in year g and it is computed by comparing changes in outcomes for group g between period g-1 to that of a control group of never treated postcodes. This is then aggregated across groups using weights based on group sizes and exposure patterns.
Our chosen DiD estimator for staggered treatment effects was implemented in R using the ‘contdid’ package. Given the potential drawbacks of the two-way fixed effects models, these results are considered the most robust. At the time of analysis, the ‘contdid’ package was not written to support inclusion of control variables and hence were not included in the estimation. In addition, the validity of findings partly depends on a parallel trends’ assumption – which assumes that treated postcodes would have followed a similar trajectory in the absence of the programme to the comparison group.
1.6 Regression results
The section below presents the results of the econometric analysis using the datasets discussed in section 1.2. Table 1.4 provides the results of the analysis using the model specification outlined above.
The column titled “Estimated % impact of participation in Vouchers” provides the overall ATT estimate from the regression, which represent the average estimated effect of vouchers on FTTP take-up. The event-time effects reflect the evolution of treatment effects relative to the year before treatment, show how fibre take-up changes in the years before and after a postcode first received the intervention.
Results that are statistically significant (CI 95%) are denoted with stars reflecting the standard significance level.
Table 1.4: Overall Vouchers regression results
| Event Time | Estimate | Std. Error | 95% Confidence Interval | |
|---|---|---|---|---|
| Lower | Upper | |||
| Estimated impact of Vouchers on FTTP take-up | ||||
| Aggregated | 0.1034* | 0.0017 | 0.1001 | 0.1067 |
| Event-time effects | ||||
| -4 | 0.0084* | 0.0013 | 0.0051 | 0.0118 |
| -3 | -0.0186* | 0.0011 | -0.0216 | -0.0157 |
| -2 | -0.0182* | 0.0007 | -0.02 | -0.0163 |
| -1 | -0.0361* | 0.0006 | -0.0378 | -0.0344 |
| 0 | 0.0164* | 0.0012 | 0.0132 | 0.0195 |
| 1 | 0.1322* | 0.0022 | 0.1263 | 0.1381 |
| 2 | 0.2017* | 0.0028 | 0.1942 | 0.2093 |
| 3 | 0.2404* | 0.0039 | 0.2301 | 0.2506 |
The results are presented visually in Figure 1.2 below.
Figure 1.2: Average Treatment Effects of the rollout in pre-treatment post-treatment periods
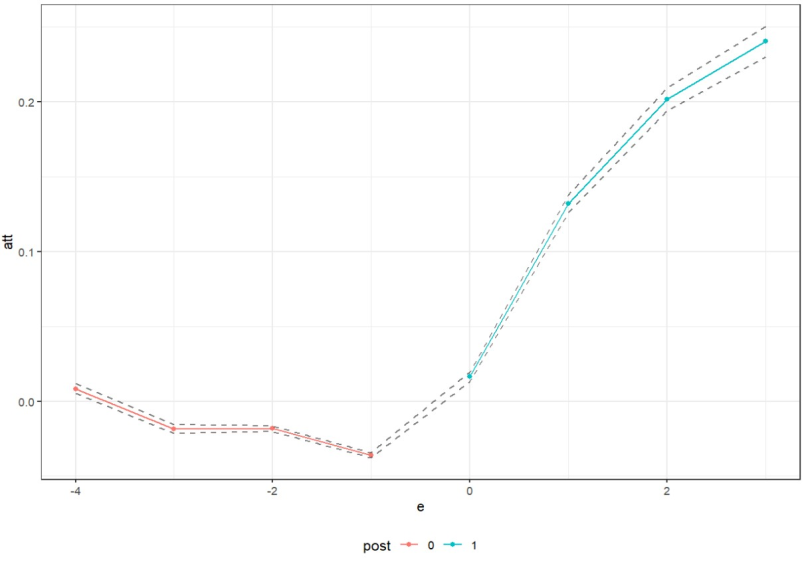
The results presented in Table 1.4 suggest:
- Overall treatment effect: Moving from no treatment to full treatment is associated with a 10-percentage point increase on average among treated postcodes.
- Pre-treatment: pre-treatment period (-3, -2, -1) coefficients represent the relationship between future treatment intensity and prior outcomes. While treatment has not occurred in these pre-treatment periods, the model compares units that will receive treatment later versus those that will receive no treatment later. We observe negative pre-treatment coefficients, suggesting that areas which received higher levels of treatment had lower gigabit capable coverage in the years leading up to treatment. This may reflect selection processes, where control areas were already seeing gigabit capable upgrades via alternative mechanisms prior to the intervention studied here. As such, the estimates in the treatment periods should be interpreted as the marginal effect of the programme relative to these alternative rollout trajectories.
- Treatment year: In the treatment year, for every 1 percentage point increase in the proportion of properties receiving vouchers, there was a 0.0164 percentage point increase in properties with gigabit capable coverage.
- Post-treatment: In the years following receipt of vouchers (periods e=1,2 and 3), the effect of vouchers rollout was more pronounced. In the first year after receiving the vouchers, there was a 0.13 percentage point increase in gigabit capable coverage for every 1 percentage point increase in the proportion of properties that received vouchers. This effect further increased to 0.20 percentage points in the second year and 0.24 percentage points in the third-year post-treatment.