Perceptions of temporary use bans (hosepipe bans) in England
Published 15 July 2026
Applies to England

© Crown copyright 2026
This publication is licensed under the terms of the Open Government Licence v3.0 except where otherwise stated. To view this licence, visit nationalarchives.gov.uk/doc/open-government-licence/version/3 or write to the Information Policy Team, The National Archives, Kew, London TW9 4DU, or email: psi@nationalarchives.gov.uk.
Where we have identified any third party copyright information you will need to obtain permission from the copyright holders concerned.
This publication is available at https://www.gov.uk/government/publications/perceptions-of-temporary-use-bans-hosepipe-bans-in-england/perceptions-of-temporary-use-bans-hosepipe-bans-in-england
1. Introduction
1.1 Background
Ipsos was commissioned by the Environment Agency to conduct research on public perceptions and attitudes towards temporary use bans (TUBs), also known as hosepipe bans, during droughts and periods of hot weather. The main goal was to better understand how people view these restrictions, what makes them feel acceptable, how they relate to keeping the water supply reliable and to protecting the environment, and to explore effective communication strategies for engaging the public about these measures.
1.2 Research objectives
The study set out to build an evidence base on how the public perceive, experience and respond to TUBs and related communications. Specifically, it aimed to:
- understand public perception of the need for TUBs and the rationale behind their implementation during droughts and periods of hot weather
- identify acceptable frequencies and timing of TUBs, including public expectations around their use across different seasons such as autumn and winter
- assess public understanding of the links between TUBs, water supply security, and environmental protection
- identify the main objections and barriers to compliance with TUBs, including understanding why people may resist or fail to adhere to restrictions during drought periods
- examine messages to improve the acceptability and effectiveness of TUBs and evaluate sources of information, including trusted organisations
- explore public awareness of alternatives to TUBs and understand what restrictions people believe TUBs should and should not include
1.3 Methodology
An online survey of 2,100 adults in England using Ipsos’ online panel was conducted. Quotas were set on age, gender, social grade, region, and urban or rural location, with post‑fieldwork weighting to the national profile of England. The sample comprised 1,800 nationally representative individuals and a boost of 300 interviews in areas affected by a 2025 TUB, based on Environment Agency postcode definitions. The survey took around 15 minutes to complete.
To deepen understanding, four online focus groups were conducted, with a cross-section of participants recruited to ensure a mix of gender, age, access to an outdoor space and previous experience of a TUB.
Further details of the methodology are included in Annex 1.
1.4 Reporting notes
Throughout this report we use the term temporary use ban (TUB), which is the formal terminology. In the survey and qualitative research materials, the term ‘hosepipe ban’ was used after first explaining that this refers to a TUB, reflecting the more commonly used public wording. Participant quotes and survey question wording are reported verbatim.
Survey results are subject to margins of error, which vary with the sample size and the percentage figure concerned. The report only comments on subgroup differences where these were found to be statistically significant at the 95% level of confidence. There is a further guide to statistical reliability in Annex 1. Where figures do not sum to 100% this is due to rounding of percentages or because the questions allowed more than one response. Similarly, figures based on aggregating categories may not always reflect the sum of the individual answer categories due to rounding.
This report contains qualitative findings from the focus groups. Qualitative approaches are used to explore the nuances and diversity of views and are not designed to be statistically representative. We have included verbatim comments to illustrate key points. Where quotes are used, they have been anonymised and attributed with the participant type and key characteristics.
1.5 Structure of the report
This report is organised to systematically present the research findings related to public perceptions and attitudes towards TUBs, as follows:
- Introduction (this section).
- Understanding and perception of TUBs: Presents findings on public awareness and understanding of TUBs, examining the perceived rationale behind their implementation during droughts and periods of hot weather, and exploring the links between TUBs, water supply security, and environmental protection.
- Acceptable frequency, timing, and perceived fairness of TUBs: Explores public expectations regarding the frequency and timing of restrictions, including attitudes towards their use across different seasons, and perceptions of fairness.
- Acceptability of alternative methods and scope of restrictions: Examines public awareness of alternatives to TUBs.
- Objections and barriers to compliance: Presents findings on the main objections and barriers to compliance, including understanding the practical challenges to adhering to restrictions during drought periods.
- TUB communication strategies: Presents findings on message effectiveness, evaluating preferred sources of information, and identifying trusted organisations for public engagement.
- Conclusions: Summarises key insights based on the research.
2. Understanding and perception of TUBs
This section examines public awareness and understanding of TUBs, where people had heard about them, whether their area experienced a ban in 2025 and the quality of explanations received from water companies. It also reports on hosepipe ownership and typical use, activities undertaken with hosepipes, perceived reasons for introducing bans, and overall levels of support or opposition. Qualitative findings from focus groups provide deeper insight into which activities were seen as restricted or allowed and how people learned about bans and responded.
Key findings
- Awareness of TUBs was significantly higher in areas affected by a ban in 2025 (51% vs 36% overall), with older respondents aged 55+ (51%), males (41%), rural residents (46%), and those in Yorkshire and Humberside (52%) reporting greater knowledge. Younger respondents and Greater London residents showed notably lower awareness.
- Television news was the primary information source across all groups (58% overall), but direct water company communications were markedly more common in affected areas (42%) compared to overall (26%), highlighting the value of targeted outreach during active restrictions.
- Hosepipe ownership was higher in areas affected by a ban in 2025 (65% vs 61% overall) and predominantly used for horticultural purposes, namely watering garden plants or vegetables (60% overall) and potted plants (59%), followed by vehicle washing (46%).
- Strong consensus emerged on TUB rationale and purpose, with 81% identifying drought water savings as the main reason, and large majorities agreeing bans are necessary to protect supplies (80%), fair (78%), and effective (76%). Most correctly identified restricted activities, though younger groups were less sure about the rules.
- The 2025 ban caused minimal disruption for most in affected areas, with 80% reporting no or only minor impact on daily life. Among those in affected areas who received information on the TUB from their water company, over half (56%) rated the explanation about the ban as good or excellent.
- Overall support for TUBs when water levels fall remained strong (66% overall and 61% in affected areas).
2.1 Level of awareness about TUBs
Respondents were asked to assess their level of awareness regarding TUBs. The findings reveal notable variations in awareness across the general public. Overall, 36% said they knew a great deal about TUBs. Awareness was higher in areas that experienced a TUB in 2025, with 51% reporting they knew a great deal. In contrast, while 41% of all respondents described having a fair amount of awareness only 36% of respondents from affected areas reflected this level of understanding. Moreover, 23% overall reported having little or no awareness of TUBs; the proportion dropped to 13% among respondents in TUB-affected areas. These findings are shown in Figure 2.1.
Figure 2.1: Awareness of TUBs
Q20. Before today, to what extent, if at all, were you aware of what hosepipe bans mean? All respondents (2,100); All in affected areas (564)
| Awareness | A great deal | A fair amount | Just a little | Heard of, know nothing about | Never heard of | Total |
|---|---|---|---|---|---|---|
| Total | 36% | 41% | 15% | 4% | 4% | 100% |
| Affected area | 51% | 36% | 9% | 2% | 2% | 100% |
Older respondents aged 55+ were significantly more aware of hosepipe bans, with 51% knowing a great deal about TUBs. Males also demonstrated higher levels of awareness (41% compared with 36% overall). Regional variations were pronounced, with respondents from Yorkshire and Humberside (52%) and the South East (45%) showing notably higher awareness. Awareness was higher in rural areas, with 46% saying they knew a great deal about TUBs.
Younger respondents reported significantly lower awareness, with 9% having heard of but knew nothing about TUBs and 12% never heard of them. Residents from Greater London also displayed lower awareness, with 7% knowing nothing of TUBs and 9% having never heard of them. It is important to note, however, that Greater London residents were significantly more likely to not own a hosepipe (45% vs 35% total). People without outdoor space were less aware: 18% said they had never heard of hosepipe bans (TUBs). Those without a car were also more likely to be unfamiliar with TUBs (10% compared to 3% for car owners).
2.2 Sources of information about TUBs
Respondents reported a variety of sources of information regarding TUBs. Distinct sources of information emerged amongst both respondents who were aware of TUBs and those living in areas affected by a ban in 2025. Amongst respondents who were aware of TUBs, local or national television news was the most commonly cited source of information (58%), followed by friends, family or neighbours (33%). Local or national radio ranked third (30%), with correspondence from water companies via letter or email in fourth position (26%).
In areas that had a TUB in 2025, local or national TV news was the main source (57%). Water company letters or emails were second (42%), higher than in the overall sample. Family, friends or neighbours were third (39%), and local or national radio was fourth (33%).
Figure 2.2: Sources of information on TUBs
Q21. From which sources have you heard about hosepipe bans? All respondents aware of TUBs (2,011); All in affected areas aware of TUBs (553)
| Source | Total | Affected area |
|---|---|---|
| Local or national TV news | 58% | 57% |
| Mentioned by friends, family or neighbours | 33% | 39% |
| Local or national radio | 30% | 33% |
| Water company letter or email (addressed to you or your household) | 26% | 42% |
| National newspaper (including online version) | 24% | 22% |
| Water company website | 23% | 29% |
| Local newspaper (including online version) | 19% | 24% |
| Local authority websites or newsletters (such as local council, parish council) | 19% | 16% |
| Water company leaflet, newsletter, door drop | 16% | 20% |
| Post on social media (such as Facebook, Twitter/X, Snapchat) | 16% | 19% |
| Advertising on social media (such as Facebook, Twitter/X, Snapchat) | 10% | 10% |
| Website or newsletter from other organisation (such as conservation groups) | 6% | 4% |
| Online videos (such as TikTok, YouTube) | 5% | 4% |
| Posters or billboards | 4% | 3% |
| Other online group (such as local WhatsApp group, Reddit) | 3% | 2% |
| Events in town centres, country fairs etc. | 3% | 1% |
| Other | 1% | 3% |
| Don’t know | 3% | 2% |
Traditional media dominated for older adults: TV news was the leading source among those aged 55+ (71%), and it was also high among households without smart meters (67%) and hosepipe owners (63%). National newspapers were likewise more commonly cited by the 55+ group (30%). By contrast, word of mouth was more prominent among younger respondents and women (40% and 39% respectively). Radio played a notable role for those aged 65-74 (40%), residents in Yorkshire and the Humber (36%), rural residents (36%), and households without smart meters (35%). Direct communications from water companies – letters or emails – were reported more often by people aged 55+ (31%), and by residents in Yorkshire and the Humber (35%), the South East (37%), and non‑smart‑meter households (31%).
Focus group participants who lived in an area where there was a TUB in 2025 were most likely to recall mainstream and local media as the most common first-notice channels. News bulletins and local media helped to reach people in specific areas.
Direct communications from water companies and agencies were trusted and effective when used. These were particularly useful for targeted information, such as where exemptions applied.
“My mum lives about 10 minutes away from where I live and she’s 87 this year, and she had a letter from Yorkshire Water saying because of the age that she’s at, she can continue to use a hosepipe.” (Male, lives in 2025 ban area, garden)
2.3 Household hosepipe ownership
Respondents were asked whether they had a hosepipe within their household. Overall, six in ten (61%) reported having a hosepipe. Hosepipe ownership levels were slightly higher amongst respondents in areas affected by a TUB in 2025, with nearly two-thirds (65%) confirming they had a hosepipe in their household.
Figure 2.3: Hosepipe ownership
Q25. Do you have a hosepipe in your household? All respondents (2,100); All in affected areas (564)
| Ownership | Yes | No | Don’t know | Total |
|---|---|---|---|---|
| Affected area | 65% | 32% | 3% | 100% |
| Total | 61% | 35% | 4% | 100% |
Hosepipe ownership was significantly higher among older respondents (69%), rural residents (74%), higher social grades (67%), and those with water meters (65%), access to an outdoor space (65%), or car availability (67%).
Respondents who reported having a hosepipe in the household were asked about the frequency of their usage during a typical summer period without a ban. The findings reveal varied usage patterns. In a typical summer without a ban, hosepipe owners most often use it “a few times in the summer” (24%), while 47% use it at least weekly (7% daily, 21% more than once a week, 19% about once a week). Smaller shares use it 2 to 3 times a month (13%), about once a month (8%), or not at all (6%).
Figure 2.4: Hosepipe usage during summer
Q26. In a typical summer when no hosepipe ban is in place, how often is a hosepipe used at your home by anyone in your household? All respondents who have a hosepipe in their household (1,293)
| Total | |
|---|---|
| Daily | 7% |
| More than once a week | 21% |
| About once a week | 19% |
| 2-3 times a month | 13% |
| About once a month | 8% |
| A few times in the summer | 24% |
| Never in a normal summer | 6% |
| Don’t know | 2% |
Hosepipe use varied by region and age. In Greater London, 30% with a hosepipe in their household used it more than once a week in summer. Across England, adults aged 35-44 most often reported using one about once a week (26%). By contrast, older adults (55+) were more likely to say they never used a hose in a typical summer (11% and 12%). People without a car and those unaware of hosepipe bans were also less likely to use a hosepipe, with 16% and 12% respectively saying they never used one.
Among households with a hosepipe, the most common uses were watering garden plants or vegetables (60%) and plants in pots or containers (59%), followed by washing vehicles (46%) and watering lawns (29%). The pattern was similar in areas affected by TUBs (watering pots or containers, 59%; garden plants or vegetables, 57%; vehicle washing, 48%; and watering lawns, 26%). Usage was near‑identical among those with and without a water meter (among metered households, watering garden plants or vegetables 60%, pots or containers 59%, vehicles 46%, lawns 30%; among unmetered households, watering garden plants or vegetables 61%, pots 61%, vehicles 49%, lawns 27%). Filling a hot tub (6%) was the least common activity across all groups.
Figure 2.5: Use of hosepipes
Q27. Which of the following activities do you use your hosepipe for? All respondents who have a hosepipe in their household (1,293)
| Activity | Total |
|---|---|
| Watering garden plants or vegetables | 60% |
| Watering plants in pots or containers | 59% |
| Washing a car, motorcycle or other vehicle | 46% |
| Watering the lawn | 29% |
| Cleaning external walls or windows or patio | 24% |
| Cleaning garden furniture | 23% |
| Filling a paddling pool or swimming pool | 21% |
| Filling or topping up a garden pond | 9% |
| Filling a hot tub | 6% |
| Other | 3% |
| Don’t know | 1% |
Some activities revealed differences across multiple groups. Watering plants in pots or containers (59%) was significantly higher among respondents aged 65-74 (69%). Regional and lifestyle factors influenced other activities. Washing a car, motorcycle, or vehicle (46%) was more common among rural residents (54%). Watering the lawn was significantly more common among younger respondents aged 18-34 (38%) and those living in the North East (43%). Respondents from the North East were also more likely to use their hosepipe for cleaning external walls, windows, or patios (37%).
Cleaning garden furniture (23%) was more prevalent among those in Greater London (39%), younger respondents aged 18-34 (31%), and those aged 35-54 (29%). Similarly, filling a paddling or swimming pool (21%) was higher among both groups (33% for 18-34 and 30% for 35-54). Filling or topping up a garden pond showed significant differences linked to engagement with water management: those who experienced a hosepipe ban in 2025 (13%), smart water meter owners (13%), and those who received information about hosepipe bans (18%) were all more likely to report this activity.
Finally, filling a hot tub (6% overall), while the least common activity, showed significant variation. Younger respondents aged 18-34 (12%), those living in Greater London (13%), smart water meter owners (10%), and those who received information about hosepipe bans (13%) were all more likely to report using their hosepipe for this purpose.
2.4 Perceived rationale for TUB implementation
Respondents were asked why they believed TUBs are implemented. Results were consistent across the total sample and those in affected areas. Saving water during droughts was the most frequently identified reason (81% for both groups), followed by ensuring there is enough drinking water for everyone (57% overall and 58% in affected areas). Around three in ten pointed to protecting rivers, lakes and wildlife (31% overall and 32% in affected areas), whilst a quarter (25%) indicated reducing pressure on water treatment works. Saving water companies money was the least commonly reported reason (16% overall and 18% in affected areas).
Figure 2.6: Rationale for TUB implementation
Q28. Why do you think hosepipe bans are introduced? All respondents (2,100); All in affected areas (564)
| Total | Affected area | |
|---|---|---|
| To save water during droughts | 81% | 81% |
| To ensure there is enough drinking water for everyone | 57% | 58% |
| To protect rivers, lakes and wildlife | 31% | 32% |
| To reduce pressure on water treatment works | 25% | 25% |
| To save water companies money | 16% | 18% |
| Don’t know | 3% | 2% |
Perceptions of why TUBs are used varied by subgroup. Older adults aged 55+ most often cited saving water during drought (87%) and ensuring enough drinking water (66%). Younger respondents (31%) and Greater London residents (32%) more often pointed to easing pressure on water treatment works. A minority in several groups thought TUBs were about saving water companies money, including 29% of those unfamiliar with hosepipe bans and 21% of those who had received information about them.
Respondents were asked the extent to which they agreed or disagreed with various statements about the purpose of hosepipe bans. The majority agreed that hosepipe bans help ensure there is enough water for essential uses such as drinking and hygiene (81%), and that they are necessary to protect water supplies during droughts (80%). Around three-quarters agreed that hosepipe bans are a fair way of asking everyone to reduce their water use (78%) and an effective way to reduce water use during periods of high demand (76%). Agreement was slightly lower, though still held by the majority, for the statement that hosepipe bans help protect rivers, lakes and wildlife during low water levels (70%). Disagreement was minimal across all statements, ranging from 6% to 11%.
Figure 2.7: Perceived purpose of TUBs
Q32. To what extent, if at all, do you agree or disagree with the following statements about the purpose of hosepipe bans? All respondents (2,100)
| Response | Strongly agree | Tend to agree | Neither agree nor disagree | Tend to disagree | Strongly disagree | Don’t know | Total |
|---|---|---|---|---|---|---|---|
| Hosepipe bans help to ensure there is enough water for essential uses such as drinking and hygiene | 39% | 42% | 11% | 4% | 2% | 2% | 100% |
| Hosepipe bans are necessary to protect water supplies during droughts | 38% | 42% | 11% | 5% | 2% | 2% | 100% |
| Hosepipe bans are a fair way of asking everyone to reduce their water use | 34% | 44% | 12% | 5% | 3% | 2% | 100% |
| Hosepipe bans are an effective way to reduce water use during periods of high demand | 32% | 44% | 13% | 6% | 2% | 3% | 100% |
| Hosepipe bans help protect rivers, lakes and wildlife during low water levels | 30% | 40% | 16% | 6% | 2% | 5% | 100% |
Agreement on the purpose of hosepipe bans varied by group. Older adults (55+), North West residents, and those who did not report experiencing a ban in 2025 were most likely to say bans are necessary to protect supplies during droughts (85%, 86% and 84% respectively). Similar patterns were evident for ensuring enough water for essential uses: higher agreement among those aged 55+ (87%), North West residents (87%), as well as those who had received information about bans (85%). Belief that bans help protect rivers, lakes and wildlife was higher among those aged 75+ (77%), North West residents (79%), and those who had received information (77%). Respondents aged 75+ also showed stronger agreement that bans effectively reduce water use during high demand (85%) and are a fair way to ask everyone to cut back (86%); the fairness view was also widely shared by women (81%) and North West residents (87%).
2.5 Perceived understanding of activities restricted during TUBs
Respondents were asked which activities are usually restricted during hosepipe bans. Most correctly identified hosepipe-based outdoor uses as restricted: 88% said watering a garden with a hosepipe or sprinkler is restricted, and 88% said washing a car at home with a hosepipe is restricted. A similar proportion identified filling or topping up a swimming or paddling pool or hot tub (84%), cleaning windows with a hosepipe (82%), and using a pressure washer on patios or driveways (81%) as restricted. Understanding was lower for watering a garden via a mains‑fed irrigation system: 65% said this is restricted and 17% were unsure.
By contrast, large majorities recognised that common indoor uses are not restricted: 91% said taking a bath or shower is allowed and 90% said using a dishwasher or washing machine is allowed. Most also understood that watering plants with a watering can (82%) and watering a garden from a water butt (82%) remain permitted.
Figure 2.8: Perceived understanding of activities restricted during TUBs
Q31. Based on your understanding, do you think each of the following activities is usually restricted during hosepipe bans? All respondents (2,100)
| Response | Yes, restricted | No, not restricted | Don’t know | Total |
|---|---|---|---|---|
| Watering a garden using a hosepipe or sprinkler | 88% | 9% | 3% | 100% |
| Washing a car at home using a hosepipe | 88% | 8% | 4% | 100% |
| Filling a swimming pool, paddling pool or hot tub | 84% | 9% | 7% | 100% |
| Cleaning windows using a hosepipe | 82% | 12% | 6% | 100% |
| Using a pressure washer to clean patios or driveways | 81% | 11% | 9% | 100% |
| Watering a garden with an irrigation system from a mains supply | 65% | 18% | 17% | 100% |
| Watering plants with a watering can | 14% | 82% | 5% | 100% |
| Watering a garden from a water butt | 11% | 82% | 7% | 100% |
| Taking a bath or shower | 6% | 91% | 4% | 100% |
| Using a dishwasher or washing machine | 5% | 90% | 5% | 100% |
Overall, correct identification of restrictions was higher among people in areas affected by a ban in 2025, older adults (55+), residents of Yorkshire and the Humber, rural residents, households without smart meters, and those who had heard of hosepipe bans. By contrast, younger adults (18-34), Greater London residents, and smart‑meter households showed lower awareness, with more believing activities like watering gardens, washing cars, filling pools, cleaning windows and using pressure washers are allowed during a ban. For example, 20% of younger respondents thought watering a garden with a hosepipe is permitted, compared with just 3% of those aged 55+. Similarly, 23% of those unaware of hosepipe bans believed filling a pool or hot tub is allowed.
Participants in the focus groups generally understood a ban as restricting the use of anything using hosepipes. Those who had not experienced a ban were less clear about the use of watering cans, indoor buckets and some other appliances, with some believing these would be included in a ban. Some struggled to understand how using buckets for these activities would be any better than using a hosepipe.
“Just doesn’t make sense that you can go inside, fill a bucket up of water, and then take it outside” (Female, no previous ban, garden)
“My thing is, this might be a bit silly, but it says on there you can use a watering can, but you can’t use a hosepipe. How many times could you fill up your watering can then?” (Female, no previous ban, garden)
There were also some ambiguities about specific activities, such as paddling pools, car washing with buckets, taking water from indoors.
“So, if there was a hosepipe ban, would you be allowed to sort of fill up a watering can or a paddling pool from inside your house and take it outside?” (Female, no previous ban, garden)
“You’re allowed to use the indoor water and buckets and so on. I’m assuming that you can still wash the car with buckets of water from outside, or is it saying that in theory you shouldn’t be doing that either?” (Female, no previous ban, garden)
2.6 Recent TUB experience and communication from water companies
Respondents were asked whether their local area had a hosepipe ban at any point in 2025, and whether they received information from their water company regarding the reasons for the ban. Around three in ten overall (29%) indicated that their local area had a hosepipe ban in 2025. This figure was considerably higher amongst those residing in affected areas, with 84% confirming a ban had been in place. Notably, 16% of respondents lived in an area that was not affected by a ban but believed there was one in place. This could reflect factors such as seeing communications they believed applied locally, relocation from a ban‑affected area, or living near areas where restrictions were in place.
Figure 2.9: Experience of a hosepipe ban in 2025
Q22. Did your local area have a hosepipe ban at any point in 2025? All respondents (2,100); All in affected areas (564)
| Response | Total | Affected area |
|---|---|---|
| Had a hosepipe ban in local area in 2025 | 29% | 84% |
People in Yorkshire and the Humber were most likely to say they had a hosepipe ban in 2025 (81%), followed by the South East (55%). Reports of a ban were also more common among higher social grades (37%), metered households (32% with a water meter and 33% with a smart meter, and homes that own a hosepipe (33%).
Those who had experienced a ban in 2025 reported that it had had little or no direct impact on their daily lives, with some describing only a small effect on household routines.
“I don’t really use the hose too much. It was only for little bits here and there … so it didn’t really have too big of an effect on me.” (Male, lives in 2025 ban area, garden)
Most easily adapted their behaviour, for example by using water butts, filling watering cans from inside the house, paying for car washes and in a couple of instances using recycled water.
“If you can’t wash your car at home, you’re going to take it to a car wash of some sort.” (Female, lives in 2025 ban area, garden)
Households with gardens experienced the clearest practical impacts (including brown lawns, curtailed watering, altered car or patio cleaning) and bore the most visible burden; some used alternatives (butts, buckets) yet judged these insufficient for long bans.
“The lawn suffered. That’s about it pretty much for us, because yeah, you do – you’ve got buckets, we’ve got water butts as well, so you can sort of feed the borders and stuff like that.” (Male, lives in 2025 ban area, garden)
“I don’t think a water butt would have lasted 5 minutes, because we had some really hot weather, didn’t we? And I think after probably a few days it’d be empty.” (Male, lives in 2025 ban area, garden)
Of those who experienced a hosepipe ban in affected areas, over half recall receiving information from their water company explaining the reasons for the ban. This was consistent across both groups, with 58% overall and 61% of those in affected areas reporting they had received such communication.
Figure 2.10: Information from water company on reasons for the TUB
Q23. Did you receive any information regarding the reasons for the hosepipe ban from your water company? All in affected areas who recall experiencing a ban in 2025 (475)
| Total | |
|---|---|
| Yes | 61% |
| No | 23% |
Respondents who received information from their water company were asked to rate the quality of the explanation provided about TUB in their local area. Amongst those in affected areas, ratings were generally positive. Over half (56%) rated the explanation as excellent (12%) or good (44%), with 34% rating it as fair. Around one in ten in affected areas rated the explanation as poor (6%) or very poor (3%). This pattern was consistent across regions, with no statistically significant differences.
Figure 2.11: Quality of the explanation provided about TUB in their local area
Q24. How would you rate the quality of the explanation you received about the hosepipe ban in your local area? All in affected areas who received information about ban (291)
| Quality | Excellent | Good | Fair | Poor | Very poor | Total |
|---|---|---|---|---|---|---|
| Affected area | 12% | 44% | 34% | 6% | 3% | 100% |
Respondents who experienced a hosepipe ban in their local area were asked how the ban impacted their daily life and activities. For those in affected areas, almost four in ten reported no impact (37%), with the same proportion experiencing a minor impact (43%). Around one-fifth said there had been a moderate impact (17%), whilst only 3% reported a major impact. Overall, the majority of respondents in affected areas (80%) experienced only a minor impact on their daily activities or no disruption from the TUB in their local area in 2025.
Figure 2.12: Self-reported impact of ban on daily life and activities
Q30. How did the ban impact your daily life and activities, if at all? All in affected areas who recall experiencing a ban in 2025 (475)
| Category | Reported impact |
|---|---|
| No impact on my daily life and activities | 37% |
| Minor impact – a few small inconveniences but I adapted easily | 43% |
| Moderate impact – several noticeable changes to my routine and some extra effort or time | 17% |
| Major impact – substantial disruption and very difficult to adjust | 3% |
2.7 Levels of support for TUBs when water levels fall
Respondents were asked how much they support or oppose TUBs when water levels fall. Two‑thirds (66%) supported hosepipe bans overall (24% strongly, 42% tend to), while 10% opposed (7% tend to, 3% strongly). Among those in areas that experienced a ban in 2025, support remained high at 61% (17% strongly, 44% tend to), and opposition was higher than in the overall sample – 14% vs 10% – but still a minority.
Figure 2.13: Level of support for TUBs
Q29. To what extent do you support or oppose hosepipe bans when water levels fall? All respondents (2,100); All in affected areas (564)
| Response | Strongly support | Tend to support | Neither support nor oppose | Tend to oppose | Strongly oppose | Don’t know | Total |
|---|---|---|---|---|---|---|---|
| Total | 24% | 42% | 22% | 7% | 3% | 3% | 100% |
| Affected area | 17% | 44% | 22% | 10% | 4% | 3% | 100% |
In the focus groups, participants generally supported TUBs, though not unconditionally and sometimes reluctantly. Support was strongest when the rationale was clear and tangible. It fell when the case felt unconvincing – for example, when heatwaves did not seem severe, local water levels were not visibly falling, or the UK’s typically wet climate made restrictions feel unnecessary.
“We live in England. At some point it’s going to rain. So, is it really necessary?” (Male, lives in 2025 ban area, garden)
“I think the frustration is you think, I seem to be paying a lot for what I’m actually using. And Doncaster is quite a wet area, it seems to be, you know, water is plentiful. So why, why is there a ban?” (Male, lives in 2025 ban area, garden)
Metered customers were more actively monitoring their water usage and had a stronger awareness of water use. For some customers, the water meter served as a behavioural nudge prompting use of water-saving devices and outdoor substitutes like water butts. Non-metered households were less engaged with consumption monitoring and more likely to feel aggrieved by restrictions on a service they pay for. As such households with a water meter were more likely to comply willingly. Those without meters accepted bans more grudgingly, and were more likely to comply through enforcement and fines rather than genuine buy-in.
“I don’t think I’d be on board with it. I’ve got so many questions that are just making me more and more frustrated with the whole idea of a hosepipe ban.” (Male, no previous ban, garden)
“I wouldn’t risk getting a fine … if I’ve been told there’s a hosepipe ban, then I’m going to comply with it.” (Female, no previous ban, garden)
A lack of trust in water companies undermined some residents’ willingness to support bans. This was a consistent theme across most discussions: participants felt companies should invest more in infrastructure and future‑proofing the water supply, which they believed would reduce the need for bans.
“They’ve just ramped up the water bills so much. But they’re not doing anything to the infrastructure. We’re still getting bursts all over the place. They don’t actually touch it, they just take more and more” (Male, lives in 2025 ban area, garden)
“The water companies are obviously geared up to maximise their profits, so I think that’s where the problem is, where they’re not investing in future proofing” (Male, lives in 2025 ban area, no garden)
Participants understood that they should play their part in trying to conserve water in order to save water for general usage. However, they did not tend to feel the burden should be placed on residents solely and would like to see water companies doing more to try and conserve water before a temporary usage ban comes into force. For example, they would like to see water companies conserving more water during wetter seasons and fixing more leaks to ensure less water waste. It was felt this would ensure a more consistent water supply throughout the year and reduce both the need for bans and how long they last.
“What measures have they already put in place? What are they doing about all the leaks and spills that are happening everywhere? Why, why are we as the consumer now having to sacrifice using water?” (Female, no previous ban, garden)
Conserving water for environmental reasons was a key driver of support, but it was not always a link that was made.
“Because some people might not realise that it’s going to have an environmental impact” (Male, no previous ban, garden)
“I was completely unaware of that, so I’ve learned that … I hadn’t realised that we took from the [rivers], and I’m pretty, pretty angry about that. But then hearing about how our water’s being polluted as well has also, you know, upset me as well.” (Female, no previous ban, garden)
“It’s like if we’re doing our bit, I’d really want to know what they’re actually doing for the environment.” (Male, no previous ban, no garden)
Families with gardens often found bans challenging, as they spent more time outdoors with children in hot weather and wanted to fill paddling pools or use water for play. One participant, who had not previously experienced a ban and had children with special educational needs, said they would be unlikely to support or comply with a ban, citing their children’s needs during hot weather.
“If you want me to be honest, I would have just carried on with my life using the water that I wanted to use. Wouldn’t have listened to no hosepipe ban.” (Female, no previous ban, garden)
Those with water meters tended to be more informed about the practical adaptations for a TUB. For instance, they cited switching to stored water, using watering cans and manual methods. They referenced meter feedback helping them to track their efforts, and some said incentives related to their usage (such as credits) would be potentially motivating. However, households with no meter were not as well informed on how they could adapt and change their behaviour, and the threat of fines rather than positive motivation drove any likely behaviour change.
“If there were incentives to use water at certain times of the day, or they got some more advice on cutting down their bills, then that would be really helpful.” (Female, no previous ban, garden)
“If you get threatened with a fine, you don’t know who’s watching you.” (Male, lives in 2025 ban area, garden)
“I don’t think I would ever risk it. I would comply.” (Female, no previous ban, garden)
Those without prior experience of a ban found it hard to visualise changing their outdoor water use. In contrast, participants who had experienced a ban said most people in their communities complied, and that clear warnings and the prospect of fines helped drive behaviour change.
3. Acceptable frequency, timing, and perceived fairness of TUBs
This section examines public expectations and acceptability of TUBs, including how often bans were expected over the next five years, what frequency and duration were considered acceptable if needed, and in which seasons a ban would be acceptable. It also assesses perceived fairness across specific scenarios and the preferred order in which different users should face restrictions during shortages. Focus groups explored when bans felt justified, what actions participants expected water companies to take first and what approaches to enforcement were seen as fair and effective.
Key findings
- Respondents from affected areas by a TUB 2025 were far more likely to expect a ban every year in the next five years (43% vs 21% overall), support yearly bans (43% vs 37%) and were more accepting of longer ban durations.
- A summer ban was acceptable to 53%, and around one-third said a ban is acceptable in any season if supplies are at risk. However, acceptance for bans exclusively in spring, autumn or winter was low (6% to 7%) and did not differ between affected and non‑affected areas.
- Farmers using water stored from winter to irrigate crops was seen as fair by 71%. Focus group participants felt that farmers should be the first to be given exemptions as water is needed for the welfare of livestock and the provision of food, both of which are essential.
- Nearly half (47%) felt it was unfair to ask households to cut back before water companies take visible steps. This was a strong and consistent theme throughout all the focus group discussions.
- Leisure and sport’s use of water was seen as non-essential and therefore a legitimate target for a ban. But there were caveats. As with businesses it was felt that use should mostly be exempted if there would be an economic implication or it might put jobs at risk.
3.1 Expectations of TUB frequency over the next five years
Respondents were asked to estimate in how many of the next five years they expected a TUB to be introduced in their area. Overall, 21% expected a ban every year. Expectations were higher in areas covered by a 2025 TUB: 43% expected a ban every year, compared with 16% in non‑affected areas. Only 1% in affected areas thought a ban would never occur, compared with 8% in non‑affected areas (6% overall). Uncertainty was also lower in affected areas: 15% chose “don’t know,” versus 23% overall. Overall, the survey indicated that previous exposure to water shortages significantly heightened the public’s expectation that such bans would become a persistent, annual reality.
Figure 3.1: Expectations of TUB frequency
Q33. Thinking about the next five years, in how many of those years do you expect there to be a hosepipe ban for households in the area where you live at any time, even for a short period? Please count a year if a ban happens at any point in that year. If more than one ban happens in the same year, still count that as one year. All respondents (2,100); All in affected areas (564)
| Response | Total | Affected area |
|---|---|---|
| Never | 6% | 1% |
| 1 year | 10% | 7% |
| 2 years | 18% | 13% |
| 3 years | 15% | 12% |
| 4 years | 6% | 8% |
| 5 years | 21% | 43% |
| Don’t know | 23% | 15% |
The expected frequency of TUBs did not differ between households with a water meter and those without one. However, those with a smart water meter reported higher expectation for bans in the next two years (23%) and three years (18%), compared to those with a traditional water meter (17% and 14% respectively).
Regional differences emerged in expectations about TUB frequency. Residents in the South East and Yorkshire and the Humber were most likely to expect a ban every year over the next five years (41% and 33% respectively). By contrast, the North East had the highest share who never expect a ban (25%). The East of England stood out for expecting bans in three of the next five years (21%), a significantly higher proportion than most other regions (North West 13%, Yorkshire and the Humber 13%, South West 10%, South East 14%).
3.2 Perceived acceptable frequency and duration of TUBs
Respondents were asked how frequently they would find it acceptable for a TUB to be introduced in their local area if required. More than one third (37%) of all respondents supported a yearly ban and the support rose to 43% among those living in areas affected by such bans in 2025. While a significant proportion of the total sample (25%) would accept the restrictions more than once a year, this dropped to 19% in TUB affected areas. Only a small minority of the population (5% overall and 6% for those in affected areas) believed that TUBs should never be introduced, suggesting overall support for bans.
Figure 3.2: Perceived acceptable frequency of TUBs
Q34. How often, if needed, do you think it would be acceptable for a hosepipe ban for households to be introduced in your area? All respondents (2,100); All in affected areas (564)
| Response | Total | Affected area |
|---|---|---|
| Never | 5% | 6% |
| No more than once every ten years | 3% | 3% |
| No more than once every five years | 6% | 6% |
| No more than once every two years | 11% | 13% |
| Once a year if needed | 37% | 43% |
| More than once a year if needed | 25% | 19% |
| Don’t know | 12% | 10% |
Females were more open to a once‑a‑year ban than males (42% vs 33%). Acceptance was also higher among people in areas affected by a 2025 ban (43% vs 36% in non‑affected areas). The same pattern holds by self-reported experience: 44% of those who said their area had a TUB in 2025 support a once‑a‑year ban, versus 37% who said it did not. Those in non-affected areas were more likely to accept bans happening more than once a year if needed, compared to residents of TUB-affected areas (26% vs 19%). People with outdoor space were more willing to accept a once‑a‑year ban than those without (38% vs 24%). Once-a-year ban acceptance was also higher among metered households (40% vs 32% non‑metered).
Additionally, the survey examined the maximum duration of a hosepipe ban that respondents deemed acceptable during a water shortage. Overall, the most supported timeframe was two to four weeks (21%), but there was a notable split in sentiment regarding extended durations. Respondents in TUB-affected areas exhibited a higher level of acceptance for long-term restrictions, with 27% finding a duration of more than three months acceptable, compared to only 20% overall. Furthermore, while 13% of the general public supported bans lasting less than two weeks, only 4% of those in TUB-affected areas shared this view. These results suggested that while the general public prefers shorter windows of restriction, people in affected areas are more resigned to, or accepting of, much longer durations to manage water resources effectively.
Figure 3.3: Perceived acceptable duration of TUBs
Q35. When a hosepipe ban is in place, what is the longest duration you think is acceptable, if needed? All respondents (2,100); All in affected areas (564)
| Response | Total | Affected area |
|---|---|---|
| Not acceptable at any duration | 4% | 5% |
| Less than two weeks | 13% | 4% |
| Two to four weeks | 21% | 18% |
| One to two months | 18% | 17% |
| Two to three months | 12% | 19% |
| Longer than three months if needed | 20% | 27% |
| Don’t know | 12% | 11% |
Subgroup patterns for acceptable duration mirrored those for acceptable frequency. People who had experienced a ban in 2025 were more willing to accept longer periods: 19% would accept two to three months (vs 10% among those without experience) and 27% would accept more than three months (vs 18%). By contrast, those with no prior experience tended to favour shorter durations of up to two to four weeks. Metered households were also more accepting of longer bans than non‑metered households: 20% were comfortable with one to two months (vs 15%), and 13% with two to three months (vs 9%). Younger respondents showed lower tolerance for duration, with 48% saying the maximum acceptable length was up to four weeks. In contrast, 29% of those aged 55+ would accept three months or more (vs 8% of 18-34s and 18% of 35-54s).
3.3 Seasonal acceptability of TUBs
Acceptability of TUBs varied notably by season. Unsurprisingly, a ban during summer was acceptable to more than half of the respondents (53%) and one-third of respondents agreed that a ban was acceptable in any season if water supplies were at risk, indicating a needs‑based rather than seasonal view. Less than one in ten of the general public considered a ban acceptable only during the remaining seasons (6% in Spring, 7% in Autumn, 7% in winter) and this pattern did not differ between TUB-affected and non-affected areas.
Figure 3.4: Seasonal acceptability of TUBs
Q36. During which seasons do you think it is acceptable for a hosepipe ban to be in place? All respondents (2,100); All in affected areas (564)
| Response | Total | Affected area |
|---|---|---|
| Spring | 6% | 6% |
| Summer | 53% | 52% |
| Autumn | 7% | 11% |
| Winter | 7% | 6% |
| Any season if water supplies are at risk | 35% | 34% |
| Don’t know | 5% | 5% |
Only small demographic differences were observed about seasonal acceptability. Younger adults (18-34) were more willing to accept bans in winter (13%) than those aged 35-54 (8%) and 55+ (1%). Women were slightly more likely than men to accept a ban in any season if supplies were at risk (38% vs 31%). People in areas affected by a 2025 ban were also more willing to accept bans in autumn (11% vs 7% in non‑affected areas). Smart‑meter households were more open to winter bans (10%) but were less likely to support bans “in any season if needed” (29%).
In the group discussions residents complained that TUBs often lasted too long, which they found hard to support or fathom. Some reported bans in their areas not ending until January. This was a significant pain point, seen as excessive and not well communicated.
“I mean, if it was just a month or something like that, then fine, but 5 months is excessive.” (Male, lives in 2025 ban area, garden)
“All of Yorkshire had a hosepipe ban from July, and I think it was just lifted before Christmas. Not particularly that we had a massive heatwave. We had a few days of specifically quite warm weather that I was kind of perplexed why the ban was in so long because we actually had quite a few days of wet weather. But I just think it’s down to all the holes and stuff that they don’t seem to fit.” (Male, lives in 2025 ban area, garden)
3.4 Perceived fairness of various TUB scenarios
Respondents were asked about the perceived fairness of different potential scenarios about hosepipe bans. The highest level of support (71% “Fair” or “Very fair”) was directed toward farmers irrigating crops by using water stored from winter. Conversely, respondents were less accepting of when businesses like golf courses or car washes continued to operate while households were restricted, a scenario deemed “Unfair” or “Very Unfair” by 53% of respondents. Nearly half (47%) of the general public felt it was unfair for water companies to request consumer cutbacks before the companies have taken visible action themselves. Overall, the public was more willing to accept TUBs when the alternative use is perceived as essential, such as food production, or when it utilises sustainable sources like recycled or stored water.
Figure 3.5: Perceived fairness of TUB scenarios
Q37. In your opinion, to what extent do you think these statements about potential situations regarding hosepipe bans are fair or unfair? All respondents (2,100)
| Response | Very fair | Fair | Neither fair nor unfair | Unfair | Very unfair | Don’t know | Total |
|---|---|---|---|---|---|---|---|
| Households are under a hosepipe ban while farmers irrigate crops using water stored from winter | 27% | 44% | 16% | 6% | 2% | 5% | 100% |
| A hosepipe ban restricts only certain non‑essential outdoor hosepipe or sprinkler uses, not all water use | 22% | 43% | 19% | 9% | 2% | 6% | 100% |
| Households are under a hosepipe ban while a golf course waters its greens at night using recycled or stored water | 15% | 40% | 17% | 12% | 12% | 4% | 100% |
| Water companies ask customers to reduce their use before the company has taken visible steps itself | 11% | 24% | 13% | 26% | 21% | 4% | 100% |
| There is no hosepipe ban for households while farmers are temporarily banned from taking water from the environment for spray irrigation | 5% | 15% | 20% | 35% | 15% | 11% | 100% |
| Households are under a hosepipe ban while some businesses continue operating | 4% | 18% | 21% | 33% | 20% | 4% | 100% |
Those with direct experience of bans viewed fairness differently. People in ban‑affected areas were more likely than those in non‑affected areas to view it as unfair when water companies asked customers to cut back before taking visible steps themselves (55% vs 45% in non-affected areas) and when farmers are temporarily banned from taking water from the environment for spray irrigation (55% vs 48% in non-affected areas). Moreover, they were more likely to report a scenario where households are under a hosepipe ban while farmers irrigate crops using water stored from winter as fair, compared to non-affected residents (77% vs 69%).
Older respondents (55+) were more accepting of household restrictions when farmers had planned ahead by storing winter water (78% vs 60% among 18-34s). Women were more likely than men to accept household restrictions when farmers used stored water (73% vs 68%) and when bans targeted only certain non‑essential uses (68% vs 60%).
Overall, acceptance tended to be higher when there was evidence of planning and when restrictions focused on non‑essential uses.
3.5 Prioritisation of water use restrictions across different users
Respondents were asked to rank eight categories of water users to determine the order in which restrictions should be applied, using a scale from 1 (restricted first) to 8 (restricted last). An average score was calculated for each statement, with smaller average score meaning the user should be restricted first and higher average score meaning the user should be restricted with lower priority. Respondents indicated a clear preference for prioritising food production during water shortages, identifying crop farmers (6.67) and livestock farmers (6.51) as the groups that should be restricted last. In contrast, recreational and leisure-based water uses were viewed as the most appropriate targets for early restrictions; sport pitches and grounds received the lowest average score (2.98), followed closely by the leisure and hospitality sector (3.14) and public green spaces (3.31).
The data also reveals a distinct middle-tier for essential infrastructure and daily life. Small businesses (4.93) were deemed more essential to protect than large industrial users (4.36) and domestic households (4.09). Overall, there was a strong public mandate to maintain agricultural stability and small-scale commerce at the expense of recreational and ornamental water use when resources are limited.
Figure 3.6: Average score of prioritisation of water use restrictions
Q38. In what order do you think water use restrictions (not only hosepipe bans) should be applied to different users during water shortages? Please rank the following from 1 to 8, where 1 = should be restricted first and 8 = should be restricted last. All respondents (2,100), Average score
| Response | Average score of each group |
|---|---|
| Sport pitches and grounds | 2.98 |
| Leisure and hospitality (such as hotels, golf courses, holiday parks) | 3.14 |
| Public parks, gardens, and green spaces | 3.31 |
| Households (domestic homes) | 4.09 |
| Large businesses or industrial users (such as factories, manufacturing) | 4.36 |
| Small businesses (such as shops, offices, restaurants) | 4.93 |
| Livestock farmers (such as dairy or beef cattle, sheep, pigs, poultry) | 6.51 |
| Crop farmers (arable) – farmers growing crops | 6.67 |
Overall, the ranking order was broadly similar between respondents in areas affected by a TUB in 2025 and those in non‑affected areas, but a few statistically significant differences emerged.
In the focus groups, farmers were seen as essentially off-limits for restrictions. Participants strongly felt that farming must be protected to safeguard livelihoods and the food supply. There was a general view that restricting farmers would cause disproportionate harm. They were seen as among the last who should face restrictions.
“I don’t believe the farmers would be wasting it. I think probably out of that, that’s one of the most essential and they’re probably the most respectful of water use … They only use what they need to” (Male, lives in 2025 ban area, garden)
“They do need the water. You can’t, you can’t deny them that because it will kill their livelihood, it will affect the food chain” (Male, lives in 2025 ban area, garden)
Participants felt it was difficult to impose uniform limits on businesses, large or small, because water needs and usage vary widely across sectors. They favoured a proportionate, evidence‑led approach that targets the biggest users first. A key concern was avoiding job losses or wider economic harm, especially for small firms already under pressure. As a result, there was stronger support for targeted measures rather than blanket restrictions.
“If you went for any of the other ones, like for example agriculture, or for small businesses who are a lot of them already on the floor, not only are you going to basically make their life hard, you could be quite catastrophic in the outcome of that.” (Male, lives in 2025 ban area, no garden)
Participants accepted that households can and should save water. But sometimes this acceptance is begrudging and did not always feel fair.
“I use the hose, I water the plants, and then I put the hose away. I don’t just leave it running in the garden. I don’t use a sprinkler or anything like that. And yet I’m being penalised and being told I can’t wash my car or things like that because there’s a hosepipe ban where ‘Actually, I’m not wasting water, I’m just using what I feel like I need to use and what I’m paying to use.’ But instead, I’ve got to go to a car wash and pay a tenner to wash my car instead of paying the £2 for the water I’ve already got at home available to me.” (Male, lives in 2025 ban area, garden)
There was some support for restricting high‑water‑use equipment, especially sprinklers. Views were mixed on hot tubs and pools: some participants argued they may be filled once (sometimes before a ban) and therefore not heavy users day‑to‑day, while others noted they often need topping up and are seen as inappropriate during a ban, risking disapproval from neighbours.
“We have a hot tub back home, and we have the same water in there the whole entire summer. We only have it on the summer because it’s so expensive to keep it all year round, but in the summer we fill it up once and we just maintain it with like cleaning products and that’s it for the summer. So you don’t actually use that much water.” (Male, no previous ban, no garden)
Public parks, green spaces, and decorative features (like fountains) were widely viewed as non-essential and appropriate early targets for restrictions. There was little support for maintaining aesthetic water use when supplies were under pressure.
“Leisure, hospitality, households, and public parks and green spaces. For me, in, in that context, the easiest ones to manage because they’re all like, they’re luxury, they’re bonus, they’re not necessarily essential.” (Male, lives in 2025 ban area, no garden)
Swimming pools, hot tubs, paddling pools, and golf courses were seen as discretionary and high-use, making them acceptable priority to be early targets. Participants generally expected leisure and hospitality businesses to face restrictions before essential uses were touched.
Sports grounds were broadly seen as non-essential, but participants want nuance here. They were more supportive of protecting by giving professional or economically significant sports which depend on maintained pitches an exemption. Some focus group participants did not think amateur sports should be given the same exceptions.
“You can still play football on dry grass.” (Male, lives in 2025 ban area, garden)
“Households can cut down easier, and I think maybe sports pitches and grounds can cut down their water uses easier than anything else.” (Female, no previous ban, garden)
4. Acceptability of alternative methods and scope of restrictions
This section examines public acceptability of measures to use before or instead of a TUB and support for longer‑term investments to reduce future bans. It also looks at willingness to pay extra on water bills to fund measures that would reduce the likelihood of TUBs in their area. Focus groups also explored what steps should be used instead of full bans, their perceived fairness and feasibility and how participants would prioritise restrictions across sectors and within households.
Key findings
- Preference for enhanced public messaging and temporary bans on specific high-use appliances received high levels of support (80% each) among respondents as alternative measures to TUBs.
- The support for long-term investments aimed at reducing the necessity for TUBs in the future showed clear public support toward improvements in water recycling and reuse systems (86%) and infrastructure investment (accelerated leak reduction by water companies and government investment in agriculture water storage, 84% each).
4.1 Acceptability of alternative measures to TUBs
The survey explored several alternative measures to TUBs, with enhanced public messaging and appeals receiving support from 80% of respondents, indicating a strong public preference for strategies that increased awareness and comprehension of water conservation needs. Other commonly preferred alternatives to TUBs included temporary bans on specific high‑use appliances (80%). Temporary restrictions on non-essential water use by businesses and industries were supported by 76% of respondents. These findings underscore the public’s endorsement of industry accountability during water shortages. Personalised messages to high-use households, was supported by 76% of the public. Incentive-based approaches, like bill refunds or credits if water consumption targets or reservoir levels are met, were supported by 71% of respondents. Reducing water pressure was supported by 56% and donations to local charities based on regional water savings by 54%. Lastly, measures related to temporary water price adjustments were less favoured, with only 32% approval of temporary higher water prices at peak times and 42% in favour of temporary higher prices for excessive household usage.
Figure 4.1: Alternative measures to TUBs
Q39. Thinking about measures that could be used instead of, or before, a full hosepipe ban during a drought, how acceptable or unacceptable are the following? Base: All respondents (2,100)
| Response | Very acceptable | Fairly acceptable | Neither acceptable nor unacceptable | Fairly unacceptable | Very unacceptable | Don’t know | Total |
|---|---|---|---|---|---|---|---|
| Temporary ban on specific high‑use appliances | 43% | 37% | 12% | 4% | 3% | 2% | 100% |
| Public messaging asking households to cut water use | 40% | 40% | 14% | 2% | 1% | 3% | 100% |
| Personalised messages to high‑use households | 34% | 42% | 15% | 4% | 2% | 4% | 100% |
| Bill refunds for customers if local area reduces water use | 32% | 40% | 18% | 4% | 2% | 5% | 100% |
| Restrictions on water use by businesses and industries | 28% | 48% | 15% | 5% | 2% | 3% | 100% |
| Donations to local charities if local area reduces water use | 17% | 37% | 28% | 6% | 4% | 7% | 100% |
| Higher water prices for very high household use | 13% | 28% | 17% | 18% | 19% | 4% | 100% |
| Temporarily reduced water pressure | 12% | 43% | 21% | 12% | 5% | 6% | 100% |
| Water prices that are higher in peak season during drought | 9% | 22% | 22% | 22% | 21% | 4% | 100% |
If you view Figure 4.1 as a table, you may need to scroll horizontally to see the full data.
Overall, older adults (55+) generally showed higher acceptance for restrictive measures. Younger adults (18-34) were more likely to support price-based measures. Four in ten (40%) backed temporary higher prices at peak times (vs 33% of 35-54s and 23% of 55+), and half (50%) supported temporary higher prices for very high household use (vs 40% and 36% respectively).
The priority measures highlighted by respondents indicated a preference for direct action that immediately impacts water usage. The most favoured measure was a temporary ban on specific high-use appliances, preferred by 46% of respondents followed by temporary restrictions on non-essential water use by businesses and industries, supported by 36% of respondents.
Figure 4.2: Prioritisation of alternative measures
Q40. If a drought worsens, which two measures should water companies prioritise first? Base: All respondents (2,100)
| Support | |
|---|---|
| Temporary ban on specific high‑use appliances | 46% |
| Restrictions on water use by businesses and industries | 36% |
| Public messaging asking households to cut water use | 21% |
| Temporarily reduced water pressure | 20% |
| Bill refunds for customers if local area reduces water use | 16% |
| Personalised messages to high‑use households | 15% |
| Higher water prices for very high household use | 9% |
| Water prices that are higher in peak season during drought | 6% |
| Donations to local charities if local area reduces water use | 4% |
| Don’t know | 9% |
During the focus groups, proposals that specifically targeted higher usage – such as banning high-use equipment and limiting non-essential business activities – received widespread support. Participants perceived these measures as sensible, easy to justify, and more balanced compared to complete bans.
“In terms of water usage on sprinklers, I know they give you like a really good, lovely lawn, but surely that’s quite a high use of water” (Female, no previous ban, garden)
“I’d maybe say before you, um, they go after the average person, to look at big corporations and target them first. Because I’m sure when it comes to consumption, they’re probably way ahead of the average person that uses water in their household” (Male, no previous ban, garden)
Another practical solution that resonated well with participants was the transition to using stored or recycled water. This approach was regarded as a straightforward and an action that individuals can undertake. Additionally, there was general support for increasing efforts in water recycling overall.
“Recycled water is a brilliant idea because we do so much water that, you know, is not necessarily dirty, it’s just basically gone through a whole filtering process” (Male, lives in 2025 ban area, garden)
“I recycle all the time anyway … So yeah, because people that do use water outdoors don’t want a hosepipe ban. So, I think if they knew that it was getting low, then they probably would – it would make a difference.” (Female, no previous ban, garden)
Personalised water-saving tips for high-usage households and strong messages about conserving water were generally supported in principle. However, participants had questioned the potential effectiveness of these strategies in actually changing behaviour. Similarly, incentives to communities seemed like a good idea, but participants believed they were unlikely to have a significant impact, so they were not prioritised.
Temporary extra charges and peak time surcharges were the least popular proposals. These measures were viewed as punitive and unfair, which could provoke resentment and non-compliance. There was also a prevailing concern that once additional fees were charged, they might never be removed, and this was palpable given the underlying mistrust in water companies.
“I don’t like the idea of there being a higher price. In the summer because they will not lower the price in the winter when there’s loads of water” (Female, no previous ban, garden)
“Passing the cost on to the customer. Looks like you’re being penalised.” (Male, lives in 2025 ban area, garden)
4.2 Levels of support for long-term investments to minimise need for TUBs
Respondents were asked about their support for long-term investments aimed at reducing the necessity for TUBs in the future. Improvements in water recycling and reuse systems received the highest support (86%), closely followed by accelerated leak reduction by water companies (84%) and more investment in water storage and reservoirs with similar support (also 84%). Government investment in agricultural water storage received 77% support. Moderate support was observed for shared public reservoir storage for household water supply and other users including farmers and industry (63%). Smart water metering was favoured by a similar proportion (62%), though this was lower endorsement than other infrastructure improvements. Overall, the findings emphasised a clear public inclination toward infrastructure enhancements and sustainable water use over reliance on technological solutions.
Figure 4.3: Longer-term investments to reduce the need for TUBs
Q41. Thinking about longer‑term investments to reduce the need for hosepipe bans in future, to what extent do you support or oppose the following? Base: All respondents (2,100)
| Response | Strongly support | Tend to support | Neither support nor oppose | Tend to oppose | Strongly oppose | Don’t know | Total |
|---|---|---|---|---|---|---|---|
| Improved water recycling and reuse systems | 54% | 32% | 8% | 2% | 1% | 2% | 100% |
| Accelerated leak reduction by water companies | 62% | 22% | 10% | 3% | 1% | 3% | 100% |
| More investment in water storage and reservoirs | 54% | 29% | 9% | 3% | 1% | 3% | 100% |
| Government investment for agricultural water storage | 40% | 37% | 15% | 3% | 2% | 4% | 100% |
| Shared public reservoir storage | 27% | 36% | 21% | 5% | 2% | 9% | 100% |
| Smart water metering | 28% | 34% | 23% | 7% | 4% | 3% | 100% |
Older adults showed higher acceptance of water management measures. Among those aged 55+, measures such as ‘More investment in water storage and reservoirs’, ‘Improved water recycling and reuse systems’, and ‘Accelerated leak reduction by water companies’ were supported by 92%, 92%, and 94% respectively. Respondents aged 18-34 expressed lower support, with their highest approval for ‘Improved water recycling and reuse systems’ (78%).
4.3 Willingness to pay additional water bill charges to reduce future TUBs
Respondents were asked to consider the potential impact of water company investments, such as leak reduction and new storage, which could halve the likelihood of hosepipe bans. Considering their household budgets, respondents were asked the maximum they would be willing to pay extra annually to achieve this reduction. The majority of respondents (47%) expressed unwillingness to pay anything extra on their water bill each year to achieve a reduction in the likelihood of TUBs. However, 38% of respondents said they would contribute more, with 18% prepared to pay up to £10 annually and another 11% willing to pay between £11 and £20, and 9% more than £20.
Figure 4.4: Willingness to pay extra for reducing likelihood of TUB
Q48. Thinking about your household budget, what is the most you would be willing to pay extra on your water bill each year to achieve this reduction? All respondents (2,100)
| Choice | |
|---|---|
| £0 – I would not be willing to pay anything extra | 47% |
| £1-10 extra per year | 18% |
| £11-£20 extra per year | 11% |
| £21-£30 extra per year | 6% |
| £31-£40 extra per year | 2% |
| More than £50 extra per year | 1% |
| I don’t pay the water bill or it’s included in my rent | 4% |
Younger adults (18-34) were more open to pay extra on their water bill to achieve a reduction in bans. However, one-third of them would not pay any additional amount, while those aged 35-54 and 55+ demonstrated greater reluctance, with 51% and 54% respectively unwilling to pay anything extra.
The majority of participants in the group discussions were unwilling to pay higher bills to prevent TUBs. This proposition provoked a sense of injustice; residents felt it was wrong to be asked to pay more while receiving a restricted service, especially when water companies were seen as both profiteering and under-investing. As outlined before, there was a strong expectation that water companies must first fix leaks and invest in infrastructure before any cost is passed to customers. Many also doubted any bill increase would be temporary, expecting it to become permanent and push bills up across the board.
“I don’t understand why you should have to pay more. Why should one of them says temporary higher prices at the busiest times. Why, why should you have to pay more for the same service?” (Male, lives in 2025 ban area, garden)
“Me personally, it annoys me because when I look at my water bill, went up 30-odd percent in April, and then in July I got told I couldn’t use the water” (Male, lives in 2025 ban area, garden)
“They should be getting to doing all the repairs and all the leaks and, you know, all this, all the money that the bigwigs are getting” (Female, lives in 2025 ban area, garden)
5. Objections and barriers to compliance
This section examines objections and barriers to complying with TUBs. It also covers what people know about enforcement and whether it deters use, the water‑saving actions they said they would take and the challenges to compliance. Focus groups explored barriers, what support would help, willingness to comply and perceived impact, and views on fair enforcement.
Key findings
- Awareness of TUB enforcement was low, with only 4% knowing a lot about how bans are enforced and 63% having limited or no knowledge.
- Enforcement was viewed as a limited deterrent. While 79% said it would deter them at least slightly, just 25% saw it as a strong deterrent (31% in affected areas, and 31% among older adults 55+ and rural residents).
- The primary concern about TUBs was the perception that water companies have not done enough to justify restrictions (47% overall, 58% in affected areas), followed by lack of enforcement (39% overall, 43% in affected areas). Those in affected areas were also significantly more likely to feel bans were introduced too often or last too long (22% vs 14% overall).
- Lack of trust in water companies was the main barrier to compliance (25%), cited much more often by those who oppose bans (46%). Other challenges included the time needed to water by hand (10%), not understanding the rules (9%), and seeing others ignore the ban (8%). These challenges were more commonly reported by respondents in areas that had experienced a ban.
- Most respondents reported positive intentions for drought periods: 60% said they would comply with a TUB, 55% would turn off the tap when brushing their teeth, and 47% would take shorter showers and 47% would use a water butt. Older adults, rural residents, and those who support bans were most likely to say they would comply.
5.1 Awareness of and attitudes towards TUB enforcement
Respondents were asked how much they knew about how water companies can enforce hosepipe bans for households. Only a small proportion (4%) reported knowing a lot about how bans are enforced. Around a quarter knew a little about enforcement (26%), whilst approximately a third (34%) had heard of enforcement but did not know the details. A similar proportion knew nothing about how bans are enforced (29%). Overall, six in ten respondents (63%) had limited or no knowledge of enforcement processes.
Figure 5.1: Awareness towards TUB enforcement
Q42. How much, if anything, do you know about how water companies can enforce hosepipe bans for households? All respondents (2,100)
| Total | |
|---|---|
| I know a lot about how bans are enforced | 4% |
| I know a little about how bans are enforced | 26% |
| I have heard of enforcement but don’t know the details | 34% |
| I know nothing about how bans are enforced | 29% |
| Don’t know | 7% |
Knowledge of enforcement was limited overall. Older adults (55+) were more likely to have heard of enforcement but not know the details (38% vs 34% overall). The least informed were those unfamiliar with TUBs (45% knew nothing) and people without outdoor space (44%).
Respondents were asked how much the possibility of enforcement would deter them from using a hosepipe during a ban. Most said it would deter them to some degree: 25% saw it as a strong deterrent, 32% as a moderate deterrent, and 22% as a slight deterrent; only 8% said it was not a deterrent at all. In areas affected by a ban, 31% saw enforcement as a strong deterrent but 11% said it was not a deterrent at all.
Figure 5.2: Attitudes towards TUB enforcement
Q43. To what extent, if at all, does the possibility of enforcement act as a deterrent to you using a hosepipe during a ban? All respondents (2,100); All in affected areas (564)
| Response | Total | Affected area |
|---|---|---|
| A strong deterrent | 25% | 31% |
| A moderate deterrent | 32% | 30% |
| A slight deterrent | 22% | 19% |
| Not a deterrent at all | 8% | 11% |
| Don’t know | 13% | 10% |
Perceptions of enforcement as a deterrent varied by subgroup. Older adults (55+) and rural residents were more likely to see it as a strong deterrent (31% each, vs 25% overall). Greater London residents and smart‑meter households were more likely to see it as a moderate deterrent (40% and 37%).
5.2 Key concerns about TUBs and practical challenges to compliance
Respondents were asked what concerns, if any, they have about hosepipe bans. Nearly half of all respondents felt that water companies had not done enough, such as fixing leaks or investing in infrastructure, to justify asking customers to cut back (47%) with this view held more strongly amongst those in areas affected by a TUB in 2025 (58%). Lack of enforcement was the second most cited concern (39% overall; 40% in affected areas). Fewer respondents expressed concern about bans not accounting for individual needs or circumstances, including health or disability (22% overall and 24% in affected areas), or about damage to gardens, lawns or plants (19% for both). Moreover, those in affected areas were significantly more likely to feel that bans are introduced too often or last too long (22% vs 14% overall).
Figure 5.3: Concerns about TUBs
Q45. What concerns, if any, do you have about hosepipe bans? All respondents (2,100); All in affected areas (564)
| Q45 | Total | Affected area |
|---|---|---|
| Water companies haven’t done enough to ask customers to cut back | 47% | 58% |
| Not enough enforcement, so some people ignore the bans | 39% | 40% |
| Doesn’t take account of individual needs or circumstances | 22% | 24% |
| Damage to gardens, lawns or plants | 19% | 19% |
| Not applied fairly across groups | 18% | 15% |
| Difficulty caring for pets or wildlife | 17% | 15% |
| Rules can be confusing | 15% | 12% |
| I pay for my water, so I should be able to use it as I wish | 15% | 19% |
| They are introduced too often or last too long | 14% | 22% |
| Not enough notice or clear explanation | 13% | 11% |
| They don’t make a meaningful difference to water supplies | 10% | 9% |
| Harder to keep property, cars or other vehicles clean | 8% | 8% |
| Other | 2% | 2% |
| I have no concerns about hosepipe bans | 15% | 11% |
| Don’t know | 4% | 4% |
Concerns differed across the main sub-groups. Older adults (55+) were more likely to say water companies had not done enough to justify restrictions (58%) and that enforcement was insufficient (58%). The view that companies had not done enough was also more common among South East residents (56%), smart‑meter households (55%), rural residents (54%), those who experienced a ban in 2025 (58%), and residents of Yorkshire and the Humber (52%). Rural residents were also more likely to worry about a lack of enforcement (46%). Younger adults and those in social grade AB were more likely to be concerned about damage to gardens, lawns or plants (23% and 24%, vs 19% overall).
Respondents who had a hosepipe in their household were asked which reasons or practical challenges, if any, would make it difficult for them to comply with a hosepipe ban. The most common barrier was a lack of trust that water companies have done enough before asking customers to reduce their usage (25%). One in ten (10%) felt hand watering was too time-consuming. Similar proportions reported not understanding which activities would be restricted (9%), seeing others ignore the ban (8%), difficulty carrying water cans or buckets (8%) and having a large garden that needs a hosepipe to maintain (8%).
Figure 5.4: Practical challenges to compliance
Q47. Which of the following reasons or practical challenges, if any, would make it difficult for you to comply with a hosepipe ban? All who own a hosepipe (1,293)
| Total | |
|---|---|
| I do not trust that water companies have done enough before asking customers to reduce use | 25% |
| Watering my garden by hand takes too much time | 10% |
| Not understanding what activities would be restricted | 9% |
| I am physically unable to carry watering cans or buckets | 8% |
| I have a large garden that cannot be maintained without a hosepipe | 8% |
| I see other people ignoring the ban, so I do not see why I should comply | 8% |
| I have pets or livestock that need outdoor water facilities | 5% |
| I do not have a watering can or other alternative equipment | 3% |
| I run a small business from home that requires water use | 3% |
| I rely on automated irrigation systems that I cannot easily turn off | 2% |
Challenges to compliance varied notably across the main subgroups. Those who opposed hosepipe bans were far more likely to cite low trust in water companies (46%) and to point to others ignoring the rules (14%). People in areas affected by a ban in 2025 were also more likely to report lack of trust (30%). London residents were more likely to say watering by hand was too time‑consuming (17%). Younger adults (18-34) more often said the rules were unclear (16%). Having a large garden was cited more by social grade AB (12%) as a barrier.
5.3 Likely behaviours in response to TUBs during droughts
Respondents were asked which actions they would take during a drought if a TUB were introduced locally. The most common intended action was to comply with the ban (60%). Over half (55%) said they would turn off the tap while brushing their teeth. Equal proportions (47%) said they would take shorter showers and use a water butt or bucket to collect rainwater.
Figure 5.5: Likely behaviour in response to TUBs during droughts: overall
Q46. During a drought, and if a hosepipe ban were introduced in your area, which of the following would you be likely to do? All respondents (2,100)
| Response | |
|---|---|
| Abiding by hosepipe bans in effect in my area | 60% |
| Turning off the taps while brushing your teeth | 55% |
| Taking shorter showers | 47% |
| Using a water butt or bucket to collect any rainwater | 47% |
| Avoiding flushing the toilet after every use | 37% |
| Encouraging others to save water | 30% |
| Collecting water from showers or washing up to water the garden | 28% |
| Washing clothes less frequently | 26% |
| Reusing bath water for other purposes (like watering plants) | 25% |
| Stopping or reducing using a dishwasher | 20% |
| Sharing bath water with other members of your household | 10% |
| None of these | 6% |
| Don’t know | 4% |
Intended behaviours varied across subgroups. Older adults (55+) were more likely to say they would comply with the ban (72%), turn off the tap while brushing their teeth (63%), take shorter showers (52%) and use a water butt to collect rainwater (58%). Rural residents also showed higher intentions to comply (70%) and to collect rainwater (59%). Women were more likely than men to turn off the tap while brushing (61%) and take shorter showers (51%). Supporters of hosepipe bans were more likely to report all four actions: comply (69%), turn off the tap (62%), take shorter showers (54%) and use a water butt (51%). Differences in behaviour were observed based on water meter usage. Users of any type of water meter were more likely to comply (62%), collect water from rain (50%) and from showers or washing up (30%). Among this group, those with a traditional but not a smart meter were more likely to say they would comply (72%), turn off the tap (61%) and collect rainwater (57%).
In the focus groups, prior experience sometimes led to reluctant compliance rather than motivated behaviour change. Many who had been through a ban said little changed because their outdoor use was already low. Where changes did occur, they were practical substitutions – watering cans, water butts, and hand‑washing.
“I conserve my water in great big barrels, so, so I can use it to water my garden.” (Female, no previous ban, garden)
“I did water the plants with just from the tap, you know, took a jug outside” (Female, lives in 2025 ban area, garden)
Participants without prior ban experience were less cynical about a ban taking effect, but they were also less informed and less prepared. Many struggled to picture how they would change their behaviour. However, once they understood that compliance often becomes the local norm and that warnings and fines may apply, they said they would be more likely to change their outdoor water use.
“I would sort of see what the neighbours are doing as well, you know. So if, if they were using water, then, you know, I would use it as well.” (Female, no previous ban, garden)
“I wouldn’t be happy about it, but I’d adhere to it.” (Female, no previous ban, garden)
“I think Yorkshire Water put out an advert saying, look, drive about with a mucky car, it’s going to rain again. You know, let your grass go a bit yellow, it’s going to rain again. So, it was more like, just be patient and you know, for August, you know, you’re probably not going to wash your car, you’re not going to wash your patio, for example” (Male, lives in 2025 ban area, garden)
“I would stop washing my car at home … and go and take it somewhere and pay for it to be washed.” (Female, lives in 2025 ban area, garden).
6. TUB communication strategies
This section explores how households prefer to receive information about TUBs in their area. It also summarises focus group findings from testing real communications from water companies – how clear and credible they were, whether they would prompt behaviour change, and which organisations are most trusted to announce a ban.
Key findings
- Preference for receiving messages about TUBs centred on direct, addressed contact from the water company (51%), followed by TV news (47%). Other more traditional channels (leaflets 36%, radio 30%, website 24%) were more popular than social media (posts 16%, ads 13%, video 7%).
- There were some clear guiding principles for any messaging around TUBs. It is important to strike the right tone and language given water consumers’ mistrust of water companies. It needs to be clear, succinct, and honest. Communications materials should tell consumers what is happening, and what they need to do without the reader needing to spend any time on it.
- Consumers demand transparency, and having a joint ‘messenger’ would increase credibility, particularly if it was an organisation such as the Environment Agency.
- Visual formats worked well. Statistics and data were often questioned, which again undermined credibility.
6.1 Preferred channels for TUB communications
Respondents were asked how they would prefer to receive messages about hosepipe bans for households in their area. Most preferred direct, addressed communications (letter or email) from their water company (51%), closely followed by local or national TV news (47%). Other commonly preferred channels included water company leaflets, newsletters or door drops (36%), local or national radio (30%) and water company websites (24%). One in five looked to local authority websites, newsletters or local newspapers (both 20%), with national newspapers slightly lower (18%). Fewer preferred social media – either posts (16%), ads (13%) or online videos (7%) – as well as posters or billboards and word of mouth (both 12%). Fewer respondents pointed to other organisations’ websites or newsletters (9%), online videos (7%), events (7%), or other online groups (5%).
Figure 6.1: Preferred communication channels for TUBs
Q44. How would you prefer to receive messages about hosepipe bans for households in your area? Please select all that apply. Base: All respondents (2,100)
| Total | |
|---|---|
| Water company letter or email | 51% |
| Local or national TV news | 47% |
| Water company leaflet, newsletter, door drop | 36% |
| Local or national radio | 30% |
| Water company website | 24% |
| Local authority websites or newsletters | 20% |
| Local newspaper | 20% |
| National newspaper | 18% |
| Post on social media | 16% |
| Advertising on social media | 13% |
| Posters or billboards | 12% |
| Mentioned by friends, family or neighbours | 12% |
| Website or newsletter from other organisation | 9% |
| Online videos | 7% |
| Events in town centres, country fairs etc. | 7% |
| Other online group | 5% |
| Other | 2% |
| None of these | 2% |
| Don’t know | 5% |
Preferences varied notably by age and gender. Younger adults (18-34) were more open to digital channels, with higher preference for social media posts (20%) and online video (12%), although the proportion was still low overall. In contrast, those aged 55+ strongly favoured traditional, official routes – six in ten preferred addressed letters or emails and TV news (both 60%) – and very few choose social media (11%) or online video (2%). Women were more likely to want a direct letter or email from their water company (56% vs 47% of men), while men were slightly more inclined towards TV news (50% vs 45%) and to websites or newsletters from other organisations (10% vs 7%).
Those living in areas affected by a TUB in 2025 showed a stronger preference for direct, official communications: 59% would like an addressed letter or email from their water company compared with 49% in non-affected areas. Digital and social channels were marginally less popular among those affected, including online video (4% vs 7%). Overall, residents in areas affected by a ban tended to favour authoritative, water-company-led channels over broader or social platforms, compared with those in non-affected areas.
There were some differences by water meter ownership. Respondents who reported using any kind of water meter showed higher preference to be addressed via letter or email by the water company (54%) compared to non-users (46%), as well as via sources such as website and newsletter from other organisations (10% vs 7%). Although the preference for digital sources was still generally lower among water-metered households, those with a smart meter were more inclined to prefer digital sources such as other organisations’ websites or newsletters (13% vs 7%), while those without a smart meter favoured traditional, addressed channels including letters or emails (59% vs 50%), TV news (54% vs 41%), company leaflets or door drops (43% vs 34%) and radio (34% vs 27%).
6.2 The need for clear, actionable information
In the group discussions, participants reviewed a range of materials about TUBs. Full examples are provided in Annex 2. The findings below summarise reactions to these materials.
The discussions surfaced clear design principles for building public support, especially important given low trust in water companies and scepticism about their motives.
Above all, people wanted a simple cause‑and‑effect explanation of why a ban was needed, linking local conditions (such as low reservoir levels, forecast heatwave) to the benefits (protecting supplies and rivers). Messages that made this link obvious at a glance performed best.
“It’s just sort of giving you ‘this is why we’re doing it’.” (Female, no previous ban, garden)
“You don’t want to overpower with too much information.” (Female, lives in 2025 ban area, garden)
Participants wanted clear, actionable messages. They looked for a simple “so what?” and practical next steps (what to do, by when, and where to check details). Vague or clever slogans were off‑putting; people preferred plain, direct instructions.
“It looks like it’s just two very obvious statements, but it needs a third section telling you what to do.” (Male, no previous ban, garden)
6.3 The need for the right tone and language
Participants responded best to an honest, transparent tone that acknowledged the water company’s responsibilities – what had been done already, what was happening next (such as fixing leaks, cutting non‑essential use), and how the company was working to avoid or shorten bans. Messages that showed openness and shared accountability felt fairer and more trustworthy than those focused solely on household behaviour. Participants quickly noticed – and distrusted -communications that seemed to downplay the company’s role or suggest it was not meeting its responsibilities outside the ban.
“There needs to be more transparency from the water companies.” (Female, no previous ban, garden)
“I would respect it a little bit more if it was an independent auditor that looked through their books, just to see if they actually did do that because … they could literally just make up a number and they’re just advertising it, but there’s no one to actually verify that.” (Male, lives in 2025 ban area, no garden)
“Well, if they fix 279 leaks during a hosepipe ban, I suggest you do it when there isn’t a hosepipe ban as well.” (Male, lives in 2025 ban area, garden)
A collaborative, community‑focused tone (“we’re all in this together”) worked best when framed as a shared local challenge rather than a top‑down instruction; this significantly increased buy‑in. However, participants did not feel “in it together” with water companies, whom they generally did not see as fulfilling their side of the bargain (such as fixing leaks, cutting non‑essential use), which limited the credibility of joint‑effort messages.
“I think it would hit home a lot more and kind of emphasise what everyone can do, their little part in saving water.” (Female, lives in 2025 ban area, garden)
“I like that too. Yeah, makes it sound like we’re all together and we’re doing this together.” (Female, lives in 2025 ban area, no garden)
Guilt‑based or directive tones felt patronising and accusatory, and tended to lower willingness to support.
“Just guilt, guilt on every opportunity they get.” (Male, lives in 2025 ban area, garden)
6.4 Linking the need for TUBs with the environment
Communications that linked TUBs to local rivers, reservoirs and wildlife were well received and often strengthened support. Few participants made this connection unprompted, but once discussed it mattered to most.
“Our rivers are very, very important, really important. And there are lots of studies that are being done…seeing how they’re changing, the wildlife’s changing.” (Female, no previous ban, garden)
Participants supported the idea of communications about TUBs coming jointly from the water company and the Environment Agency. Messages from joint or independent public bodies were seen as more credible, especially given low trust in water companies.
“I think the environmental services you would trust because they’re working to preserve the environment.” (Female, no previous ban, garden)
“Everyone in this group, we all sort of felt that the [water companies are] a bit tarnished. [It’s] a bit rich coming from them, whereas if it came from the Environment Agency, I think it’s got a bit more weight to it, and in a way that we can all work together, you know, to help the environment and to save water.” (Male, no previous ban, garden)
6.5 Format preferences
Visual, image‑led formats attracted attention far more than long copy. Long, wordy leaflets appealed only to a small minority who wanted detail; most said they would not read them. Simple, relatable imagery (such as taps, watering cans) communicated the message quickly. Picture‑based “what you can do during a ban” guides were particularly well received. However, the visuals need to feel relevant to everyday homes and gardens; some of the images shown did not.
“When there’s a picture there, it draws the eye more.” (Female, lives in 2025 ban area, no garden)
“The other one, yeah. I like the title, but then there’s – I think there’s just too many words, and I think people wouldn’t read it all.” (Female, lives in 2025 ban area, garden)
“I like the one with the tap because it’s absolutely straightforward and easy” (Female, no previous ban, garden)
Participants did not respond well to dense statistics, technical charts, or abstract metrics. Data‑heavy materials led most to disengage quickly, and the figures often raised more questions than they answered, undermining credibility.
“Yeah, that totally switches me off as well with all maths and stuff like that.” (Female, previous ban, no garden)
“I mean, I did understand after it, after it was lifted, they put the hosepipe ban on because the reservoirs went down to 50%. 50% of what? Could that rest of the 50%, would it have lasted another 3 years?” (Male, lives in 2025 ban area, garden)
Participants advised against gimmicky analogies and vague comparisons. The “100 bottles of pop” example was repeatedly described as patronising, irrelevant and off‑putting, and it lacked meaning because the volume was unclear.
“Patronising, really, you know. 100 bottles of pop. I’d still try to get my head around that, you know. But it’s almost a nice idea to give a comparison and say, as I said, if you do a bathtub full of water, something that we can all relate to. What’s pop got to do with it?” (Male, lives in 2025 ban area, garden)
“I think if you’re going to use the watering can, I agree that 100 bottles of pop, it’s got no meaning because, you know, it could be any size and lots of people will have no idea” (Female, no previous ban, garden)
6.6 Better communications at the end of TUBs
Participants felt water companies communicated the start of bans well but were slow to announce when they ended. This was seen as inconsiderate and further eroded trust and confidence. Many wanted timely, prominent updates and clear review dates.
“Every now and again I’d have a look to see if it was still on, to find that it was. But there’s no details out there as to when we’re taking it off. It’s just out there as to there’s a hosepipe ban” (Male, lives in 2025 ban area, garden)
7. Conclusions
Public awareness of hosepipe bans was moderate and closely tied to local experience. TV news was the main source overall, but in areas under restriction, letters and emails from the water company played a bigger role with targeted messaging. Most understood the broad rules around TUBs: hosepipes, sprinklers and filling pools are typically restricted; watering cans and normal indoor use are allowed. The main grey areas were mains‑fed irrigation and some exemptions. When discussed more fully in the focus groups, there was some confusion about the use of water from indoor sources being able to be used outdoors, particularly among those who have not experienced a ban before or do not have a garden.
Support for TUBs was strong overall and highest when the reason felt clear and local – visible low reservoir levels, heatwaves and a simple explanation of “why now.” Support fell when the case did not feel convincing. Trust in water companies was raised; many wanted to see leaks fixed, the infrastructure being futureproofed, water company’s own non‑essential use cut, and progress evidenced before households were asked to reduce use. Views on fairness hinged on prioritising essentials and planning ahead. Farmers using stored winter water were widely seen as fair, while businesses and leisure operating “as normal” during household restrictions were viewed less favourably. People preferred targeted limits (such as sprinklers, hot tubs) over blanket curbs. Those who had lived through a ban were more accepting of annual and longer bans; summer bans were most acceptable, though around a third said any season is fine if supplies are at risk.
Before or instead of a full ban, the public backed strong save‑water appeals, temporary bans on specific high‑use activities, and time‑limited limits on non‑essential business use. Price‑based tools (peak tariffs or surcharges) were least popular. Looking ahead, there was strong support for long‑term fixes – recycling or reuse, leak reduction and more water storage. However, most were unwilling to pay extra now; people wanted companies to act first and in the focus groups some doubted any bill increase would be temporary.
Most said they would comply with a ban and take simple actions such as turning off the tap while brushing, taking shorter showers and using water butts. Where behaviour changed, it was usually practical substitutions rather than big lifestyle shifts. The main barriers were low trust in companies, the time needed for watering gardens by hand, unclear rules and seeing others ignore the ban. Knowledge of enforcement was low, and while enforcement would deter many at least a little, it was a strong deterrent for only a minority. A common pain point was bans lasting “too long” with slow or unclear updates about when they would end.
Clear, credible communication can help address many of these issues. People preferred direct letters or emails from the water company and trusted TV news; joint messages with the Environment Agency increased confidence. The most effective materials were simple, local and actionable: a clear “why now,” what to do, by when, and where to check details. Visual formats were preferred over long copy and dense charts. Timely “ban lifted” updates and stated review dates were important to sustain trust.
Priority messages to address knowledge gaps and concerns could include: practical guidance on reducing water use, including maintaining and topping up high‑use leisure equipment (such as hot tubs and pools) rather than refilling; a clear explanation that rainfall does not automatically lift restrictions, which remain until rivers, reservoirs and groundwater recover to agreed thresholds; the link between restrictions, environmental protection and safeguarding essential supplies; and guidance on the safe reuse of water outdoors, which appears more acceptable than in previous years.
Annex 1: Methodology
Quantitative research
The survey was conducted through an online panel and weighted to the national profile of England. In total, 2,100 respondents completed the survey including a boost of 300 respondents in areas affected by a TUB in 2025 (based on postcodes supplied by the Environment Agency). Quotas were set on age, gender, social grade, region, and urban or rural location. The survey data was weighted to be nationally representative of the general public aged 18+ in England.
| Age | |
|---|---|
| 18-24 | 10.51% |
| 25-34 | 17.15% |
| 35-44 | 16.49% |
| 45-54 | 16.80% |
| 55-64 | 15.79% |
| 65-74 | 12.44% |
| 75+ | 10.82% |
| Gender | |
|---|---|
| Male | 48.35% |
| Female | 51.65% |
| Region | |
|---|---|
| North East | 4.75% |
| North West | 13.09% |
| Yorkshire and Humberside | 9.69% |
| West Midlands | 10.42% |
| East Midlands | 8.70% |
| East of England | 11.19% |
| South West | 10.32% |
| South East | 16.41% |
| Greater London | 15.43% |
Fieldwork took place between February and March 2026.
Qualitative research
Four focus groups were conducted online between 12 and 18 March 2026. Each group was 1.5 hours in length with seven participants.
Each group had a cross-section of participants recruited to ensure a mix of previous experience of a TUB, garden ownership, home ownership, household type, mix of rural and urban locations.
Annex 2: Communication tested
This shows the messaging tested in the focus groups, and the top-line response to each.
Image 1
A two-sided poster saying, "Since we introduced a hosepipe ban we have..." on one page, and "fixed 679 leaks, saving 6.43 million litres of water per day" on the other page, with a graphic of a spanner on the word "leaks". From Southern Water.
This brought out people’s distrust in the water companies. It led to questions as to why the water companies were fixing leaks when the ban was on, and suggestions as to whether the ban would be needed if the leaks had been fixed earlier.
Image 2
A poster saying, "Because of the warm, dry summer we've had, water sources are lower than usual. Which is why it's important we work together to save water", with a graphic of a hand turning off a tap. From Southern Water.
This was one of the preferred messages. It was clear and gave a sense of the community working together. The tap resonates with the theme. However, one group disliked this approach finding the language and imagery a bit too simple and patronising, reminding them of posters telling primary school children to wash their hands.
Image 3
A poster saying, "Isle of Wight & Hampshire... Hosepipe restrictions are in place. Hosepipe bans are here to help protect our local rivers. Let's work together to save water." With a graphic of the sun shining on the message. From Southern Water.
This was one of the most well received. In a very simple and effective way it clearly told that there is a ban in place, why there is a ban and what to do about it. The link to the environment was well received and drove up support.
Image 4
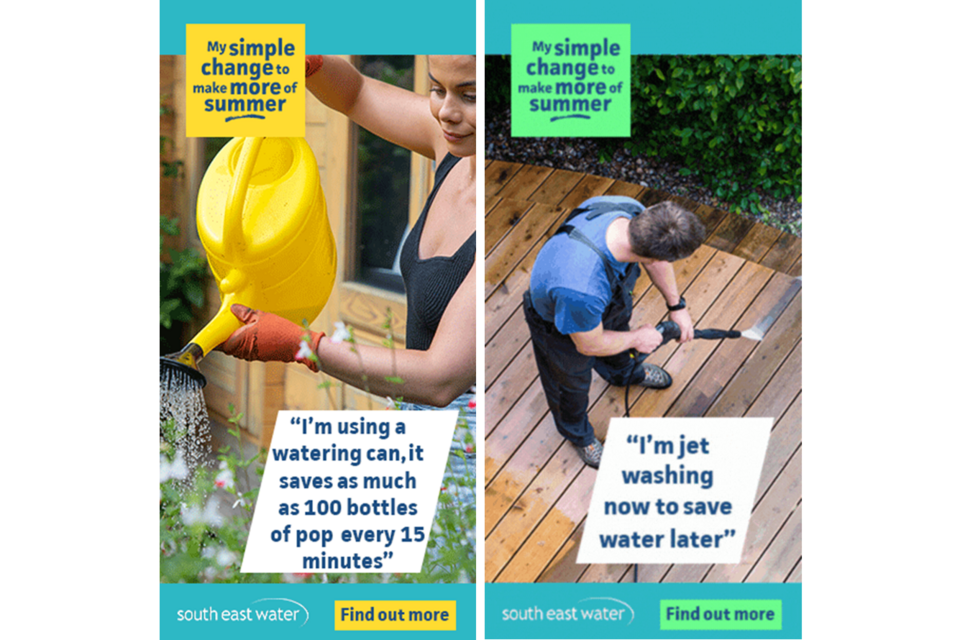
A set of two posters with the strapline, "My simple change to make more of summer". One poster says, "I'm using a watering can, it saves as much as 100 bottles of pop every 15 minutes", with a photograph of a woman using a watering can in her garden. The other poster says, "I'm jet washing now to save water later", with a photo of a man using a jet washer on some decking. From South East Water.
The concept of these messages was well received. Participants felt the pictures gave clear and simple suggestions of how a resident can play their part. However, the situations and statistics were not always relatable. Participants questioned how much liquid 100 bottles of pop was, and did not like the link between saving water and ‘pop’. They also questioned the jet washing picture as they felt seeing somebody jet washing did not have a direct link with saving water.
Image 5
A poster with the strapline, "We still need your help" and, in smaller font, "Demand has not reduced in Kent". It then has 5 paragraphs of text summarising the current situation, with the work being carried out by the water company. From South East Water.
This was generally seen as too much information, which they would mostly ignore.
Image 6
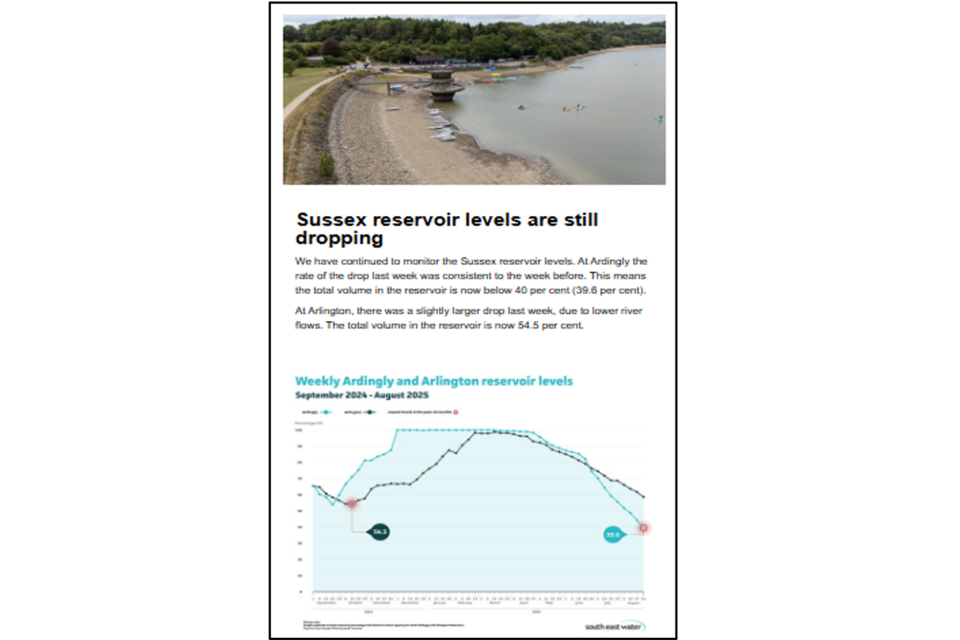
A poster with a photo of Ardingly reservoir and the heading "Sussex reservoir levels are still dropping". There are then 2 paragraphs of text summarising the decreases at Ardingly and Arlington reservoirs, then a chart showing the levels between September 2024 and August 2025. From South East Water.
For those who did want more information this was an ideal format, being able to see the reservoir levels drop and having a chart. However, only a minority wanted that level of detail. Others found the chart hard to read, and the statistics raised more questions than they answered.
Current water situation
Water UK publishes a summary of current hosepipe bans. Check with your local water company for specific rules.
The Environment Agency publishes reports on the water situation in England.