Ordnance Survey Limited Annual Report and Financial Statements 2025-2026
Updated 31 July 2026

© Crown copyright 2026
This publication is licensed under the terms of the Open Government Licence v3.0 except where otherwise stated. To view this licence, visit nationalarchives.gov.uk/doc/open-government-licence/version/3 or write to the Information Policy Team, The National Archives, Kew, London TW9 4DU, or email: psi@nationalarchives.gov.uk.
Where we have identified any third party copyright information you will need to obtain permission from the copyright holders concerned.
This publication is available at https://www.gov.uk/government/publications/ordnance-survey-limited-annual-report-and-accounts-2025-to-2026/ordnance-survey-limited-annual-report-and-financial-statements-2025-2026
Section 1 - Strategic report
Group overview
Key performance indicators
- Revenue [footnote 1] £198.7m (2024-25 £194.6m)
- Adjusted EBITDA [footnote 2] £45.2m (2024-25 £41.8m)
- EBITDA [footnote 3] £45.5m (2024-25 £38.0m)
- Operating cost efficiency [footnote 4] 76.9% (2024-25 77.8%)
- Free cash flow [footnote 5] £25.5m (2024-25 £20.1m)
Non-financial metrics
- OS Maps subscribers 536k (2024-25 508k)
- PSGA Key Delivery Milestones 10/10 (2024-25 7/7)
- Net Promoter Score [footnote 6] +56 (2024-25 +51)
Chair statement
A year on from joining, chairing the Board of Ordnance Survey (OS) continues to feel like an extraordinary privilege, bringing as it does the opportunity to support and promote one of the country’s most consequential organisations. As I move around OS I am constantly reminded of the deep, professional pride our people take in maintaining and evolving the value it brings to Britain.
That matters, because the national context is sharpening. And we are upping our gameplan in response. Government and industry are rightly asking more of digital public infrastructure: data that can be trusted, connected and used at pace. In that environment, OS has a clear responsibility to maintain the authoritative location base layer and act as a technical authority that helps others build with confidence.
This year the Board has focussed on building momentum. Our strategy, Better Data and More Destinations, is ambitious: now we must concentrate on making it happen. We have strengthened alignment between our plans and our shareholder’s expectations and refreshed our shareholder framework around clear aims: delivering the National Mapping Service, acting as technical authority, supporting the UK’s geospatial ecosystem and thereby growing long-term national value.
Progress has taken many forms. We are modernising how we create, curate and serve data, and we are widening how and where it can be used, including through partnerships and new routes to market. We are also demonstrating, through programmes such as the National Underground Asset Register, how OS can bring together complex datasets and make them usable for wide public benefit.
None of this is happening in easy conditions. Economic pressure and geopolitical uncertainty make the case for disciplined delivery stronger. All the more essential that we maintain good governance, resilient operations and prudent stewardship of public funds; alongside the investment needed to widen our range of activity in both the public and commercial spheres, enhancing OS’s national capabilities for the long term.
I am grateful to my fellow Board members and the Executive Leadership Team for their clarity and constructive challenge. Most of all, I want to thank colleagues across OS for the professionalism and purpose they bring every day. We are building the future for OS with confidence, knowing that we can do so much more to help secure society and grow our economy.
Colin Hughes
Chair
9 July 2026
CEO statement
This year has been all about building momentum. We have continued the foundational work that underpins our strategy, Better Data and More Destinations, but with a growing emphasis on delivery at scale, adoption, and demonstrable public value. The Greater Effectiveness part of our strategy has seen progress on efficiency, productivity and a developing culture of continuous improvement.
A key part of that progress has been reinforcing our role at the heart of the UK’s data infrastructure, all grounded in location. We have strengthened alignment between our purpose, our plans and the outcomes expected of us.
This year marked the first full year of Ordnance Survey operating the National Underground Asset Register (NUAR) – the interactive map of utilities infrastructure. We delivered the NUAR Beta and continued onboarding, including key asset owner Openreach, while progress in legislation enabled us to plan the next phase of enhancements with government partners. NUAR is demonstrating our ability to integrate data and is shaping a repeatable model for how we can distribute complex third-party datasets to unlock broader end use cases.
Across our wider customer and partner landscape, we continued to migrate our direct customers to the partner channel and are pivoting from migration to mutual growth, supported by stronger market insight and a sharper focus on priority sectors. We are clear-eyed that we must become easier to do business with, particularly for SMEs and start-ups, even as we continue to support innovation through Geovation.
On our product journey, we have maintained strong momentum in modernising the portfolio by introducing new data offerings, withdrawing legacy products, and progressing customer migration toward the National Geographic Database (NGD), with the ambition for broad NGD adoption by 2030. Alongside this, we have increased integration of third‑party datasets to enrich NGD and widen destinations and use cases - strengthening the role of OS data as national data infrastructure supporting wider government initiatives.
We have continued to modernise how we create and serve data: investing in capabilities in geodesy and positioning, drone surveying, and accelerating the use of AI for automated capture, change update and feature extraction. In parallel, our GeoAI work is advancing imagery analysis, alongside exploration of natural language spatial querying.
Financially, the Group reported revenue growth year on year, driven primarily by the set-up of NUAR and continued growth in OS Maps, our market-leading outdoor navigation app, while also managing cost pressures and aligning our operating model to better fit with our product and service offering.
As we look ahead, our priorities are clear: to accelerate More Destinations by meeting users where they are; to help customers and Partners realise value from the data we have built; and to continue strengthening the capabilities in people, technology and an operating model that enables Ordnance Survey to serve Britain with impact for the long term.
Finally, I want to thank every colleague across OS. Continuous improvement is made possible by teams who stay focused on what matters: serving customers, supporting national priorities, and building the next chapter of Ordnance Survey with pride and purpose.
Nick Bolton
CEO
9 July 2026
Our strategy and vision
As the National Geospatial Authority, our purpose is to provide pioneering geospatial capability for the benefit of the United Kingdom helping to:
- Position the UK at the forefront of geospatial advancement
- Drive innovation and sustain prosperity and economic growth
- Deliver geospatial infrastructure to support the UK economy, security and public services.
Our strategic aims
Our four strategic aims are summarised below and are taken from our Shareholder Framework Document. They reinforce our alignment to our shareholder’s priorities and focus our efforts. Our shareholder is the Department for Science, Innovation and Technology (DSIT) and UK Government Investments (UKGI) acts as the shareholder’s representative.
Strategic Aim 1: Deliver the national mapping service for Great Britain.
- Maintain, improve and provide stewardship of the National Geographic Database (NGD).
- Providing this national location data serves as a key part of the UK’s foundational data infrastructure, acting as the ‘glue’ between otherwise disparate data sets, in support of government’s wider data agenda to drive public value and support better citizen outcomes.
- Grow access to the NGD, making appropriate software and service interventions. Maintain and improve the UK’s positioning capability.
Strategic Aim 2: Act as a technical authority, expert advisor, and delivery partner on location data, authoritative positioning and geospatial matters.
- Working with the Government Digital Service, DSIT and other departments of the UK Government and Scottish and Welsh National Governments.
- This involves providing trusted, expert advisory services, supporting the delivery of innovative geospatial solutions, representing the UK internationally, and providing leadership in technical geospatial fora and sharing international best practice across the UK geospatial ecosystem.
Strategic Aim 3: Support a world-leading geospatial ecosystem and capabilities in the UK.
- Championing and developing geospatial education, skills, and impactful networks. Partnering and collaborating in a way that promotes growth through the better application of geospatial data and capabilities.
- Pioneering geospatial research and innovation, thought leadership, and the application of this in informing geospatial standards, policy, and practice.
- Encouraging people to get outside and enjoy the benefits of more active lifestyles as an outcome of a highly respected consumer brand.
Strategic Aim 4: Grow the long-term value of the organisation.
- Operating commercially to deliver products and services, driving revenue growth, delivering profitable revenues and ongoing operational efficiency as part of modern digital government, to deliver a sustainable return on capital.
- Alongside measures of revenue, efficiency, profit and return on capital, the measures of the long-term value of the organisation should include overall value and impact across the economy.
Our strategic ambitions
Our strategy aims to both improve the applicability of the data we produce (Better Data) and facilitate its application to help more customers answer more questions (More Destinations). We will achieve our strategy through a set of coherent actions focused on achieving specific ambitions.
| Strategy | Ambitions | ||
|
Better Data We will improve our data integrity, breadth and applicability by re-focusing on our area of market advantage – that is our core, of being a trusted provider of foundational datasets. Data integrity includes removing barriers to access and use. |
1. National Positioning Authority Increase trust in OS national positioning services, with government designation of OS as the National Positioning Authority. |
2. Refine and manage the National Map As custodians of vital national data infrastructure, grow our capability to support national objectives, including migration to the National Geospatial Database (NGD) portfolio. |
3. Aggregate and integrate both OS and non-OS data Aggregate, integrate and serve location-related both OS and non-OS data at national scale, from both public and private sector sources. This includes the successful operation of NUAR, leading to recognition of OS’s data sharing capabilities as part of a new data infrastructure. We will also support a range of complementary third-party data marketplaces in addition to our own distribution capability. |
|
More Destinations We will grow the market by facilitating more destinations for our data, leading to more end-users getting the insight they want. Destinations are defined as any Partner or platform that serves our data to an end-user, and also includes Public Sector Geospatial Agreement (PSGA) and consumer customers. |
4. Democratise location data insights Make data easy to discover and use, through “agentic AI” tools and support for non-geospatial data analysis tools. Position OS at the heart of the geospatial ecosystem. |
5. Help more people explore outdoors In our Consumer business, this means we aim to be the guide of choice to help more people explore the outdoors more often. |
|
|
Greater Effectiveness To work with greater effectiveness, we’ll promote accountability and clear lines of sight between decision-making and customer value. |
6. Modernise data production Recognised as best in class against metrics of productivity and efficiency. |
7. Grow long-term value Grow the long-term value delivered by the organisation for all stakeholders. |
8. Be an innovative data business Engaged teams delivering purposeful work, leveraging our diversity and capability. |
Our operating model
We have organised ourselves in a product-centric operating model to create clearer accountability and focus on our core capabilities.
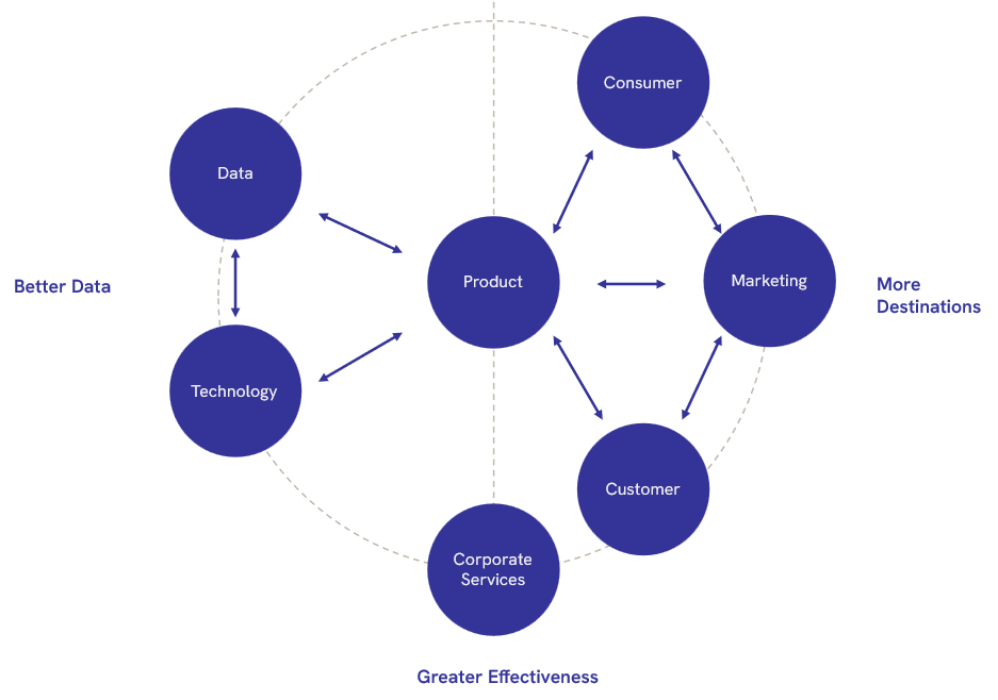
As part of this, we established five core services that underpin the geospatial data value chain – positioning, sourcing, refining, distributing and applying. Within each of these services sits a defined set of capabilities, designed to deliver reliable, resilient and relevant data and services to our customers at each stage of the value chain.
These changes are not simply structural. They represent a fundamental shift in how we create and deliver value, with a clear focus on improving end-to-end processes, reducing organisational friction and strengthening delivery through the service model.
This in turn has enabled greater delegation of decision making, increasing agility and accountability across the organisation. Early benefits have been seen in improved productivity and operational performance, with further gains expected as the model continues to embed.
| Service | Capability | |
| Position | An authoritative spatial referencing system supported by secure and resilient geodetic and positioning infrastructure. | - OS Net – Accurate Positioning - GINA – Situational Awareness - Positioning consulting |
| Source | The sourcing and maintenance of data via capture methods including field surveying, remote sensing, mobile mapping and third parties such as GeoPlace, our joint venture with the Local Government Association. | - Field - Imagery - Automation - Partnership |
| Refine | The processing of data from maintained sources to create enriched and derived data that provides new value. Refining increasingly uses Machine Learning techniques and other forms of automation. | - Visual + Contextual Data - Addressing + Location Data - Networks Data - Built + Natural Environment Data |
| Distribute | Data discovery and exploitation via digital APIs and services to provide customers and partners with access to our digital content. This includes aggregating and distributing third-party data from both public sector and commercial sources. | - OS Data Hub - Data marketplaces - Secure data sharing - National Underground Asset Register (NUAR) |
| Apply | The application of our data and services through an ecosystem of partners to deliver customer insights. | - Plug-ins, tools and consulting - OS Maps (app + website) - Paper Maps |
Strategic review
During the year, Ordnance Survey made strong and tangible progress in the first year of delivery against its Better Data, More Destinations strategy, reinforcing its role as the UK’s National Geospatial Authority and provider of the national mapping service for Great Britain.
Performance across the year reflected an organisation laying the foundations for future success, as we improved our operational performance, strengthened our data foundations and increased customer engagement with our products and services, ensuring meaningful progress against our new strategic ambitions.
Better Data
We made good progress in strengthening the quality, breadth and applicability of our data, supporting our strategic ambition to deliver better data as the foundation for long-term growth.
A key milestone was the successful completion of the six-year PSGA new data programme, which has enabled the transition to the National Geographic Database and materially enhanced the scope and quality of our core datasets. Alongside this, we continued to improve data currency and coverage, delivering over one million data edits during the year and improving the timeliness and reliability of our data for customers.
We expanded the breadth of our data through integration with key third-party datasets, including partnerships with the Office for National Statistics and HM Land Registry. These collaborations are strengthening the applicability of our data across a wider range of use cases, supporting both public sector outcomes and commercial opportunities.
Investment in platform and technical capability continued, including strengthening engineering capability and advancing our work in GeoAI. Strong progress was also made against our national positioning strategy, reinforcing our role as a key part of national infrastructure.
Customer outcomes remained strong, with a Net Promoter Score of +56 reflecting the continued value of our products and services. While we have continued to prioritise enabling successful outcomes for our customers, there is more to do, especially in ensuring our products and services continue to be fit for purpose as customers transition to new data structures and access models.
Overall, the year has seen significant strengthening of our data foundations, positioning us to accelerate adoption of NGD and increase the applicability of our data for our customers in future periods.
More Destinations
We continued to expand the reach of our data, supporting our ambition to grow the geospatial market and unlock new applications and growth opportunities. The number of destinations we reached increased materially during the year, demonstrating higher engagement with our new data products and reflecting continued development of the geospatial ecosystem.
In the consumer business, OS Maps subscriptions grew by 6%. This was supported by continued investment in product features and user experience. However, overall growth remained below target, reflecting increased competition and higher customer acquisition costs.
NUAR represents a significant strategic development, and in its first full year of operation we saw adoption grow steadily, with over 10,000 users and rising transaction volumes, providing early validation of the platform’s value as a national capability.
We delivered important enhancements to our NGD products during the year, not least with the incorporation of Royal Mail PAF data into our address product set. Despite this progress, NGD sales mix remained below target, reflecting the challenge of transitioning from well-established legacy products.
Revenue performance remained subdued, partially due to lower transactional volumes in a weaker property market. However, growth in priority market sectors, particularly Financial Services, demonstrated the effectiveness of our increasingly targeted commercial approach.
Taken together, while some leading indicators remained below target, the continued growth in destinations, strengthening of our propositions and continued development of NUAR, provided a solid platform for future growth.
Greater Effectiveness
We made meaningful progress in improving organisational effectiveness during the year. The implementation of our service-based operating model improved clarity, accountability and alignment across the organisation.
Employee engagement initially declined following the organisational changes but subsequently improved during the year, supported by investment in leadership training, culture and capability, including new principles and frameworks designed to strengthen collaboration and performance.
These changes are beginning to translate into improved operational outcomes. Productivity, measured in terms of revenue per FTE, grew by over 8% in the year, alongside improved cost efficiency. Internal promotion rates increased, demonstrating the strength of our internal talent pipeline and we also strengthened our technical capability, including continued investment in positioning, to support future growth opportunities.
Overall, the organisation is operating more effectively than it was a year prior, with stronger foundations in place to support sustained delivery and improved efficiency over the medium term.
Looking Ahead
As we look ahead, our focus shifts from establishing the foundations of our strategy to accelerating delivery and scaling impact. We will prioritise increasing NGD adoption, improving sales mix and accelerating the transition from legacy products. This will be critical to improving revenue growth, EBITDA performance and long-term value creation. In parallel, we will continue to develop NUAR as a national capability, expanding functionality and onboarding users to drive usage.
Our approach to growth will become increasingly targeted, focusing on specific market sectors, strengthening our commercial capability and expanding to deliver more destinations, all while we continue to strengthen our role as a strategic partner to government, contributing to national infrastructure, supporting policy priorities and delivering broader public value.
In summary, the year reflected the early stages of transformation, with solid progress made in building the foundations required for long term success. While financial performance remained constrained by market conditions, leading indicators across customer outcomes, operational performance and organisational capability all improved. With strong foundations now in place, improving organisational capability and a clear strategic focus, the organisation is well positioned to accelerate delivery, and create sustainable long-term value, both for the company and wider society.
Strategic KPIs
| Measure | Actual | Target | Definition | Commentary |
|---|---|---|---|---|
| More Destinations | ||||
| NGD destinations | 4,578 | 4,866 | Total number of unique customer-product combinations accessing NGD services within the reporting period. | NGD destinations increased by over 30% year-on-year, demonstrating continued expansion of our new product reach. Performance remains modestly below target, reflecting slower adoption in specific sectors and timing of new product releases. Focus remains on accelerating partner onboarding and expanding use cases to drive further scale. |
| OS Maps subscribers (‘000’s) | 536 | 571 | Total number of active OS Maps subscribers at the period end | Subscriber volumes grew by 6% in year, reflecting continued demand for consumer mapping services. Growth was constrained by increased competition and rising acquisition costs, impacting conversion rates. |
| NGD sales mix | 5.3% | 6.6% | Percentage of new business sales derived from NGD products | NGD Sales Mix remains below target, reflecting the pace of transition from legacy products. Notwithstanding this, progress has been made through product enhancements, including integration with Royal Mail PAF data, release of NGD postcodes, and development of an NGD Basemap prototype. These are expected to support improved conversion and drive future revenue mix improvement |
| Number of OSMM products | 30 | 30 | Total number of legacy OS Master Map (OSMM) products offered | Performance is in line with target. End‑of‑life notifications have been issued in accordance with the transition plan, supporting the migration of customers to NGD. The number of OSMM products is expected to reduce over time, consistent with delivering the strategic shift towards NGD adoption and reducing operational complexity. |
| NUAR number of end users (‘000’s) | 10.3 | 18.0 | The total number of end users of the NUAR platform | User growth remains below target, driven by slower onboarding of asset owners. Notwithstanding this, underlying adoption continues to strengthen, with 374 asset owners onboarded and transaction volumes exceeding 16,000 per month by the end of the year. Delivery is expected to accelerate into the next financial year as onboarding pipelines mature. |
| Better Data | ||||
| Customer NPS | 56 | 49 | Our customer satisfaction (measured by a blended NPS score across all our customers and partners) | Customer NPS exceeded target, reflecting strong performance across key segments. Consumer and partner scores improved materially year-on-year, while Government performance remains high despite a marginal decline. This demonstrates continued strength in customer trust and service delivery, particularly within PSGA. |
| Data use cases met | 53.1% | 60.0% | Percentage of priority customer use cases where data meets defined quality and availability standards | Performance remains below target; however, key milestones were achieved, including completion of all PSGA new data requirements. This marks the successful conclusion of a six-year delivery programme and provides a stronger platform for improving use case coverage. |
| Positioning maturity | 2.4 | 2.2 | Composite maturity score assessing capability across defined positioning service criteria including use case applicability, our recognition as the National Positioning Authority, and our progress against the PNT roadmap | Capability maturity exceeded target, reflecting delivery of all planned activity, including expansion of OS Net infrastructure and advancement of positioning service analysis. |
| Greater Effectiveness | ||||
| Employee engagement | 4.3 | 7 | Employee Net Promoter Score (eNPS), based on a rolling 12-month average. | Engagement has improved during the year following the operating model restructure, new organisational principles and leadership frameworks. Continued focus is required to close the gap to target and embed cultural change. |
| Internal promotion rate | 10.6% | 9.0% | Number of internal promotions as a proportion of the total population, based on a 12-month rolling average (%) | Performance exceeded target, reflecting a strong internal talent pipeline and commitment to developing capability within the organisation. |
| Productivity | 148.0 | 144.2 | Net trading revenue per FTE (£k) | Productivity exceeded target, driven by a combination of revenue growth and a reduction in average FTE, delivering an 8% increase in net trading revenue per FTE year-on-year. This represents a continued improvement in operating efficiency in the business and supports delivery of EBITDA and cash objectives |
| Production productivity | 2.4 | 3.3 | Volume of data edits delivered per £ of spend within the sourcing function | Performance is below target in the first year of measurement, reflecting early‑stage baseline setting. Over one million edits were delivered in year, and a new Geospatial Content Enhancement framework was implemented. Targets will be refined to reflect operational reality while maintaining focus on efficiency gains. |
Financial review
The Group delivered revenue growth in the year of £4.1m to £198.7m and growth in adjusted EBITDA of £3.4m to £45.2m.
Revenue growth was driven by expansion of the National Underground Asset Register (NUAR) which provides an underground map of pipes and cables across the UK, and is used by utilities, transport and highways and local authorities.
We saw a small decline in our business to consumer revenue, following our decision in 2024-25 to stop reselling low margin consumer products and focus instead on our core digital offering (OS Maps) where we delivered growth of £0.8m (7%) year on year.
Adjusted EBITDA [footnote 7] grew by £3.4m to £45.2m (2024-25 £41.8m) due to the flow through of increased revenue, set against stable costs.
In August 25 we acquired the remaining 75% share of Dennis Maps Ltd, our supplier of paper maps. This facilitated the exit of the previous shareholder and gave Ordnance Survey ownership over a key strategic supplier.
| 2025-26 | 2024-25 | |
|---|---|---|
| £m | £m | |
| Revenue | 198.7 | 194.6 |
| Adjusted EBITDA | 45.2 | 41.8 |
| Adjusted EBITDA % | 23% | 20% |
| Profit Before Interest Tax (PBIT) | 23.6 | 17.6 |
| PBIT % | 12% | 9% |
| Profit attributable to owners of the company | 17.0 | 13.1 |
| Dividend | 7.7 | 5.7 |
| Net Assets | 152.8 | 143.6 |
Dividends
In March 2026 we declared a final dividend of £7.7m to our shareholder, the Secretary of State for Science, Innovation and Technology. During the year, we paid £5.7m of dividends to our shareholder, representing the amount declared in March 2025.
Group Entities
| Turnover | Turnover | PBIT | PBIT | |
|---|---|---|---|---|
| (£m) | (£m) | (£m) | (£m) | |
| 2025-26 | 2024-25 | 2025-26 | 2024-25 | |
| Ordnance Survey Leisure Limited | 14.8 | 15.9 | 3.1 | 4.6 |
| Ordnance Survey International Services Limited | 0.0 | 0.3 | (0.4) | (1.3) |
| Dennis Maps Limited [Note 1] | 2.5 | - | 0.4 | - |
| Note 1: From date of acquisition, 1 August 2025 |
Shared Ownership Entities [Note 1]
| PBIT | PBIT | |
|---|---|---|
| (£m) | (£m) | |
| 2025-26 | 2024-25 | |
| GeoPlace LLP | 10.9 | 10.7 |
| Dennis Maps Limited [Note 2] | 0.0 | 0.0 |
| Note 1: Values represent Group share of profit |
| Note 2: Up to point of acquisition, 1 August 2025 |
Cash Flow, Liquidity & Borrowings
Group trading operations generated free cashflow (before dividend) of £25.5m (2024-25 £20.1m). Underlying this variance are the following factors;
Cash flow from operating activities was down £6.6m to £27.2m (2024-25 £33.8m) primarily due to
- Working capital cash outflows £4.1m higher than last year due to balance sheet movements
- Reduction in deferred revenue balances due to unwind of previous years multi-year contracts reducing cashflows by £5.0m.
- Tax payments of £0.6m compared to zero in the prior year
- Partly offset by £3.4m higher adjusted EBITDA year on year
Cash flows from financing were up £11.8m to £0.1m (2024-25 £11.7m outflow), mainly due to
- Increase in distributions from GeoPlace of £7.5m as a result of phasing of the Q4 payment of £3.75m for 24-25 from March 25 into April 25.
- Reductions in purchases of property, plant and equipment and intangible assets of £3.6m since prior year
Cash used in financing activities (excluding dividend payments) decreased by £0.2m due to lower right of use asset lease liability payments.
Overall, the year-end cash balance increased by £19.8m to £96.6m.
The Group maintains cash balances sufficient to meet its short-term obligations, recognising that cash inflows are seasonal in nature and vary during the financial year.
The Group has no external borrowings. The only financial liabilities recognised relate to lease obligations arising from the capitalisation of leased assets on the balance sheet. These leases predominantly comprise the Group’s London office premises and a fleet of vehicles used by data collection teams.
Principal risks and uncertainties
The Risk and Internal Control Framework
OS embeds risk management as a core component of strategic planning and decision-making to support the achievement of organisational objectives and continued delivery of high-quality products and services.
Our risk and internal control framework is designed to balance mitigation and risk acceptance in a cost-effective way, aligned with HM Treasury’s Orange Book principles, enabling proactive identification, assessment and management of risks across the organisation. The Chief Financial Officer oversees the effectiveness of strategic and operational risk management, reporting regularly to the OS Audit and Risk Committee (OSARC) and the Board.
The principal (strategic) risks are routinely challenged and refined by the Executive Leadership Team, reinforcing the importance of strong risk oversight. OSARC receives strategic risk updates at each meeting and conducts periodic deep-dive reviews into specific areas.
An independent risk management function operates across all business areas to ensure key risks are consistently identified, managed and reported, while supporting continuous improvement in risk practices through guidance, awareness and practical advice.
Principal risk summary
The risk and internal control framework highlighted the following principal (strategic) risks that could affect delivery of the OS strategic ambitions over the life of the Business Plan:
| NGD adoption | |
|---|---|
| Overview | Due to a lack of compelling NGD value and incentives, customer migration from legacy products may not be at the expected pace, resulting in revenue shortfall, continued legacy costs, constrained roadmap delivery, and make the securing of PSGA Next more challenging. |
| Risk Controls | |
| Mitigation | Product roadmap of enhancements and new product launches. |
| Planned withdrawal of End-of-Life (EOL) products. | |
| Successful delivery of enhancements to the overall NGD offer. | |
| Sustained engagement and support with customers and Partners to guide and enable their transition to new-era products. | |
| Focus for 2026-27 | New product launches, enhancements and EOL withdrawals delivered as planned. |
| Increased engagement with top 30 Public Sector customers. | |
| Targeted customer propositions to support transition. | |
| NGD accreditation scheme for Partners. |
| Data Hub evolution | ||
|---|---|---|
| Overview | Due to the evolution of the data hub lacking pace, quality, or differentiation, the platform may fail to scale and compete in the market, leading to reduced uptake, revenue shortfall and missed strategic benefits. | |
| Risk Controls | ||
| Mitigation | Product and engineering leadership in place for development. | |
| Applying secure-by-design and agile development practices. | ||
| Focus for 2026-27 | Continuous deployment of built services. | |
| Development of new commercial model. | ||
| Release of data hub minimum viable product. |
| Fit for purpose data | |
|---|---|
| Overview | Due to declining usability, availability, quality, accuracy or lack of third party integration, OS data may be considered not fit for purpose, resulting in loss of customer trust, reduced adoption and constrained growth. |
| Risk Controls | |
| Mitigation | Data governance and quality assurance processes strengthened and operational. |
| Proactive monitoring of data issues, combined with timely updates and collaboration with key users. | |
| Focus for 2026-27 | Data issues management capability maturity. |
| Data product testing framework fully implemented and continuously improved. | |
| Data ecosystem and acquisition management capability established. |
| Positioning infrastructure resilience | |
|---|---|
| Overview | Due to Positioning, Navigation, and Timing (PNT) signal disruption, either natural or hostile, or system failures, OS PNT capability and services may be degraded or compromised, leading to a loss of credibility in OS as the National Positioning Authority. |
| Risk Controls | |
| Mitigation | OS Net infill and hardware replacement for increased resilience in meeting the planned service uptime. |
| Focus for 2026-27 | Further enhancing of OS Net infrastructure. |
| Expanding monitoring and early warning systems for GNSS disruption. | |
| Reinforcing cyber security and service-assurance controls. | |
| Maintaining and increasing skilled geodesy and PNT expertise, collaborating closely with national security partners | |
| Implementing robust redundancy, maintenance, and incident response processes. |
| IT estate complexity | |
|---|---|
| Overview | Due to legacy technology complexity and weak solution architecture, systems may become increasingly unstable, difficult to support, and unable to adapt to business needs, resulting in service disruption and increased operational cost. |
| Risk Controls | |
| Mitigation | Planned withdrawal of End-of-Life (EOL) products. |
| Adoption of product-led management approach to address heritage application technology risks. | |
| Heritage systems are managed by the technology product teams and prioritised by service component owners. | |
| Focus for 2026-27 | Retire heritage systems as soon as is practicable in line with the product withdrawal roadmap. |
| Continue to strengthen architectural governance to ensure new solutions are designed and delivered to reduce, not add to, estate complexity. |
| Technology adoption | |
|---|---|
| Overview | Due to a failure to identify and adopt new technology (including AI), OS could experience reduced operational efficiency and weaker product capability, resulting in lost competitiveness, higher costs, and reduced customer value. |
| Risk Controls | |
| Mitigation | AI strategy, governance and business function established. |
| Focus for 2026-27 | Recruitment of additional AI related roles. |
| Development of the AI champions network. | |
| Availability of AI literacy and education training package. | |
| Establish and communicate NexOS positional accuracy roadmap | |
| Delivery of early milestones for NexOS Research Projects. |
| Resilience and security | |
|---|---|
| Overview | Due to inadequate resilience planning and controls, a major disruptive event could restrict OS operations, resulting in prolonged outages that delay delivery of critical strategic and operational activities. |
| Risk Controls | |
| Mitigation | Resilience and security governance framework in place. |
| ISO27001 and Cyber Essentials plus certifications. | |
| 24/7 Security Operations Centre | |
| Focus for 2026-27 | Resilience & security steering group (RSSG) governance improvement. |
| Security strategy and operating model | |
| Business continuity (BCP) and emergency planning improvements. | |
| Disaster recovery plans and testing for critical systems. | |
| Physical security improvements Explorer House. | |
| Role based risk assessments. |
| People and leadership | |
|---|---|
| Overview | Due to reliance on scarce skills and inconsistent leadership, delivery activities could slow or stall, leading to delays and reduced employee engagement and productivity. |
| Risk Controls | |
| Mitigation | Service-based operating model implementation. |
| Senior leadership development | |
| Strategic workforce plan | |
| Focus for 2026-27 | Effectiveness of the service-based operating model. |
| Maintaining the strategic workforce plan. | |
| Critical role and leadership succession plan. |
| Stakeholder value | |
|---|---|
| Overview | Due to a lack of understanding by key government stakeholders, OS’s role as a critical part of the UK geospatial ecosystem could be threatened, leading to a change of status or withdrawal of investment. |
| Risk Controls | |
| Mitigation | Strong performance under the PSGA, clearly demonstrating value through reliable service delivery. |
| Governance relationships with the UK Government established. | |
| Focus for 2026-27 | Continue to strengthen governance relationships with the UK Government by consistently delivering high quality national and government managed mapping services. |
| Progress with PSGA-Next to provide long term confidence. | |
| Maintain regular engagement with strategic government customers to clearly explain OS’s role and alignment to government priorities. |
Sustainability is covered in the Sustainability review section of this report.
The Accountable Person
The Chief Executive Officer fulfils the role of Accountable Person (see Our governance). Together with the OS Board, they have responsibility for maintaining a sound system of internal control. This supports the achievement of OS’s policies, aims and objectives, while safeguarding the public funds and departmental assets for which they are responsible, in accordance with the responsibilities assigned to them as Accountable Person under Managing Public Money, and for which the Board are responsible individually and collectively, in accordance with the Companies Act.
Senior Management Assurance
As part of the year end process, the Executive Leadership Team (ELT) conduct a control self-assessment and annual assurance statement exercise, whereby the CEO, as the Accountable Person, is provided written assurance on the reliability and effectiveness of:
- Strategy and planning
- Risk management
- Operational resilience
- Values and behaviours
- Arrangements for reporting instances of fraud, bribery, or corruption
- Reporting non-compliance with legislation
- The control environment and activities established to meet business objectives
- Information security
The exercise concluded that ELT assurance has been given with no significant issues raised.
People
As an organisation with significant intellectual property, and working in a constantly evolving industry, OS is reliant on the skills, knowledge, and integrity of our employees. OS needs to be able to respond quickly to new and emerging requirements, while maintaining the efficiency and effectiveness of operations.
We do this by training our employees, providing adequate opportunities for development, career progression, and reward. Attracting and retaining talent is managed through recruitment activities, talent identification with tailored training programmes, graduate schemes, internships, and recognition schemes.
OS uses the services of contractors to cope with the peaks of demand on resources and complies with the recommendations outlined in the HM Treasury Review of the tax arrangements of public sector appointees.
Fraud and Whistleblowing
OS has established appropriate arrangements for raising concerns and reporting fraud which we consider to be effective. These arrangements include:
- Whistleblowing and counter-fraud policy and procedures
- Additional independence with the Chair of OSARC as a named non-executive to confidentially report to, and also the ability to raise concerns directly with the National Audit Office as an alternative independent party
- Mandatory training to ensure all employees and contractors remain aware of the whistleblowing and counter-fraud policies
There were no reported incidents of bribery or corruption, and no whistleblowing incidents during this reporting period. However, there were two potential fraud incidents reported: one of them was investigated and concluded to be an error with remedial steps being put in place; and following further checks the other was not considered to be a fraud or error.
Anti-Slavery Policy
Our Anti-Slavery Policy Statement, available on our website, sets out how we ensure that modern slavery or human trafficking is not taking place within our business or supply chain. This includes supplier and supply chain reviews, specifically centred on the Modern Slavery Act by our Procurement Category Management teams. In addition, completion of a mandatory Anti Bribery and Modern Slavery digital course is required for all OS employees to promote awareness.
Information Security
OS considers the confidentiality, integrity and availability of its information to be of paramount importance. We continue to invest in both technical capabilities and skilled personnel to manage and mitigate information security risks effectively. Our Information Security function, led by the Chief Information Security Officer (CISO), works collaboratively across the organisation to provide expert advice, oversee security operations, and develop policies, standards and training that support a strong security culture. OS remains committed to maintaining Cyber Essentials Plus and ISO/IEC 27001 certification, demonstrating adherence to recognised information security standards and reinforcing trust with our customers and stakeholders. In addition, we complete the HM Government Departmental Security Health Check and the GovAssure assessment annually. These provide independent assurance that we meet the required minimum government security standards, including those relating to information security.
Protecting Personal Data
Information security risk is a key element of our Data Protection compliance arrangements. During 2025-26, all data compromise and data loss incidents were logged and investigated. The Data Protection Officer has sought to ensure OS continues to understand its obligations to comply with GDPR.
Looking Ahead
The Board and ELT will continue to work on developing the risk management and governance arrangements at OS. We will continue to review those strategic risks to achieving our strategic goals within the ELT and the Board with a view to considering the timeliness of implementation and success of mitigating actions.
We will continue to integrate the strategy and business planning, budgeting, performance management and risk management processes as being fundamental to delivering the OS strategy with OSARC and Board oversight.
Review of Effectiveness
As Accountable Person, the CEO has responsibility for conducting an annual review of the effectiveness of the systems of governance, risk management and internal control.
This review is informed by:
- The OS Audit and Risk Committee
- The oversight and work of the Executive Directors and senior managers
- The annual control self-assessment process and annual letters of assurance received from ELT members
- The Risk Management and Internal Audit functions
- The external auditors, the National Audit Office
All the above teams have a role in ensuring the OS risk management, governance and internal control structures are adequately designed and operating effectively. This Governance Statement reflects the result of the CEO’s review, and he is satisfied with the effectiveness of the system of governance and the agreed plans to address weaknesses and ensure continuous improvement of the system of risk management and internal control.
Management Certification
The CEO considered all the evidence provided during the preparation of this annual Governance Statement and has concluded that the organisation’s overall governance, risk management and internal control structures are effective.
Duty to promote the success of the Company
Under section 172 of the Companies Act 2006, the Directors of the Company must act in the way they consider, in good faith, would be most likely to promote the success of the Company for the benefit of the members as a whole, and in doing so have regard to various factors, including the following:
- The likely consequences of any decision in the long-term
- The interests of the Company’s employees
- The need to foster the Company’s business relationships with suppliers, customers and others
- The impact of the Company’s operations on the community and the environment
- The desirability of the Company maintaining a reputation for high standards of business conduct
The Strategic Report and Governance Statement explain and provide various examples of how the Board of Directors have aimed to comply with this section 172 duty. In summary, the Directors have given regard to the above factors via the following means:
As a general practice, all Board papers seeking formal decisions and all Board agendas include specific reference to and consideration of the section 172 duty and the various factors.
In terms of having regard to the likely consequences of any decision in the long term:
- The Shareholder Framework Document (SFD) sets the Company’s overall control framework for decisions which could have material long-term consequences. The SFD has been reviewed by the Board in conjunction with the shareholder and UKGI during 2025-26 and the updated SFD was signed by the shareholder, UKGI and OS in January 2026.
- In turn, the Board have set internal financial delegations which provide the Board with a control mechanism for any decision which could have material long-term implications.
- The Board has a five-year strategic plan which considers the long-term implications for the success of the Company. The strategic plan was reviewed and approved by the Board during this reporting period, and subsequently approved by the shareholder in March 2026. Development and success of the Strategic Plan and long-term implications for the Company is a continuing area of Board focus.
The Board has considered the interests of the workforce and other stakeholders as part of Board discussions and decisions. In relation to employee engagement, the Board has:
- Had regular engagement with the Chief People Officer and her team in relation to culture and organisation change and the implementation of a new service-based operating model and ways of working, consideration of employee engagement and sentiment results from Workday Peakon engagement surveys, and annual review of health & safety and wellbeing.
- Considered ways in which the employee voice can be enhanced in the Boardroom, including identifying opportunities for all Non-Executive Directors to engage across the employee population. This included Board engagement sessions with the NUAR operational contract delivery team and Executive and Senior Leadership teams.
The ways of engaging with employees have included the following:
- Regular in-person and online events throughout the year hosted by ELT, where employees are encouraged to engage and ask questions, covering the development and implementation of our data & destinations strategy, business transformation programme, service model implementation and overall business performance.
- Monthly engagement surveys for all employees hosted by Workday Peakon.
- Ongoing consultation with Trade Unions on pay, organisation design and implementation of the new service-based operating model.
- Various employee groups enabling community-led involvement and decision making to inform policy. Groups include Women+ Development Network, LGBT+, Accessibility Awareness, Neurodiversity Network, Ethnic Minorities Network, Religion and Belief Network, and Sustainability Community.
- Employee representatives involved on strategic projects, for example graduate representation on the Sustainability Steering Group.
- Employee action teams to lead initiatives aligned to our strategy deliverables.
We have engaged with and fostered our relationships with suppliers, customers, and stakeholders and explain elsewhere in this Strategic Report about our various engagement activities, which have included the following:
- Our engagement throughout the year with the Government Digital Service in relation to the PSGA, NUAR and the development and implementation of our strategy.
- We have continued to engage across our public sector customers under the PSGA, and in relation to the transition to NGD.
- Our regular engagement activities with our Licensed Partners, including our Partner and Innovation events held in person at our HQ, Explorer House in March, together with regular Licensed Partner Advisory Council meetings held during the year.
- Engaging with our suppliers through our Procurement and Contract Management activities and processes, including supplier days and monitoring operational performance via KPI tracking (e.g. creditor payment days).
We regard the impact of the Company’s operations on the community and the environment. Our Sustainability report covers this impact in greater detail, however in summary:
- OS is an active participant in the community, both through our corporate charity Mental Health UK until March 2026, and has since changed to Scope, and through encouraging all staff to utilise their volunteer days in local projects, with engagement monitored via a KPI.
- We have maintained our ISO14001 accreditation and continued to develop our Environmental Management Systems.
- As to the desirability of the Company maintaining a reputation for high standards of business conduct, the Board have maintained a focus on this through:
- Our Annual Assurance Statement process (as described in the Strategic report).
- Maintaining a whistleblowing policy, supported by staff awareness campaigns (as described in the Strategic report).
- The various internal audits conducted during 2025-26 (as described in Our governance).
The Strategic Report was approved by the Board and signed on its behalf by:
Nick Bolton
CEO
9 July 2026
Section 2 - Our governance
Company status and shareholding
Ordnance Survey Limited is a private company whose sole shareholder is the Secretary of State for Science, Innovation and Technology (DSIT) on behalf of HM Government. UK Government Investments Limited (UKGI) is part of OS’s sponsorship, acting as the Shareholder Representative on behalf of the Secretary of State. UKGI works with DSIT and OS to promote effective corporate governance; to monitor and challenge business planning and performance; to promote strong corporate capability and effective leadership; and to support effective relationships between OS and DSIT. UKGI provides advice to DSIT and Ministers on these matters and provides a Shareholder Non-Executive Director to the Board. As a wholly owned government Company, OS is classified as a Public Non-Financial Corporation, meaning it operates as a trading body controlled by central government with substantial day-to-day operating independence.
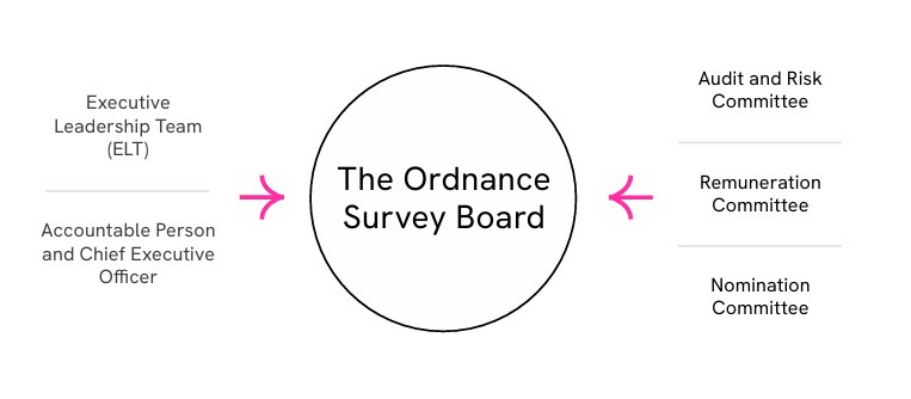
Ordnance Survey structure
The Ordnance Survey (OS) Board is responsible for providing effective and entrepreneurial leadership for OS, in accordance with the Shareholder Framework Document, promoting the long-term sustainable success of OS and generating value for the shareholder and contributing to wider society. This includes ensuring the delivery of the Strategic Objectives, the development and update of the multi-year Strategic Plan and annual operating plan and budget and providing entrepreneurial leadership within a framework of prudent and effective controls which enables risk to be assessed and managed.
The Accountable Person and Chief Executive Officer is responsible for day-to-day leadership and proper, effective, and efficient use of public funds, plus stewardship of OS resources.
The Executive Leadership Team (ELT) is the Senior Executive team, led by the Chief Executive Officer, and responsible for all operational matters, ensuring the delivery and implementation of the strategy agreed by the Board, managing the resulting operations, and leading the development of the Strategic Plan and Annual Operating Plan and Budget (AOPB) for recommendation to the Board.
OS Audit and Risk Committee (OSARC) has responsibility for the independent appraisal of the Company’s control environment, financial reporting, risk management and effectiveness of corporate governance, and for providing advice and challenge on Company risk.
Remuneration Committee develops the Company’s Remuneration Policy and approves Director and designated senior executive remuneration, in line with the policy.
Nomination Committee reviews the structure, size, and composition of the Board, and makes candidate recommendations for approval to fill Board vacancies, excluding the Chair and Shareholder Director.
Governance statement
The governance statement outlines the control structure, explains how OS has complied with the principles of good governance, and reviews the effectiveness of its governance arrangements.
UK Corporate Governance Code
Ordnance Survey Limited is a private company limited by shares and wholly owned by the Secretary of State for Science, Innovation and Technology on behalf of HM Government. The Shareholder Framework Document requires Ordnance Survey Limited to operate corporate governance arrangements that accord with corporate governance best practice. Although Ordnance Survey Limited is not subject to the UK Corporate Governance Code, the Board believes in strong governance and therefore, where possible, it aligns its governance processes and arrangements with the best practices outlined in its principles and provisions.
Board effectiveness
Following self-assessment effectiveness reviews during 2023-24 and 2024-25, an independent effectiveness review was undertaken for the Board and Board Committees during 2025-26. This was conducted by Independent Audit Limited (IAL), who were selected following a tender process. IAL – a signatory to the Code of Practice for independent board reviewers – is an independent consultancy that has no other connection with the Company.
IAL’s review met the Shareholder Framework Document requirement to undertake an independent externally facilitated Board review every 3 years and is in line with best practice from the UK Corporate Governance Code 2024 (paras 21 and 22). The review considered Board and Committee papers, observations of Board, Audit & Risk and Nomination Committee meetings, and individual confidential discussions with each Director, and certain ExCo members and external advisors. All interviewees completed a questionnaire at the start of the review process - the results of which formed the basis of their individual discussions. Following the completion of fieldwork, IAL prepared a report for an initial discussion with the Chair, before discussing it with the full Board in January 2026.
The review noted the following as areas of strength to be maintained:
- A clear strategic direction and alignment
- Significant contributions from Non-Executive members of the Board and strong additions to the Non-Executive membership
- A positive Chair-CEO relationship, good Board dynamics, constructive relationships between NEDs and management, and improved Board papers and materials.
- Well-organised board and committee meetings.
The review highlighted five broad themes and related suggestions for Board consideration to help support an overall task of becoming “consistently effective as a technology and data company board in a complex public-sector setting”. These were:
- Purpose: using Ordnance Survey’s purpose as the National Geospatial Authority to guide the Board’s priorities.
- Culture: how the Board can help to embed culture shift.
- Board Succession planning: in view of imminent Non-Executive departures.
- Audit and Risk: continuing to develop Audit and Risk Committee’s oversight role following a period of improvement to the organisation’s risk and assurance framework and in view of upcoming changes of leadership and membership.
- Stakeholder visibility and engagement: how this can be developed and the role the Board can play.
The Board identified a number of actions to take forward following the review, including:
- Ensuring that review and discussion of organisation culture is regularly included as part of the Board agenda.
- Continuing to focus on NED succession planning, which has been an area of activity for the Nomination Committee.
- Audit and Risk committee implementing an “assurance mapping” review undertaken by Internal Audit to help guide the Committee’s agenda and areas of oversight.
- Audit and Risk committee implementing a recommendation for a separate paper on key financial reporting judgments, with a paper on this topic having already been presented this year and to be repeated annually.
- Considering ways in which the Non-Executive Directors can regularly engage with and hear from employees, customers and stakeholders.
IAL had an opportunity to comment on this description of the process.
Following the review, and given the upcoming changes to the non-executive membership, the Board took the decision to undertake the next independent effectiveness review within two years, during financial year 2027-28 (as opposed to the usual practice of conducting an externally facilitated review at least every three years.)
OS Audit and Risk Committee Report
The OS Audit and Risk Committee (OSARC) supports the Board in executing its responsibilities for issues of risk, control, and governance. It is responsible for the independent appraisal of the OS control environment, financial reporting, risk management, the effectiveness of corporate governance, and for providing advice and challenge on the management of risks that may impact the organisation. Further detail about the Risk and Internal Control Framework at OS can be found in the Strategic report.
OSARC Effectiveness
OSARC confirmed it acted in accordance with its terms of reference, and it ensured the independence and objectivity, of the internal and external auditors.
The Audit and Risk Committee Chair maintained a regular dialogue with the leads for Internal Audit and Risk Management, the external auditors (National Audit Office), the Chief Executive Officer & Accountable Person, the Chief Financial Officer and the Chief Technology Officer to provide opportunity for independent discussions relating to the effective discharge of the Committee’s responsibilities.
The Audit and Risk Committee reviewed the risks and issues brought to it and reported any issues requiring attention to the Board. The Committee reviewed and approved changes to the overall risk management framework, and in turn reviewed and approved a refreshed set of strategic risks, in line with the OS strategic ambitions and priorities. The Committee reviewed the nature and status of individual strategic risks, along with details of mitigating actions being taken. Key strategic risk areas were reviewed in detail, with information security and business continuity being areas of particular focus during 2025-26.
Internal Audit attended each Audit and Risk Committee meeting, providing a summary of internal audit findings and an update on progress against the plan. The Committee also reviewed the status of all internal audit recommendations.
Following a reorganisation in November 2025, the Risk Management Lead moved from the Programme Management Office (now Programme, Performance & Change) to report into the Head of Internal Audit and the department was renamed Risk & Assurance.
The Head of Internal Audit reports functionally to the Chief Financial Officer, but also maintains a direct and regular reporting and communication line with the OSARC Chair. The Chief Executive Officer, Chief Financial Officer, Chief Technology Officer, and General Counsel/Company Secretary are invited to OSARC and attend all meetings. The Committee considers it has access to sufficient resources and engagement across the organisation to effectively carry out its duties.
OSARC’s effectiveness was reviewed in 2025-26 as part of the independent externally facilitated Board and Committee review, as described earlier in the Governance statement above.
Going forward, the Committee will continue to acknowledge and embrace its role in supporting the Board by providing an independent appraisal of the OS control environment, financial reporting, risk management and effectiveness of corporate governance, and for providing advice and challenge on risks that may adversely affect the business.
Internal Audit Opinion
Internal Audit assessed the systems of governance, risk management, and internal control, based on a programme of work reviewed and agreed by OSARC. This is undertaken in a co-sourced arrangement between OS’s in-house team and a third-party assurance provider who undertakes specialist reviews. The results of Internal Audit reviews, including assurance opinions and progress with implementing recommendations arising from that work were reviewed at each OSARC.
The Head of Internal Audit provided an annual opinion that partial assurance can be provided over the adequacy and effectiveness of OS’s systems of governance, risk management, and internal control, which is a significant improvement compared to 2024-25 where a limited assurance opinion was provided.
Internal Audit published fifteen assurance opinion-based reports (comprising one unsatisfactory, two limited, ten partial and two satisfactory opinions) and one advisory assignment.
Each recommendation arising from an audit is assigned a responsible owner and due date, which are actively monitored by Internal Audit, management and OSARC. Positive progress continues to be made in addressing actions. All high priority recommendations are receiving adequate management attention.
Managing conflicts of interest
The Board agrees and documents an appropriate system to record and manage actual and potential conflicts of interest.
Shareholder Framework Document
The OS Shareholder Framework Document (SFD) sets out the relationship between the Company, The Department for Science, Innovation and Technology (DSIT) as the Shareholder, and UK Government Investments as the Shareholder Representative. The Board operates in accordance with the SFD, which details the Company’s core responsibilities to the Shareholder, and describes the Company’s overall governance and accountability framework. The SFD also sets out how the day-to-day relationships works in practice.
The SFD defines Ordnance Survey’s role as the UK’s National Geospatial Authority, and its purpose to provide pioneering geospatial capability for the benefit of the United Kingdom helping to position the UK at the forefront of geospatial advancement, drive innovation and sustain prosperity and economic growth, and deliver geospatial infrastructure to support the UK economy, security and public services.
During 2025-26 a revised SFD was developed between the OS Board, DSIT, and UKGI, including the 4 strategic aims which inform the OS strategic plan, as summarised in the CEO report in the Strategic report. The revised SFD was published in 2025-26.
Attendance at Board and Committee meetings in 2025-26 was as follows:
| Board and Committee composition and attendance | Ordnance Survey Board | Committee membership | OSARC | Remuneration Committee | Nomination Committee |
|---|---|---|---|---|---|
| Total number of meetings | 7 | 5 | 4 | 4 | |
| Nick Bolton - Chief Executive Officer | 7/7 | 4/5 | 3/4 | 4/4 | |
| James Coppin - Shareholder Director, UKGI representative | 6/6 | Nomination - Remuneration - OSARC | 5/5 | 3/3 | 4/4 |
| Harry Hampson - Shareholder Director, UKGI representative | 1 / 1 | Nomination - Remuneration - OSARC | 0/0 | 1/1 | 0/0 |
| David Henderson - Chief Geospatial Officer | 7/7 | – | – | – | |
| Philippa Hird - Senior Independent Director, Remuneration Committee Chair | 5/7 | Nomination - Remuneration | – | 4/4 | 3/4 |
| Colin Hughes - Chair, Nomination Committee Chair | 7/7 | Nomination - Remuneration | 5/5 | 4/4 | 4/4 |
| Lynn Mawdsley - Non-Executive Director, OSARC Chair | 7/7 | Nomination - OSARC | 5/5 | - | 4/4 |
| Ron Mobed - Non-Executive Director | 6/7 | Nomination - Remuneration | – | 4/4 | 4/4 |
| Carol Potter - Non-Executive Director | 7/7 | Nomination - OSARC | 5/5 | - | 4/4 |
| Steve Showell - Chief Financial Officer | 6/7 | 4/5 | - | – | |
| Fiona Strens - Non-Executive Director | 7/7 | Nomination - Remuneration | – | 4/4 | 4/4 |
| Mike Yorwerth - Non-Executive Director | 7/7 | Nomination - OSARC | 4/5 | – | 3/4 |
| Notes |
| Harry Hampson was appointed as a director of the Company on 29 January 2026. |
| James Coppin resigned as a director of the Company on 29 January 2026. |
| Executive Directors attend Committee meetings by invitation. |
Directors’ report
Company number: 09121572
The Directors present the Annual Report and Accounts of Ordnance Survey Limited (the Company) and its subsidiaries (together the Group) for the year to 31 March 2026. The Company is domiciled and incorporated in the United Kingdom, the parent and ultimate controlling party of the Company is the Secretary of State for Science, Innovation and Technology.
The principal activity of the Company in the year to 31 March 2026 was the collection, maintenance and distribution of up-to-date geospatial information.
Financial highlights are included in the Strategic report.
Results and dividends
The results are set out in the statement of comprehensive income in the Financial statements. The Directors declared a final dividend to our shareholder of £7.7m (2024-25 £5.7m) in line with the dividend policy in the Shareholder Framework Document, to declare annual dividends of 50% of expected profit after tax.
Directors
The following Directors held office during the year ended 31 March 2026 and to the date of signing this report:
| Name | Position |
|---|---|
| Colin Hughes | Chair |
| Nick Bolton | Chief Executive Officer |
| Steve Showell | Chief Financial Officer |
| David Henderson | Chief Geospatial Officer |
| James Coppin OBE (until 29 January 2026) | Shareholder Director |
| Harry Hampson (from 29 January 2026) | Shareholder Director |
| Philippa Hird [Note 1] | Senior Independent Director |
| Lynn Mawdsley [Note 1] | Non-Executive Director |
| Ron Mobed [Note 1] | Non-Executive Director |
| Carol Potter [Note 1] | Non-Executive Director |
| Fiona Strens [Note 1] | Non-Executive Director |
| Mike Yorwerth [Note 1] | Non-Executive Director |
| Alyson Levett [Note 1] (from 1 May 2026) | Non-Executive Director |
| Note 1: Denotes independent directors |
Executive Directors
The following are Executive Directors, although they are not statutory Company Directors in accordance with the Companies Act 2006:
| Name | Position |
|---|---|
| Nick Giles OBE | Managing Director of OS Consumer |
| Leanne Upson | Chief Marketing Officer |
| Manish Jethwa | Chief Technology Officer |
| Hazel Hendley | Chief People Officer |
| Tina Kennedy (from September 2025) | Chief Customer Officer |
| John Kimmance (until March 2026) | Chief Customer Officer |
| Ash Wheeler | Chief Product Officer |
| Jon O’Meara | General Counsel and Company Secretary |
Further information about the Directors’ interests is provided in the Directors’ remuneration report.
Directors’ indemnities
The Company has made qualifying third-party indemnity provisions for the benefit of its Directors, which were made during the year and remain in force at the date of this report.
Research & development, and future developments
These are dealt with in the Strategic Report.
Corporate governance
The Company’s statement on Corporate Governance is dealt with in the section on our Governance.
Sustainability
Sustainability, including greenhouse gas emissions, is dealt with in the sustainability report in the Sustainability report.
Risk profile
These areas are dealt with in the Strategic report.
Financial risk management
The Group’s activities expose it to a number of financial risks including credit risk, cash flow risk and liquidity risk.
Credit risk
Credit risk manifests itself in the trade receivables balance, which is spread over a large and diverse customer base. The Group monitors the financial position of customers on initial application and on an ongoing basis. Provision is made for debts which are considered doubtful. At the year end, the Directors do not consider there to be any material unprovided credit risk.
Cash flow risk
The Group monitors cash flow risk by maintaining cash flow forecasts and ensuring that adequate underutilised cash facilities are maintained.
Supplier payments
During the year average days from invoice date to payment date for the Company was 32.1 days (2024-25: 26.2 days).
Foreign currency risk
Most Group business is transacted in sterling, although there are some large contracts transacted in US dollars. The international subsidiary also receives some payments in foreign currencies. The Group monitors the fluctuations on foreign currencies and will consider if the level of risk warrants further mitigations.
Political and Charitable contributions
No political donations were made in the year by the Company or Group. Charitable donations are reported in the section on Our governance.
Branches outside the UK
The Group has branches, as defined in section 1046(3) of the Companies Act 2006, outside the UK in the United Arab Emirates.
Going concern
After making enquiries, the Directors of the Company concluded that it has adequate resources to continue in operational existence for the foreseeable future. The Company has therefore adopted a going concern basis in preparing its financial statements.
Disabled employees
Applications for employment by disabled people are always fully considered, bearing in mind the skill set of the person against the criteria of the role. In the event of employees becoming disabled, every effort is made to ensure their employment with the Group continues and that appropriate support and training is arranged. It is the policy of the Group and the Company that the training, career development and promotion of disabled people should, as far as possible, be identical to that of other employees.
Employee collaboration
OS has developed a broad range of employee communications channels and mechanisms to make sure employees are informed, involved and engaged on everything concerning the current and future business. Employee engagement through communication ranges from broadcast communications, such as the daily updated OS intranet and an internal social media channel (Viva Engage at OS) through to dialogue-focused events such as CEO and Executive Director briefings, regular employee surveys, and regular listening sessions. OS recognises and works alongside Prospect and PCS trade unions.
Volunteering and fundraising
293 employees have used their volunteer day this year, contributing 2092 hours in our local communities. Over £30,576 has been raised by colleagues for charitable causes, including £25,196 for our corporate charity.
Independent auditors
So far as the Directors are aware, there is no relevant audit information (that is, information needed by the Company’s auditors in connection with preparing their report) of which the Company’s auditors are unaware. The Directors have taken all steps to make themselves aware of any relevant information and to establish that the Company’s auditors are aware of that information. Our framework document requires us to invite the Comptroller and Auditor General to be the external auditor, and the Comptroller and Auditor General has indicated his willingness to continue in office.
Authority of issue of financial statements
The Directors gave authority for the financial statements to be issued on 9 July 2026. Neither the Company’s owner nor others have the power to amend the financial statements after issue.
Approved by the Board and signed on its behalf by:
Nick Bolton
CEO
9 July 2026
Statement of Directors’ responsibilities
The Directors are responsible for preparing the Annual Report and the financial statements in accordance with applicable law and regulations.
Company law requires the Directors to prepare financial statements for each financial year. Under that law the Directors have elected to prepare the financial statements in accordance with UK adopted International Accounting Standards and the requirements of the Companies Act.
Under Company law, the Directors must not approve the financial statements unless they are satisfied that they give a true and fair view of the state of affairs of the Company, and of the profit or loss of the Company for that period. In preparing these financial statements, International Accounting Standard 1 requires that Directors:
- properly select and apply accounting policies;
- present information, including accounting policies, in a manner that provides relevant, reliable, comparable and understandable information;
- provide additional disclosures when compliance with the specific requirements in IFRSs are insufficient, to enable users to understand the impact of particular transactions, other events, and conditions on the entity’s financial position and financial performance; and
- make an assessment of the Company’s ability to continue as a going concern.
The Directors are responsible for keeping adequate accounting records that are sufficient to show and explain the Company’s transactions and disclose with reasonable accuracy at any time the financial position of the Company and enable them to ensure that the financial statements comply with the Companies Act 2006. They are also responsible for safeguarding the assets of the Company and hence for taking reasonable steps for the prevention and detection of fraud and other irregularities.
The Directors are responsible for the maintenance and integrity of the Group’s website. Legislation in the United Kingdom governing the preparation and dissemination of financial statements may differ from legislation in other jurisdictions. Having taken advice from the Audit Committee, the Directors consider that the Annual Report, taken as a whole, is fair, balanced, and understandable, and provides the information necessary for shareholders to assess the Company’s performance, business model and strategy.
Remuneration Committee report
Headline conclusions
- The Committee’s work this year supported delivery of the new strategy and operating model, with reward decisions designed to support business transformation, performance and long-term sustainability.
- Key decisions included changes to leadership incentives, approval of the 2025 pay award, development of benefits, and changes to recognition and pension-related arrangements.
- The Committee maintained a strong focus on culture, affordability and governance, while supporting attraction, retention and internal mobility through a period of significant change.
- Employee and representative feedback, including engagement with unions and staff forums, informed Committee discussions and helped shape decision-making, implementation and progress tracking.
This year has been shaped by business transformation, the move to a new operating model and delivery of the ambitions set out in year one of the new strategy. The Committee’s work has reflected these priorities, with a focus on reward decisions that support sustainable delivery, organisational effectiveness, and greater clarity for employees.
This report summarises the Committee’s key activities during the year and how it has complied with the relevant sections of OS’ Shareholder Framework Document.
Building on the strategic reset last year, OS has continued to focus on sustainable value creation in 2025-26. The strategic priorities of data, destinations and effectiveness are now embedded more firmly across the business, with operating model changes increasingly supporting delivery and capability. Wider economic conditions have continued to inform decisions, and OS has maintained a balanced approach to targeted investment to support long-term growth. These changes have also been supported by a broader cultural change programme focused on leadership behaviours, employee experience and ways of working.
Against this backdrop, the Committee’s work this year has centred on two themes: culture and performance.
Culture
Business transformation has remained a significant feature of the year. The new service-based operating model has now been implemented, resulting in the restructuring of a substantial number of teams to strengthen alignment to strategic priorities and improve organisational effectiveness. The Committee was pleased to see a continued focus on talent through these changes, including growing levels of internal mobility across the business.
The Committee also considered how employee views were taken into account through consultation and engagement activity during the year, including dialogue with recognised unions and broader staff engagement mechanisms. Feedback from employees and their representatives informed the development and implementation of proposals where relevant, and progress was monitored through regular updates so that emerging themes, concerns and practical impacts could be reflected in decision-making.
Within this context, the Committee took several key decisions during the year:
- The Committee approved terms for senior leadership roles in Customer and Technology as part of the transformation to a service-based operating model. It also approved terms for internal appointments into some of these roles and welcomed the continued commitment to internal talent.
- The Committee discussed the development of OS’ incentive and recognition schemes, and supported proposals to withdraw the SIPs scheme for the 2025-26 financial year in recognition of the strategic shift towards a partner-first customer model.
- The Committee approved changes to the Leadership Bonus scheme for 2025-26 so that strategic measures aligned more directly with the newly developed strategic plan and balanced scorecard, giving clearer line of sight to the multi-year plan. These changes support a more sustainable long-term approach to performance assessment.
- The Committee approved an increase to the upper limit of awards under the CEO Recognition Scheme to support more effective and timely recognition of outstanding contribution across the business. It also approved a strengthened Code of Practice and monitored use of the scheme during the year, noting an appropriate and well-governed distribution of awards across employee segments.
- The Committee considered the broader reward strategy during the year, including external thought leadership and benchmarking. In the context of a shift in pension arrangements and noting that the majority of employees are now members of the Horizon Pension Scheme, a particular focus was on strengthening benefits to maintain a modern and competitive offer that reflects a diverse workforce, and the Committee approved a strategic proposal to review and refresh benefits over the next three years to support attraction and retention.
- As part of the wider development of reward, the Committee approved proposals to introduce Bonus Sacrifice in 2025, providing Horizon-scheme employees with a streamlined way to pay bonus directly into pension at source. As part of a broader package of measures to support financial wellbeing and literacy, the scheme has helped employees improve retirement readiness and increase pension awareness.
Performance
The Committee has maintained a clear focus on ensuring that pay incentives remain closely linked to business performance. It has considered how OS’ remuneration strategy supports individual and collective performance through a period of sustained transformation and change. The Committee has also kept affordability and value under close review, while recognising the importance of attracting and retaining critical and specialist skills.
- In 2025, the Committee approved an employee pay award of 3% in the context of a more stable inflationary environment.
- We considered OS’ business performance in 2025-26 against the targets set in the annual all-employee bonus scheme, noting that the measure for the scheme – EBITDA – had been met. We therefore approved an on-target payout under the scheme, with awards expected to fall within the normal performance-related range of 0% to 10% depending on individual employee performance rating.
- The Committee also reviewed performance against the measures and targets set in the Leadership scheme for Directors and Level B roles. The Committee agreed that EBITDA gateway had been exceeded, and Revenue performance had met STE threshold but remained just below on-target performance. In relation to the Strategic Measures, the Committee made a detailed assessment of achievement, noting the progress made in strengthening OS’ positioning capability and resilience, delivery of key product and PSGA enhancements, important legacy product withdrawal steps, and continued development of NUAR. On this basis the Committee approved an appropriate payment under the scheme.
- The Committee also approved changes to the Remuneration Policy to reflect the refreshed Civil Service high-earner thresholds and reviewed its terms of reference to clarify policy accountability in line with the latest pay and job architecture.
Civil Service Pension Scheme Administration Transition
Following the transition of CSPS administration to Capita, OS has continued to support affected employees and engage with Cabinet Office and the administrator to resolve issues. Around 32% of employees remain in the scheme, with 19 cases impacted by delayed payments. OS has provided interim support, including £30k of transitional loans, and payments have begun to flow in some cases. OS remain actively engaged in resolution efforts and is maintaining a watching brief as service performance stabilises.
Looking ahead to 2026-27, the Committee’s focus will remain on developing a sustainable and effective reward approach that supports performance and delivery in line with the strategic ambitions. It will continue to evolve wider benefits, with particular attention to the way in which pension and financial awareness can support different employee segments appropriately. Having established the new operating model this year, the Committee will also look to develop effective sales incentive measures aligned to the new Customer Strategy to support sales and revenue performance.
Philippa Hird
Remuneration Committee Chair
Gender and career level breakdown
The table below provides a breakdown of employees and non-executive directors by career level and gender as at 31 March 2026. We are addressing the gender imbalance by promoting a culture where everyone feels welcome and valued, including in recruitment and leadership coaching.
| 2025-26 | 2025-26 | 2025-26 | 2024-25 | 2024-25 | 2024-25 | |
|---|---|---|---|---|---|---|
| Career Level | Male | Female | Total | Male | Female | Total |
| Non‑Executive | 4 | 4 | 8 | 4 | 4 | 8 |
| Executive Leadership Team | 8 | 3 | 11 | 8 | 2 | 10 |
| Heads | 13 | 5 | 18 | 15 | 5 | 20 |
| Senior Managers/ Professionals | 109 | 53 | 162 | 122 | 47 | 169 |
| Other roles | 772 | 389 | 1161 | 820 | 412 | 1,232 |
| Total | 906 | 454 | 1,360 | 969 | 470 | 1,439 |
Employee sickness absence
We monitor employee sickness absence and return-to-work interviews are held to ensure appropriate support or adjustments can be offered. We also reference external benchmarks to understand how our levels of sickness compare within similar UK organisations. According to figures from the Office of National Statistics, UK 2025 sickness absence rates are an average 4.4 days per worker.
| 2025-26 | 2025-26 | 2024-25 | 2024-25 | |
|---|---|---|---|---|
| Employee sickness absence | Total days lost due to sickness | Average sickness days lost per employee | Total days lost due to sickness | Average sickness days lost per employee |
| Total absences | 7,738 | 5.7 | 9,516 | 6.7 |
Off-payroll engagements
We disclose all off-payroll engagements which exceed six months and £245 per day. We use the services of contractors provided by third-party organisations to cope with peaks of demand on resources. Off-payroll engagements are managed in compliance with IR35 legislation. As at 31 March 2026, off-payroll engagements for more than £245 per day and that last for more than six months are as follows:
| 2025-26 | 2024-25 | |
|---|---|---|
| Number of existing engagements as at date | 5 | 11 |
| Number that have existed for less than one year at time of reporting | 2 | 3 |
| Number that have existed for between one and two years at time of reporting | 1 | 5 |
| Number that have existed for between two and three years at time of reporting | 0 | 1 |
| Number that have existed for three or more years at time of reporting | 2 | 2 |
| Number assessed as relevant to IR35 | 1 | 0 |
| Number assessed as not relevant to IR35 | 4 | 11 |
| Number engaged directly and are on payroll | 0 | 0 |
| Number of engagements reassessed for consistency/assurance purposes during the year | 5 | 11 |
| Number of off-payroll engagements of Board members and/or senior officials with significant financial responsibility through the financial year | 0 | 0 |
| Number of individuals on payroll and off-payroll that have been deemed Board members, and/or senior officials with significant financial responsibility, during the financial year | 19 | 20 |
Employee agreements
Non-Executive Directors have a three-year fixed-term tenure with the exception of the shareholder Non-Executive Director. Other Statutory Directors covered by this Annual Report hold appointments which are open ended until they reach retirement age. Their notice period is six months.
Statement of Directors’ remuneration (audited)
| 2025-26 | Salary & Fees £’000 | Pay in Lieu of Annual leave £000 [Note 1] | Performance-related pay £’000 [Note 2] | Benefits in Kind £’000 [Note 3] | Pension Benefits £’000 [Note 5] | Total £’000 |
|---|---|---|---|---|---|---|
| Nick Bolton [Note 4] | 277 | 6.4 | 63 | 0.2 | 33 | 380 |
| Steve Showell | 237 | 5.4 | 36 | 0.0 | 25 | 303 |
| David Henderson | 194 | - | 27 | 0.0 | 65 | 286 |
| Note 1: In March 2026 all employees were given the option to sell back unused Annual leave, with a maximum of 9 days. |
| Note 2: This bonus is paid in June 2026 and is accounted in and awarded for the 2025/26 Performance year. |
| Note 3: Benefits in kind is the monetary value of benefits in kind provided by the employer and treated by HM Revenue and Customs as a taxable emolument |
| Note 4: This figure for Nick Bolton salary earnings show the benefit from his 2024-25 (paid in January 2025) and 2025-26 Annual award base pay increases. |
| Note 5: Pension benefits for Nick Bolton and Steve Showell are based on employer pension contributions to a Defined Contribution pension scheme. For David Henderson it is a Defined Benefit scheme which displays the value of pension benefits accrued during the year (calculated as the real increase in pension multiplied by 20, plus the real increase in any lump sum, less the contributions made by the individual). |
| 2024-25 | Salary & Fees £’000 | Pay in Lieu of Annual leave £’000 [Note 1] | Performance-related pay £’000 [Note 2] | Benefits in Kind £’000 [Note 3] | Pension Benefits £’000 [Note 4] | Total £’000 |
|---|---|---|---|---|---|---|
| Nick Bolton | 262 | 3 | 82 | 0.3 | 26 | 373 |
| Steve Showell | 230 | - | 37 | - | 25 | 292 |
| David Henderson | 188 | - | 28 | - | 107 | 323 |
| Note 1: Table restated from last year to include Pay in Lieu of Annual leave. In March 2025 all employees were given the option to sell back unused Annual leave, with a maximum of 9 days. |
| Note 2: This bonus is paid in June 2025 and is accounted in and awarded for the 2024/25 Performance year. |
| Note 3: Benefits in kind is the monetary value of benefits in kind provided by the employer and treated by HM Revenue and Customs as a taxable emolument. |
| Note 4: Pension benefits for Nick Bolton and Steve Showell are based on employer pension contributions to a defined contribution pension scheme. Table restated to include David Henderson Defined Benefit scheme which displays the value of pension benefits accrued during the year (calculated as the real increase in pension multiplied by 20, plus the real increase in any lump sum, less the contributions made by the individual). |
Directors’ defined benefit pensions (audited)
2025-26 One director was in receipt of a defined benefit pension.
2024-25 One director was in receipt of a defined benefit pension.
| 2025-26 PCSPS & CSOPS Pension scheme | Accrued pension at pension age as at 31 March 2026 £’000 | Real increase in pension & related lump sum at pension age £’000 | CETV [Note 1] at 31 March 26 2026 £’000 | CETV at 31 March 25 £’000 | Real increase in CETV £’000 |
|---|---|---|---|---|---|
| David Henderson | 75 - 80 | 2.5 - 5 | 1,564 | 1,431 | 42 |
| Note 1: The cash equivalent transfer value (CETV) is the amount the current pension scheme will offer an individual if they want to transfer out of the defined benefit pension and into a defined contribution scheme. |
Please note member with benefits derived from both PCSPS and CSOPS are combined, the benefits have been added together in the summary displayed above.
Accrued pension benefits included in this table for the individual affected by the Public Service Pensions Remedy have been calculated based on their inclusion in the legacy scheme for the period between 1 April 2015 and 31 March 2022, following the McCloud judgment. The Public Service Pensions Remedy applies to individuals that were members, or eligible to be members, of a public service pension scheme on 31 March 2012 and were members of a public service pension scheme between 1 April 2015 and 31 March 2022. The basis for the calculation reflects the legal position that impacted members have been rolled back into the relevant legacy scheme for the remedy period and that this will apply unless the member actively exercises their entitlement on retirement to decide instead to receive benefits calculated under the terms of the Alpha scheme for the period from 1 April 2015 to 31 March 2022
| 2024-25 PCSPS & CSOPS Pension scheme | Accrued pension at pension age as at 31 March 2025 £’000 | Real increase in pension and related lump sum at pension age £’000 | CETV at 31 March 25 £’000 | CETV at 31 March 24 £’000 | Real increase in CETV £’000 |
|---|---|---|---|---|---|
| David Henderson | 70 - 75 | 5 – 7.5 | 1,431 | 1,288 | 86 |
Performance-related pay
The Executive Directors performance incentive scheme has a maximum opportunity of 20% of gross annual base salary received. The Remuneration Committee reviewed the terms of the scheme and agreed that measures for 2025-26 should incentivise:
- Corporate performance, focussing on EBITDA & revenue
- Strategic targets to focus on delivery of key contracts and strategies as well as consideration of Environmental, Societal and Governance elements and Employee Engagement. The Remuneration Committee exercises its discretion to determine the extent to which Strategic Measures are achieved.
- Specific personal targets.
The following weightings were applied to reward positive behaviours with business units and expert functions being mutually dependent on each other:
| Measure | Weighting |
|---|---|
| Corporate | 60% |
| Strategic | 15% |
| Personal | 25% |
Fair pay disclosure (audited)
Reporting bodies are required to disclose the relationship between the salaries of the most highly paid Director in their organisation and the median earnings of the organisation’s workforce.
Financial Year 2025-26
- The salary and taxable benefits excluding pension of the Company’s most highly paid Director on a full year equivalent basis was £340,807
- This amount represents 6.99 times the median salary and taxable benefits of the workforce, which was £48,644
- The range of salaries was £23,810 to £340,807
Financial Year 2024-25
- The salary and taxable benefits excluding pension of the Company’s most highly paid Director on a full year equivalent basis was £344,334
- This amount represents 7.47 times the median salary and taxable benefits of the workforce, which was £46,036
- The range of salaries was £23,113 to £344,334
| Pay ratio of highest paid director to employees | Pay ratio of highest paid director to employees | Pay ratio of highest paid director to employees | For highest paid director | For highest paid director | For all employees | For all employees | |
|---|---|---|---|---|---|---|---|
| @25th percentile | @median | @75th percentile | % change in salary and allowances | % change in performance pay and bonuses payable | Average % change in salary and allowances | Average % change in performance pay and bonuses payable | |
| 2025-26 | 8.83:1 £38,609 | 7.01:1 £48,644 | 5.55:1 £61,381 | 5.62% | -22.22% | 4.20% | 11.64% |
| 2024-25 | 8.97:1 £38,369 | 7.47:1 £46,036 | 5.80:1 £59,312 | 0.87% | 30.71% | 7.40% | 2.20% |
Fair Pay tables have been restated from last year, to include Pay in Lieu of Annual leave. In March 2025 all employees were given the option to sell back unused Annual leave, with a maximum of 9 days.
Pay ratio of highest paid director to employees (excluding benefits)
| @25th percentile | @median | @75th percentile | |
|---|---|---|---|
| 2025-26 | 8.89:1 £38,325 | 7.00:1 £48,629 | 5.55:1 £61,362 |
| 2024-25 | 9.32:1 £36,923 | 7.54:1 £45,637 | 5.82:1 £59,147 |
High earners threshold
The Civil Service guidance on Senior Pay 2025 sets out the following revised thresholds:
- Total remuneration over £174,000; and/or
- Performance related pay (bonus) arrangements that exceed £25,000.
Employees defined as high earners include those individuals listed within the Directors’ Remuneration Report.
The number of employees who were paid Remuneration or Bonuses over the threshold are as follows:
| 2025-26 | 2025-26 | 2024-25 | 2024-25 | |
|---|---|---|---|---|
| Total no. Eees paid above the Senior Pay threshold (+£174,000 FTE) | Total no. of Eees awarded performance pay above the Senior pay threshold (+£25,000) | Total no. Eees paid above the Senior Pay threshold (+£174,000 FTE) | Total no. of Eees awarded performance pay above the Senior pay threshold (+£25,000) | |
| Total | 5 | 4 | 4 | 5 |
Non-Executive Directors (audited)
- The Non-Executive Chair (Colin Hughes); and the Shareholder Non-Executive Director (Harry Hampson) are appointed directly by the Secretary of State for DSIT.
- The remaining Non-Executive Directors (Philippa Hird, Ron Mobed, Carol Potter, Lynn Mawdsley, Fiona Strens and Michael Yorwerth) are appointed by the Board of Directors of Ordnance Survey Limited, on the recommendation of the Nomination Committee and approval of UKGI. Their remuneration and terms of appointment are agreed at the time of their appointment, which is normally for three years with the option for this to be extended for a further three years. By exception and on completion of the three-year optional period, any further extension is offered under mutually agreed terms.
Payments to Non-Executive Directors
Ordnance Survey Non-Executive Directors are not Ordnance Survey employees and are not members of the Principal Civil Service Pension Scheme nor the OS Horizon Group Personal Pension Plan. Their remuneration is paid after deduction of PAYE and NIC through the Ordnance Survey payroll. The Shareholder Director is remunerated by their employer UKGI.
Remuneration paid to Non-Executive Directors was as follows:
| 2025-26 Remuneration £’000 | 2025-26 BIK £’000 | 2024-25 Remuneration £’000 | 2024-25 BIK £’000 | |
|---|---|---|---|---|
| Colin Hughes (from 9 March 25) | 50 | 0.3 | 3 | 0.1 |
| Stephen Lake (until 8 March 25) | - | - | 47 | 3.3 |
| Philippa Hird | 28 | 0.9 | 28 | 1.3 |
| Ron Mobed | 28 | 0.1 | 28 | 0.2 |
| Carol Potter | 28 | 0.9 | 28 | 1.5 |
| James Coppin (until 29 January 26) | - | 0.1 | - | 0.5 |
| Harry Hampson (from 29 January 26) | - | - | - | - |
| Fiona Strens | 28 | 2.1 | 28 | 1.3 |
| Michael Yorwerth | 28 | 0.4 | 28 | 0.8 |
| Lynn Mawdsley | 28 | 0.6 | 28 | 1.2 |
| Note: Non-Executive Directors are permitted to claim travel and accommodation costs between home and their usual work location. This is included in the BIK figure. |
The inclusion of a Directors’ remuneration report containing information about the salary and benefits of the senior managers and key decision makers at Ordnance Survey is voluntarily reported. The actual salary, performance-related pay and benefits details of each Director form the audited elements of this report, as referred to in the Independent Auditor’s Report, which can be found in the Annual Accounts.
The remaining elements are unaudited.
Directors’ emoluments
| 2025-26 | 2024-25 | |
|---|---|---|
| £’000 | £’000 | |
| Salaries and other short-term employee benefits | 1,069 | 1,045 |
| Pension contributions charges in year – defined benefits | 65 | 54 |
| Pension contributions charged in year – defined contribution | 58 | 51 |
| Highest paid director | 347 | 344 |
Early release costs provided for in financial year
All early release payments were made in line with employee contractual entitlements and not above. For leavers who joined OS pre April 2015, Redundancy and other departure costs have been paid in accordance with the provisions of the Civil Service Compensation Scheme made under the Superannuation Act 1972.
| 2025-26 | 2024-25 | |
|---|---|---|
| Less than £10,000 | 5 | 20 |
| £10,000 - £25,000 | 6 | 13 |
| £25,001 - £50,000 | 1 | 8 |
| £50,001 - £100,000 | 8 | 28 |
| £100,001 - £150,000 | 2 | 5 |
| £150,001 - £500,000 | - | 2 |
| Total number of exit packages | 22 | 76 |
| Total cost £’000 | 963 | 3,872 |
Early release costs are accounted for as described in note 1.13. Where the Group has agreed early retirements, the additional costs are met by the Group and not by the Civil Service Pension Scheme.
Section 3 - Sustainability report
OS has produced climate‑related financial disclosures in line with TCFD recommendations for the fourth consecutive year, covering governance, risk management, strategy, and metrics and targets. All disclosures are included in this document, and over the past year we have continued to strengthen our risk management processes.
Governance and risk management
| TCFD req. | Ordnance Survey Disclosure |
|---|---|
| Governance a. | Governance bodies and individuals responsible for climate-related risks and opportunities as well as the Board’s oversight of these risks and opportunities |
| Governance b. | Management’s role in assessing and managing risks and opportunities |
| Risk Management a. | Process for identifying and assessing climate-related risks within the Sustainability Steering Group (SSG). |
| Risk Management b. | Process for managing climate-related risks within the SSG, and how this relates to the organisation-wide risk management process. |
| Risk Management c. | How the climate-related risks feed into the Tier 1 Operational Risk, which is reported at OSARC under organisation-wide risk management. |
The Board is engaged in sustainability by reviewing a detailed sustainability report at least once a year and by regularly assessing the overall sustainability risk at OSARC. The risks are governed through a three-tiered structure. The tier 1 risk was deemed a strategic risk at the start of 2025-26 but downgraded to an operational risk in Q4 following consistent mitigation controls and is monitored by OSARC. Tier 2 risks are aligned to TCFD and governed by the Financial Controller and Sustainability Lead who are both Sustainability Steering Group (SSG) members. Tier 3 risks are the environmental management risks owned by an accountable SSG member. SSG includes members from key business areas including Finance, Procurement, Legal, People, Consumer, Marketing and Customer, with ELT membership being critical. SSG members are also accountable for sustainability targets.
| Date of SSG | Present Representatives |
|---|---|
| 29 May 2025 | External Affairs, Finance, Legal, People, Procurement, Product |
| 9 July 2025 | Consumer, Customer, Finance, Legal, Marketing, People, Procurement, Product |
| 17 September 2025 | Consumer, Customer, External Affairs, Finance, Legal, Marketing, People, Procurement, Product, Production, Technology |
| 20 November 2025 | Consumer, Finance, Legal, People, Procurement, Product, Production |
| 26 January 2026 | Consumer, External Affairs, Finance, Legal, Marketing, People, Procurement, Production |
| 2 April 2026 | Consumer, Finance, Marketing, People, Procurement, Product, Production, Technology |
Tier 3 risks feed into tier 2 risks which subsequently feed into the tier 1 risk. The risk structure, developed in 2024-25, is detailed below.
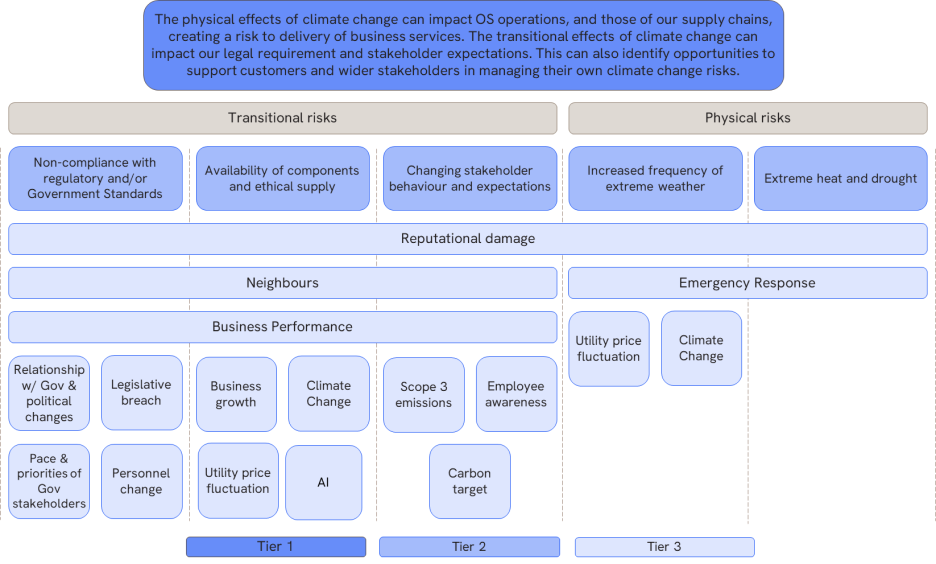
Throughout 2025-26 a framework has been developed which spans TCFD and environmental management opportunities. As with the risks, the environmental management opportunities are owned and actioned by an accountable SSG member. Each of these opportunities feeds into the tier 2 opportunities which are covered in more detail within this report. Now that we have baselined, we will seek to deliver continuous improvement in risk and opportunity reporting.
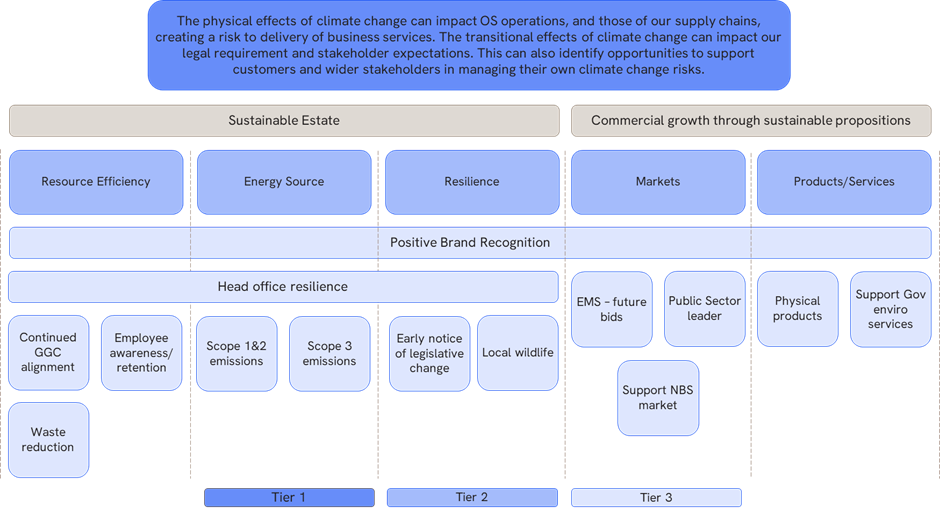
Budgets are agreed through the Annual Operating Plan and Budget (AOPB) process in collaboration with the relevant Finance Business Partner. The sustainability budget is held by the Sustainability Lead and overall agreed and endorsed by the Chief People Officer.
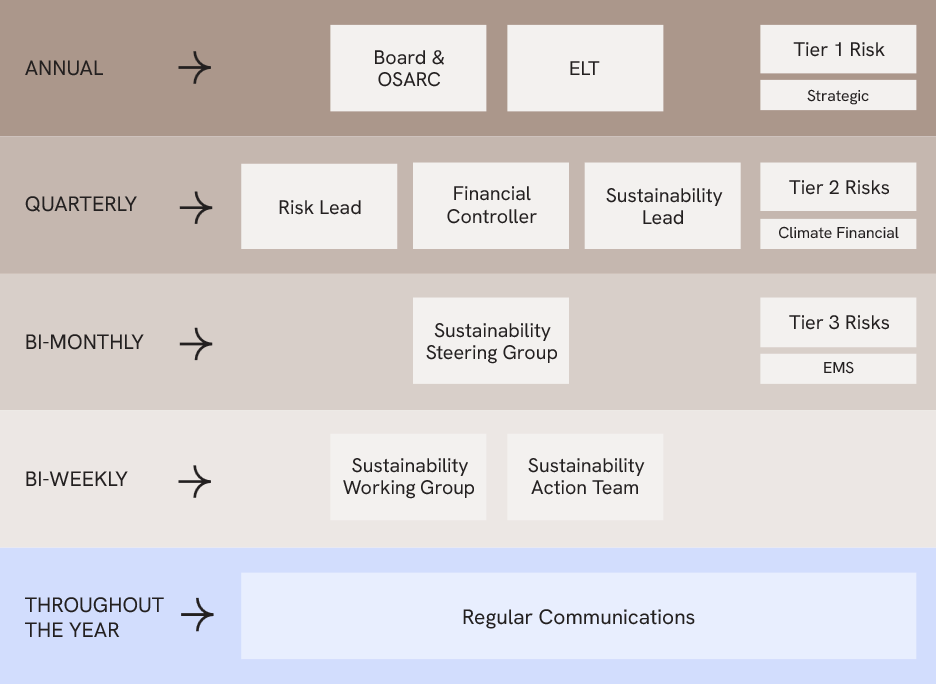
Climate-related risks and opportunities (Tier 2 risks)
| TCFD req. | Ordnance Survey Disclosure |
|---|---|
| Strategy a. | Tier 2 risks and opportunities identified by OS. For each the potential impact, time horizons and materiality are detailed. |
| Strategy b. | In all cases identified mitigations and actions are discussed showing how decision-making and relevant financial investment is influenced. |
| Strategy c. | In all cases two climate scenarios have been considered, a less than 2° warming scenario, and a more than 2° warming scenario. |
The climate-related risks and opportunities identified by OS can be seen in the tables below, including the potential impacts identified, the materiality, and the strategic response for ensuring resilience. How opportunities have influenced our strategy and outcomes is explored within the later section Innovation: Supporting our Customers.
The process for identifying, managing, and mitigating climate-related risks is the same as for all strategic risks, and is described within the Governance Statement, with review timelines as set out in the Sustainability Governance framework above.
Climate-related risks
| Headline | Non-compliance with regulatory standards and/or Government standards (Transition: Policy, Legal and Market) |
|
| Potential impact | • Exposure to litigation • Penalty payments / fines • Enhanced emissions-reporting obligations • Mandates on and regulation of existing products and services • Loss of business through reputation damage• Increased compliance costs and reduced demand |
|
| Scenario | <2° scenario | >2° scenario |
| Timescales impacted | Short, Medium & Long | Short, Medium & Long |
| Potential financial impact on the business | Cost: Quantifiable Immaterial (<£3m pa) The cost to maintain regulatory compliance is currently immaterial, however in order to achieve a sub 2° scenario, regulatory expectation and potential subsequent fines could be significant. |
Cost: Quantifiable Immaterial (<£3m pa) The cost to maintain regulatory compliance is currently immaterial. Less stringent regulatory expectations and potential subsequent fines are likely to be associated with more rapid climate change. |
| Mitigation / resilience discussion | • Robust environmental legal review procedure for assessment of changing or upcoming legislative requirements (on products, services and/or operations) • Audited internally and externally via our ISO 14001 certified management system • Regular reporting to OSARC (OS Audit and Risk Committee) on potential litigation |
|
| Headline | Availability of components and ethical supply (Transition: Technology) |
|
| Potential impact | • Business disruption; associated costs (financial or reputational) of delayed contract deliverables. • Increased costs of high demand, low availability components. • Additional costs if administering ethical supply. • Geopolitical impact on availability of components and ethical supply |
|
| Scenario | <2° scenario | >2° scenario |
| Timescales impacted | Short | Medium & Long |
| Potential financial impact on the business | Cost: Quantifiable Immaterial (<£3m pa) A faster transition is required to achieve a sub 2° scenario which will reduce availability of components in the short term, we anticipate that the impact will be immaterial. |
Cost: Quantifiable Immaterial (<£3m pa) A slower transition is likely to result in a greater than 2° scenario, therefore the immaterial cost impact is likely to be seen in the medium to long term, with less pressure on availability. |
| Mitigation / resilience discussion |
In place/ongoing mitigations • Supplier due diligence conducted to test sustainability credentials and business continuity plans • Actively manage our direct supply chain Planned mitigations • Forward looking strategic review of technology and how it can be applied to create efficiencies e.g. future capability roadmap – short term • Diversify supply chain – medium term |
|
| Headline | Changing stakeholder behaviour and expectations (Transition: Market and Reputation) |
||
| Potential impact | • Diminished competitive position/limitations of commercial growth • Reduced demand • Increased costs to adapt to new demands • Not meeting customer expectations • Changing shareholder priorities impact on strategic direction |
||
| Scenario | <2° scenario | >2° scenario | |
| Timescales impacted | Medium & Long | Long | |
| Potential financial impact on the business | Cost: No meaningful quantification The potential financial impact on the business is not currently quantifiable. |
Cost: No meaningful quantification The potential financial impact on the business is not currently quantifiable. |
|
| Mitigation / resilience discussion |
In place/ongoing mitigations • New geospatial solutions in response to new demands – in place, short & medium term • Ensure products align with OS values – in place, short & medium term Planned mitigations • Stay at the forefront of sustainability reporting – short term |
||
| Headline | Increased frequency of extreme or unsettled weather (Physical risks: Acute & Chronic) |
|
| Potential impact | • Increased insurance and repair costs • Damage to local infrastructure • Business disruption including data collection (Field Surveying, data towers and Flying Programme - particularly with unsettled, cloudy weather) • Increased frequency of power outages and power surges causing loss of critical equipment • International impacts within supply chains • Reduced output from solar |
|
| Scenario | <2° scenario | >2° scenario |
| Timescales impacted | Medium | Short & Medium |
| Potential financial impact on the business | Cost: No meaningful quantification In a sub 2° scenario the potential financial impact on the business is not quantifiable. |
Cost: Quantifiable Immaterial (<£3m pa) In a greater than 2° scenario the potential financial impact on the business is quantifiable but immaterial and likely to impact in the short to medium term. For example, through more power outages. |
| Mitigation / resilience discussion |
In place/ongoing mitigations • Hybrid working to increase flexibility following location specific extreme weather events • Enhanced data collection when good weather permits • On-site generator, 2-4 days contingency • Support our own data with third party data sources – in place, short & medium term Planned mitigations • Diversify supply chain – medium term |
|
| Headline | Extreme heat and drought (Physical risks: Chronic) |
|
| Potential impact | • Reduced productivity • Increased cooling energy consumption • Increased mains water consumption with reduced harvested rainwater • Increased maintenance due to overheating (data servers at risk) • Business & local infrastructure disruption • Business disruption including data collection (Field Surveying • International impacts within supply chains |
|
| Scenario | <2° scenario | >2° scenario |
| Timescales impacted | Medium | Medium & Long |
| Potential financial impact on the business | Cost: Quantifiable Immaterial (<£3m pa) The anticipated financial impact from chronic physical risks is quantifiable but expected to be immaterial. |
Cost: Quantifiable Immaterial (<£3m pa) The anticipated financial impact from chronic physical risks is quantifiable but expected to be immaterial. |
| Mitigation / resilience discussion |
In place/ongoing mitigations • Flexible working policies to work around the heat • On-site rainwater harvester • Hybrid working allows people to work comfortably in extreme heat • Ground Source Heat Pump (GSHP) used to provide cooling to head office • Business continuity planning – in place, short & medium term Planned mitigations • Diversify supply chain – medium term |
|
Climate-related opportunities
| Headline | Sustainable Estate (Resource efficiency, energy source & resilience) |
|
| Potential impact | • Reduce energy use and cost • Increased energy source independence and resilience • Reduce water use and cost • Reduce Scope 1 & 2 emissions • Enhance stakeholder awareness • Improve biodiversity at Head Office • Early identification of legislative requirements • Encourage EV adoption and active travel through infrastructure and facility provision |
|
| Scenario | <2° scenario | >2° scenario |
| Timescales impacted | Short & Medium | Short & Medium |
| Potential financial impact on the business | Cost and income: Quantifiable Immaterial (<£3m pa) Some projects will have no quantifiable impact, such as employee engagement, however the greatest impact while quantifiable is expected to be immaterial. |
Cost and income: Quantifiable Immaterial (<£3m pa) Some projects will have no quantifiable impact, such as employee engagement, however the greatest impact while quantifiable is expected to be immaterial. |
| Mitigation / resilience discussion |
In place/ongoing mitigations • Green gas tariff on-site • On site solar PV generation, potential opportunity for additional on-site generation • Energy efficient technologies e.g. GSHP, LED lighting, rainwater harvester, efficient taps and hand dryers etc. • Electric vehicle chargers on-site for employees and visitors – in place, expansion in medium term • 100% recycled paper used on-site & reduced on-site printer fleet – in place • Internal carbon offset strategy – in place now, further development short & medium term • Sustainable Action Team, Gardening Club and Wildlife Club for employee engagement • Continuous development of biodiversity initiatives (e.g. grass management, allotments and composter, swift bricks, on-site pond etc.) – in place now, short & medium term Planned mitigations • Move back to a 100% renewable electricity tariff on-site from 1 April 2026 • Investigating decarbonisation of boilers – medium term • Targeting a 100% EV fleet by end of 2027 – medium term • All the above feed into our strategy for Net Zero by 2050 in alignment with UK Government – long term |
|
| Headline | Commercial growth through sustainable propositions (Products/services & markets) |
||
| Potential impact | • Preferred supplier/ opportunity to win bids supported by sustainability credentials • Efficiencies from repurposing existing products and services • Reducing customer environmental impact through geospatial services • Potential to support the nature-based solutions market in future • Physical products can support responsible use of the outdoors |
||
| Scenario | <2° scenario | >2° scenario | |
| Timescales impacted | Short & Medium | Medium & Long | |
| Potential financial impact on the business | Cost and Income: Quantifiable Material (£3m - £9m pa) Supporting location based data is more likely to be needed in the short term to achieve a sub 2° scenario. In the short to medium term cost and associated revenue are expected to be quantifiable and material. |
Cost and Income: Quantifiable Material (£3m - £9m pa) Supporting location based data is more likely to be needed in the longer term if a sub 2° scenario is not achieved. In the medium to long term cost and associated revenue are expected to be quantifiable and material. |
|
| Mitigation / resilience discussion |
In place/ongoing mitigations • Ensure that OS products are aligned to values • Supported by OS, many Geovation start-ups innovate ways to enhance the environmental sector – in place, short, medium & long term • Support Government in delivering environmental solutions through the PSGA - in place, short and medium term Planned mitigations • Carbon Credit Policy to ensure robust, value add credits which support the nature-based solutions are sought in future - medium and long term |
||
Targets, progress and metrics
| TCFD req. | Ordnance Survey Disclosure |
|---|---|
| Metrics and Targets a. | Discloses the metrics relevant to the assessment of climate-related risks and opportunities. |
| Metrics and Targets b. | Discloses Scopes 1, 2 and some 3 categories. Supply chain emissions are disclosed under ‘A sustainable supply chain’. |
| Metrics and Targets c. | OS is committed to achieving Net Zero by 2050 in alignment with UK Government. Interim targets are set in alignment with the Greening Government Commitments. |
Ordnance Survey Targets
OS is committed to achieving Net Zero by 2050 in line with UK Government targets. We have set interim goals aligned with the Greening Government Commitments (GGCs) to 2030. Although OS is now out of scope of the GGC framework, we continue to use these commitments to guide progress. OS also maintains a Carbon Offsetting Policy to ensure any residual emissions offset in the future are responsibly done so in line with our values and UK Government expectations.
Sustainability at Explorer House
Powering Head Office with clean energy
Built to BREEAM Excellent standard in 2010, our Head Office, Explorer House, has undergone significant sustainability upgrades in recent years. Improvements include smart LED lighting, solar PV installation and enhancements to the ground source heat pump. We are now assessing further opportunities with may include boiler decarbonisation or expanding our solar capacity.
Environmental Management System
Our Environmental Management System (EMS) maintained its ISO 14001 certification with BSI (EMS 741488), reflecting another strong year of performance. Ongoing audits continue to reinforce our sustainability ambition and strengthen our processes. Employee engagement remains central to the EMS, led by our Sustainability Action Team. This year they focused on biodiversity and volunteering at Head Office, including work on the onsite allotments, as well as partnering with Chief Technology Officer Manish Jethwa to deliver four successful repair café events promoting a circular economy mindset.
Biodiversity: Nature Recovery Plan
Following the development of our Nature Recovery Plan in 2023, we have delivered a range of biodiversity initiatives. This year’s work included further enhancement of our wildlife pond and commissioning of ecology surveys to assess biodiversity net gain and guide future actions. The results show that our prior actions have had a positive impact on breeding birds. Throughout the year, employees were able to support these activities through targeted volunteering opportunities.
Metrics
The following section outlines the metrics underpinning our TCFD reporting, the methodologies used to calculate them, and, where relevant, the drivers of yearonyear changes.
A sustainable supply chain
We embed sustainability in our procurement process by including sustainability questions in all tender documentation, applying our Supplier Due Diligence Questionnaire, and requiring compliance with the Climate Clause in our Supplier Code of Conduct.
We began engaging with the Carbon Disclosure Project (CDP) in 2022–23 to strengthen understanding of supply chain emissions, inform a robust carbon target, and identify how best to support suppliers.
In 2025–26, we requested CDP carbon questionnaire responses from our 143 top spend suppliers, representing 85% of total spend. As in previous years, royalties were excluded in line with the Greenhouse Gas (GHG) Protocol Scope 3 Supplementary Guidance. We achieved a 62% response rate (up from 55%), covering 77% of total spend.
A total footprint of 2,829 tCO2e resulted from CDP-recommended methodology for respondents, CDP Activity conversion factors from requested non-respondents, and the generic factor for specialised professional services for remaining spend. Reported supplier data will always lag a year due to disclosure processing timelines.
| Supply Chain Emissions | 2025-26 | 2025-26 | 2025-26 | 2024-25 (restated [Note]) | 2023-24 | 2022-23 |
|---|---|---|---|---|---|---|
| Number suppliers | Proportion spend | Emissions (tCO2e) | Emissions (tCO2e) | |||
| Requested - submitted | 88 | 77% | 2,390.83 | 2,939.95 | 1902.91 | 3,345.29 |
| Requested - no response | 55 | 8% | 232.77 | 351.30 | 321.75 | 456.76 |
| Not requested | 430 | 15% | 205.02 | 154.52 | 368.93 | 244.34 |
| Total | 573 | 100% | 2,828.62 | 3,445.77 | 2593.59 | 4,046.39 |
| Note: the 2024-25 figures have been restated from the prior year reported data following an updated release of CDP conversion factors in 2025 which has been used to re-calculate the emissions for the 2024-25 reporting period. |
| Data Point | Previously Reported | Restated | Change |
|---|---|---|---|
| Requested - submitted | 2,309.45 | 2,939.95 | + 630.50 |
| Requested - no response | 344.42 | 351.30 | + 6.88 |
| Not requested | 153.30 | 154.52 | + 1.22 |
| Total | 2,807.17 | 3,445.77 | + 638.60 |
OS achieved a Climate Change score of C for our 2025 disclosure to CDP which is the awareness level for environmental reporting and performance. This is consistent with the average of our activity group, and we aim to increase this over time. OS also achieved a Supplier Engagement Assessment score of B.
Methodology
Greenhouse gas emissions in this report are calculated using UK Government conversion factors for each relevant activity. Where a marketbased factor has been applied, this is marked with an asterisk.
Emissions from gas and electricity have been influenced by a change in OS’s ownership share in Dennis Maps. In August 2025, Ordnance Survey increased its holding from 25% to 100% which results in Dennis Maps’ total scope 1 and 2 emissions being included in the Group report.
| Absolute metrics | Scope/Emission/energy use | 2025-26 | 2024-25 | 2023-24 |
|---|---|---|---|---|
| Non-financial indicators (tCO2e) | Total Scope 1 emissions (gas, fuel for fleet cars and fugitive emissions from air chillers) [Note 1] | 181.7 | 301.7 | 275.5 |
| Scope 2 emissions attributed to electricity utilities (off-site electricity generation) [Note 2] | 541.9 | 472.5 (restated) | 18.6 | |
| Scope 2 emissions attributed to PHEV & EV fleet (off-site electricity generation) | 59.7 | 56.8 | 71.7 | |
| Total Scope 3 emissions (transmission loss of electricity) | 73.6 | 63.7 | 61.0 | |
| Total emissions attributed to electricity consumption (Scope 2 and 3) | 675.2 | 593.0 (restated) | 151.3 | |
| Emissions attributable to Scope 3 official business travel (rail, taxi, air, underground, personal vehicles use for business travel) | 123.0 | 224.1 | 410.5 | |
| Emissions attributable to Scope 3 Managed Assets (inc. utility consumption by Explorer House Tenants (23-24 onward)) | 48.9 | 49.9 (restated) | 18.6 | |
| Emissions attributable to Scope 3 Managed Assets (Surveying aircraft) | 285.8 | 325.5 | 279.2 | |
| Total emissions (all scopes) | 1,314.6 | 1,494.2 (restated) | 1,135.1 |
| Note 1: The Scope 1 emissions from gas at Explorer House for 2025-26 have been calculated using a location-based conversion factor for RGGO certified biogas of 0.22gCO2e per kWh. This methodology improves accuracy. If natural gas were used, the total Scope 1 emissions from gas at Explorer House would be 68.40 tCO2e. |
| Note 2: The Scope 2 emissions from electricity at Explorer House, and GeoHub for 2025-26 have been calculated using a market-based conversion factor of 135gCO2e per kWh. If a location-based calculation methodology were used, the Scope 2 emissions for Explorer House and GeoHub would be 735.21 tCO2e. |
Prior year restatement – correction to Scope 2 emissions reporting
During the year, the Group identified an error in the calculation of previously reported Scope 2 carbon emissions relating to electricity consumption in the prior period (FY 24-25). During our reviews it was identified that in April 2024, our HQ electricity tariff was auto renewed onto a standard tariff, and away from the renewable tariff as we had previously been on. As we calculate our emissions using an assumed zero emissions factor associated with a 100% renewable electricity, we subsequently understated our Scope 2 emissions and electricity-related Scope 3 emissions in the prior year. Comparative figures for FY 24-25 have been restated to reflect the actual number for the prior year. The tariff has now been corrected, and we are once again on the fully renewable electivity tariff from April 2026. There is no long-term impact as result of this misstatement on our net zero projections
Reconciliation of previously reported to restated figures
The impact of the correction on Scope 2 emissions, electricity-related Scope 3 emissions and supply chain emissions for P2024-25 is set out below:
| Data Point | Previously Reported | Restated | Change |
|---|---|---|---|
| Scope 2 emissions attributed to electricity utilities (off-site electricity generation) | 9.0 | 472.5 | + 463.5 |
| Total emissions attributed to electricity consumption (Scope 2 and 3) | 129.5 | 593.0 | + 463.5 |
| Emissions attributable to Scope 3 Managed Assets (inc. utility consumption by Explorer House Tenants) | 11.4 | 49.9 | + 38.5 |
| Total emissions (all scopes) | 992.2 | 1,494.2 | + 502.0 |
There is no impact on reported financial performance, including revenue, EBITDA or cash, and therefore no impact on the Group’s financial statements.
| Absolute metrics | Scope/Emission/energy use | 2025-26 | 2024-25 | 2023-24 |
|---|---|---|---|---|
| Self-Generated Energy Consumption (kWhth) | Heat from renewable sources (Ground source heat pump) - Scope 1 | 1,436,200 | 1,291,200 | 1,387,200 |
| Related Purchased Energy Consumption (kWh) | Electricity (E.H., Dennis Maps & GeoHub) | 4,290,573 | 3,762,428 | 3,681,569 |
| Gas (E.H. & Dennis Maps) | 632,540 | 716,701 | 316,826 | |
| TOTAL kWh Consumption | 4,923,113 | 4,479,129 | 3,998,395 | |
| Financial Indicators (£) | Expenditure on Energy (Gas, Electricity, BUS fuel, GeoHub electricity, Aircraft fuel) | £1,055,266 | £1,115,367 | £1,030,556 |
| Expenditure on official business travel (rail, hire cars, taxis, air, BUS leasing) | £2,041,927 | £2,868,630 | £2,534,790 | |
| TOTAL expenditure on energy and official business travel | £3,097,193 | £3,983,997 | £3,565,346 |
| Normalised metrics | Asset | 2025-26 | 2024-25 | 2023-24 |
|---|---|---|---|---|
| kWh/m2 | Explorer House | 294.8 | 283.5 | 254.7 |
| tCO2e/FTE | All Emissions | 1.0 | 0.7 | 0.8 |
| g CO2e/km travelled | BUS mileage including hire vehicles (kilometres) | 43.2 | 67.2 | 70.8 |
| Number of instances | Domestic Flights (No.) | 64 | 55 | 324 |
| kg CO2e/passenger-flight | Domestic Flights | 91.8 | 136.6 | 137.0 |
| kg CO2e/passenger-flight | Short Haul Flights | 110.1 | 150.8 | 137.3 |
| kg CO2e/passenger-flight | Long Haul Flights | 549.8 | 1,054.4 | 885.3 |
| kg CO2e per journey | Domestic Rail Travel | 6.5 | 7.2 | 8.2 |
| Asset | 2025-26 | 2024-25 | 2023-24 | |
|---|---|---|---|---|
| Financial Breakdown of Business Travel | Company vehicle lease | £1,513,520 | £1,881,259 | £1,486,153 |
| Company vehicle fuel costs | £226,730 | £271,616 | £284,833 | |
| Hire car costs | £10,988 | £393,371 | £306,668 | |
| Domestic Rail Travel (including underground) | £225,972 | £205,151 | £167,437 | |
| Domestic Flights | £6,873 | £6,643 | £48,013 | |
| Short Haul Flights | £10,134 | £9,050 | £8,821 | |
| Long Haul Flights | £34,720 | £91,244 | £201,239 | |
| Domestic Taxis | £12,991 | £10,296 | £31,577 | |
| Total | £2,041,927 | £2,868,630 | £2,534,741 | |
| FTE | FTE per year | 1,337 | 1,415 | 1,430 |
The Ordnance Survey fleet and Business Travel
OS are committed to achieving a 100% zero-emissions at the tailpipe fleet in 2027. This is in mitigation of the risk Non-compliance with regulatory standards and/or Government standards, and in support of the opportunity for a more sustainable estate. The OS fleet had 50% fully electric vehicles and 100% ultra-low emissions vehicles at the end of the 25-26 financial year. We achieved a 5% reduction in fleet mileage, and with the continued transition to an EV fleet, this resulted in a 29% reduction in emissions across scopes 1 and 2 combined.
In May 2024, we introduced a new domestic flights policy to restrict flights to when a ferry would otherwise be required, or where Director approval is sought for a unique circumstance. This policy has continued to be effective in reducing our domestic flight emissions, whilst we have observed an increase in emissions associated with rail journeys. Overall, there has been an 80% reduction in domestic flight emissions since 2023-24, the last full year when the policy was not in place, and an overall 55% reduction in business travel emissions against 2024-25.
Waste and water
| Absolute metrics | 2025-26 | 2024-25 | 2023-24 | |
|---|---|---|---|---|
| Water Consumed (m3) Tonnes CO2e | Mains water supply (Scope 2) | 3,278.0 | 2,412.4 | 2,222.0 |
| Harvested Rainwater Used (Scope 1) | 658.0 | 603.0 | 830.0 | |
| Total Consumption in m3 | 3,936 | 3,015.4 | 3,052.0 | |
| Mains water tCO2e | 0.7 | 0.4 | 0.4 | |
| Waste water tCO2e | 0.7 | 0.6 | 0.6 | |
| Total tCO2e | 1.4 | 1.0 | 1.0 | |
| Water Consumed (m3) | Mains water supply per FTE | 2.7 | 1.8 | 1.6 |
| Harvested Rainwater Used per FTE | 0.5 | 0.4 | 0.6 | |
| Total Consumption per FTE | 3.2 | 2.2 | 2.1 | |
| Paper Procured (tonnes) | Procurement (through Banner GGC) | 0.1 | 0.1 | 0.1 |
| Procurement through FM contractor | 2.3 | 2.4 | 2.5 | |
| Total Paper Procured | 2.4 | 2.5 | 2.6 | |
| Water Consumed (£) | Mains water supply & treatment | £31,999 | £13,349 | £9,362 |
| Used Harvested Rainwater treatment | £1,873 | £2,353 | £1,945 | |
| Total Water Supply & Treatment | £33,872 | £15,702 | £11,307 |
Total water usage increased this year due to higher occupancy at Explorer House and a Q1 water outage that required a full tank drain and additional water loss from a faulty sensor on the water feature. Following the repair, water use returned to expected levels and overall water usage in Q2-Q4 was lower than the previous year.
| Absolute metrics | 2025-26 | 2024-25 | 2023-24 | ||
|---|---|---|---|---|---|
| Non-financial indicators (tonnes) | Total waste arisings (tonnes) | 43.09 | 39.8 | 45.2 | |
| Non-hazardous waste | Waste Recycled/reused (exc. ICT) | 12.0 | 11.3 | 13.4 | |
| ICT equipment recycled externally | 1.6 | 0.7 | 3.0 | ||
| Waste composted | 2.3 | 1.7 | 1.7 | ||
| Toner cartridges (recycled) | 0.0 | 0.2 | 0.3 | ||
| Waste sent to incinerator (energy recovery) | 26.8 | 25.7 | 24.8 | ||
| Residual waste sent to landfill | 0.0 | 0.0 | 1.7 | ||
| Hazardous Waste | Batteries (recycled) | 0.3 | 0.1 | 0.0 | |
| HCFC equipment (fridges etc.) | 0.0 | 0.0 | 0.0 | ||
| Fluorescent lamps (recycled) | 0.0 | 0.0 | 0.0 | ||
| Sanitary waste (not recycled) | 0.1 | 0.1 | 0.1 | ||
| Waste Electrical and Electronic Equipment (WEEE) | 0.0 | 0.0 | 0.2 | ||
| Engine oil | 0.0 | 0.0 | 0.0 | ||
| Total disposal costs (£) | £18,094 | £15,824 | £24,426 |
| Absolute metrics | 2025-26 | 2024-25 | 2023-24 | ||
|---|---|---|---|---|---|
| Financial indicators (£) | Non-hazardous waste | Total Non-Hazardous Waste Costs | £12,479 | £11,837 | £20,515 |
| Waste Recycled/reused | £5,634 | £4,838 | £8,827 | ||
| ICT equipment reused/recycled externally | - | - | - | ||
| Toner cartridges (recycled) | £0 | £65 | £126 | ||
| Waste composted / anaerobic digestion | £301 | £202 | £609 | ||
| General waste skips | - | - | £2,931 | ||
| Waste sent to incinerator (energy recovery) | £6,845 | £6,732 | £2,760 | ||
| Residual waste sent to landfill | - | - | £5,262 | ||
| Metal waste | - | - | - | ||
| Hazardous Waste | Total Hazardous Waste Costs | £5,615 | £3,988 | £3,910 | |
| Batteries (recycled) | £1,917 | £290 | - | ||
| HCFC equipment (fridges etc.) | - | - | - | ||
| Fluorescent lamps (recycled) | - | - | - | ||
| Sanitary waste (not recycled) | £3,698 | £3,698 | £3,698 | ||
| WEEE | - | - | £212 | ||
| Engine oil | - | - | - |
This year, 21.5% of IT WEEE was recycled, with 78.5% sold for reuse to minimise waste. Working with a ‘zero waste to landfill’ contractor, OS sent no waste to landfill. We also partnered with Waste to Wonder to repurpose surplus furniture for charitable use. The toner cartridge recycling rate has dropped to 0 as the cartridges are no longer disposed of but returned to the provider for re-use.
Innovation: supporting our customers
During the year, Ordnance Survey delivered further targeted data enhancements under the PSGA that support sustainability-related use cases. These included the release of watercourse width data to improve flood modelling, alongside new building physical state attribution (under construction, built, derelict) and land use site status attribution (active, inactive, derelict), supporting improved assessment of building stock. We also enhanced our transport network data to include cycle lanes and bus lanes, supporting analysis and planning for active travel. While incremental, these releases help maintain the relevance of national geospatial data for environmental modelling, sustainable transport, and built-environment assessment.
Section 4 - Parliamentary Accountability and Audit Report
Parliamentary accountability and audit report
The Parliamentary Accountability and Audit Report brings together the key accountability documents, detailing the regularity of expenditure, so that Parliament can be assured that funds have been expended in the manner intended.
Regularity of expenditure (subject to audit)
OS’s Accountable Person, the Chief Executive Officer, is the person on whom Parliament calls to account for stewardship of its resources. The standards the Accountable person is expected to deliver cover Governance, Decision-making and Financial Management.
OS complies with the HM Treasury guidance Managing Public Money, to the extent applicable to public corporations, which in short covers the principles as to how government bodies handle public funds with probity and in the public interest. The Financial Memorandum sets out the specific financial framework, within which OS is required to operate. This is complemented by the Scheme of Delegation which authorises its employees to carry out certain of its functions.
Under the Government’s transparency agenda, expenditure is published monthly on all transactions over £25k.
An annual audit of the OS Accounts is undertaken by the National Audit Office (NAO).
In addition to this is an ongoing internal audit programme which helps to provide assurance to our Chief Executive and Accountable person, as well as our Audit and Risk Committee that finances are being handled appropriately and with propriety.
All of the above give us assurances that our finances are being handled with regularity. For 2025-26 OS can report that there were no losses or gifts incurred during that year that exceeded £300k.
Remote contingent liabilities (subject to audit)
As of 31 March 2026 OS held no remote contingent liabilities. Losses and Special payments are reported in note 3 to the financial statements.
Nick Bolton
CEO
9 July 2026
Independent Auditor’s Report to the Members of Ordnance Survey Limited
Opinion on financial statements
I have audited the financial statements of Ordnance Survey Limited and its Group for the year ended 31 March 2026 under the Companies Act 2006.
The financial statements comprise the Ordnance Survey Limited and its Group’s
- Statements of Financial Position as at 31 March 2026;
- Statement of Profit or Loss, Statement of Cash Flows and Statement of Changes in Equity for the year then ended; and
- the related notes including the significant accounting policies.
The financial reporting framework that has been applied in the preparation of the Group financial statements is applicable law and the UK adopted International Accounting Standards and as regards the parent company financial statements, as applied in accordance with the provisions of the Companies Act 2006.
In my opinion the financial statements:
- give a true and fair view of the state of Ordnance Survey Limited and its Group’s affairs as at 31 March 2026 and their profit for the year then ended; and
- have been properly prepared in accordance with the UK adopted International Accounting Standards and
- have been prepared in accordance with the requirements of the Companies Act 2006.
Basis for opinion
I conducted my audit in accordance with International Standards on Auditing (UK) (ISAs (UK)), applicable law and Practice Note 10 Audit of Financial Statements and Regularity of Public Sector Bodies in the United Kingdom (2024). My responsibilities under those standards are further described in the Auditor’s responsibilities for the audit of the financial statements section of my report.
Those standards require me and my staff to comply with the Financial Reporting Council’s Revised Ethical Standard 2024. I am independent of Ordnance Survey Limited and its Group in accordance with the ethical requirements that are relevant to my audit of the financial statements in the UK. My staff and I have fulfilled our other ethical responsibilities in accordance with these requirements.
I believe that the audit evidence I have obtained is sufficient and appropriate to provide a basis for my opinion.
Conclusions relating to going concern
In auditing the financial statements, I have concluded that Ordnance Survey Limited and its Group’s use of the going concern basis of accounting in the preparation of the financial statements is appropriate.
Based on the work I have performed, I have not identified any material uncertainties relating to events or conditions that, individually or collectively, may cast significant doubt on Ordnance Survey Limited and its Group’s ability to continue as a going concern for a period of at least twelve months from when the financial statements are authorised for issue.
My responsibilities and the responsibilities of the directors with respect to going concern are described in the relevant sections of this report.
Other information
The other information comprises the information included in the Annual Report, but does not include the financial statements and my auditor’s report thereon. The directors are responsible for the other information.
My opinion on the financial statements does not cover the other information and, except to the extent otherwise explicitly stated in my report, I do not express any form of assurance conclusion thereon.
My responsibility is to read the other information and, in doing so, consider whether the other information is materially inconsistent with the financial statements or my knowledge obtained in the audit, or otherwise appears to be materially misstated.
If I identify such material inconsistencies or apparent material misstatements, I am required to determine whether this gives rise to a material misstatement in the financial statements themselves. If, based on the work I have performed, I conclude that there is a material misstatement of this other information, I am required to report that fact.
I have nothing to report in this regard.
Opinion on other matters prescribed by the Companies Act 2006
In my opinion the part of the Remuneration Overview to be audited has been properly prepared in accordance with the principles of HM Treasury’s Financial Reporting Manual.
In my opinion, based on the work undertaken in the course of the audit:
- the information given in the Strategic Report and the Directors’ Report for the financial year for which the financial statements are prepared is consistent with the financial statements; and
- the Strategic Report and the Directors’ Report have been prepared in accordance with applicable legal requirements.
Matters on which I report by exception
In the light of the knowledge and understanding of Ordnance Survey Limited and its Group and their environment obtained in the course of the audit, I have not identified material misstatements in the Strategic Report or the Directors’ Report.
I have nothing to report in respect of the following matters in relation to which the Companies Act 2006 requires me to report to you if, in my opinion:
- adequate accounting records have not been kept or returns adequate for my audit have not been received from branches not visited by my staff; or
- the financial statements and the parts of the Remuneration Overview to be audited are not in agreement with the accounting records and returns; or
- certain disclosures of director’s remuneration specified by law are not made; or
- I have not received all of the information and explanations I require for my audit;
- a corporate governance statement has not been prepared by the parent company; or
- the Governance Statement does not reflect compliance with HM Treasury’s guidance.
Responsibilities of the directors for the financial statements
As explained more fully in the Statement of Directors’ Responsibilities, the directors are responsible for:
- maintaining proper accounting records;
- providing the C&AG with access to all information of which management is aware that is relevant to the preparation of the financial statements such as records, documentation and other matters;
- providing the C&AG with additional information and explanations needed for his audit;
- providing the C&AG with unrestricted access to persons within Ordnance Survey from whom the auditor determines it necessary to obtain audit evidence.
- ensuring such internal controls are in place as deemed necessary to enable the preparation of financial statement to be free from material misstatement, whether due to fraud or error;
- preparing Group financial statements, which give a true and fair view, in accordance with the Companies Act 2006;
- preparing the Annual Report, which includes the Remuneration Overview, in accordance with the Companies Act 2006 and (in respect of additional disclosures) HM Treasury’s Financial Reporting Manual as instructed in the shareholder framework agreement; and
- assessing Ordnance Survey Limited and its Group’s ability to continue as a going concern, disclosing, as applicable, matters related to going concern and using the going concern basis of accounting unless the directors either intends to liquidate the entity or the Group or to cease operations, or has no realistic alternative but to do so.
Auditor’s responsibilities for the audit of the financial statements
My responsibility is to audit and report on the financial statements in accordance with the applicable law and International Standards on Auditing (UK) (ISAs (UK))
My objectives are to obtain reasonable assurance about whether the financial statements as a whole are free from material misstatement, whether due to fraud or error, and to issue a report that includes my opinion. Reasonable assurance is a high level of assurance but is not a guarantee that an audit conducted in accordance with ISAs (UK) will always detect a material misstatement when it exists. Misstatements can arise from fraud or error and are considered material if, individually or in the aggregate, they could reasonably be expected to influence the economic decisions of users taken on the basis of these financial statements.
Extent to which the audit was considered capable of detecting non-compliance with laws and regulations including fraud
I design procedures in line with my responsibilities, outlined above, to detect material misstatements in respect of non-compliance with laws and regulations, including fraud. The extent to which my procedures are capable of detecting non-compliance with laws and regulations, including fraud is detailed below.
Identifying and assessing potential risks related to non-compliance with laws and regulations, including fraud
In identifying and assessing risks of material misstatement in respect of non-compliance with laws and regulations, including fraud, I:
- considered the nature of the sector, control environment and operational performance including the design of Ordnance Survey Limited and its Group’s accounting policies, key performance indicators and performance incentives.
-
inquired of management, Ordnance Survey Limited’s head of internal audit and those charged with governance, including obtaining and reviewing supporting documentation relating to Ordnance Survey Limited and its Group’s policies and procedures on:
- identifying, evaluating and complying with laws and regulations;
- detecting and responding to the risks of fraud; and
- the internal controls established to mitigate risks related to fraud or non-compliance with laws and regulations including Ordnance Survey Limited and its Group’s controls relating to Ordnance Survey Limited’s compliance with the Companies Act 2006;
- inquired of management, Ordnance Survey Limited’s head of internal audit and those charged with governance whether:
- they were aware of any instances of non-compliance with laws and regulations; and
- they had knowledge of any actual, suspected, or alleged fraud;
- discussed with the engagement team including relevant component audit teams regarding how and where fraud might occur in the financial statements and any potential indicators of fraud.
As a result of these procedures, I considered the opportunities and incentives that may exist within the Ordnance Survey Limited and its Group for fraud and identified the greatest potential for fraud in the following areas: revenue recognition, posting of unusual journals, complex transactions, and bias in management estimates. In common with all audits under ISAs (UK), I am required to perform specific procedures to respond to the risk of management override.
I obtained an understanding of Ordnance Survey Limited and its Group’s framework of authorities and other legal and regulatory frameworks in which the Ordnance Survey Limited and its Group operates. I focused on those laws and regulations that had a direct effect on material amounts and disclosures in the financial statements or that had a fundamental effect on the operations of the Ordnance Survey Limited and its Group. The key laws and regulations I considered in this context included Companies Act 2006, employment law and tax law.
Audit response to identified risk
To respond to the identified risks resulting from the above procedures:
- I reviewed the financial statement disclosures and testing to supporting documentation to assess compliance with provisions of relevant laws and regulations described above as having direct effect on the financial statements;
- I enquired of management, the Audit and Risk Committee and in-house legal staff concerning actual and potential litigation and claims;
- I reviewed minutes of meetings of those charged with governance and the Board and internal audit reports;
- I addressed the risk of fraud through management override of controls by testing the appropriateness of journal entries and other adjustments; assessing whether the judgements on estimates are indicative of a potential bias; and evaluating the business rationale of any significant transactions that are unusual or outside the normal course of business.
I communicated relevant identified laws and regulations and potential risks of fraud to all engagement team members including relevant component audit teams and remained alert to any indications of fraud or non-compliance with laws and regulations throughout the audit.
A further description of my responsibilities for the audit of the financial statements is located on the Financial Reporting Council’s website: Auditor’s Responsibilities for the Audit. This description forms part of my report.
Other auditor’s responsibilities
I communicate with those charged with governance regarding, among other matters, the planned scope and timing of the audit and significant audit findings, including any significant deficiencies in internal control I identify during my audit.
Matthew Kay (Senior Statutory Auditor)
10 July 2026
For and on behalf of the
Comptroller and Auditor General (Statutory Auditor)
National Audit Office
157-197 Buckingham Palace Road
Victoria
London
SW1W 9SP
Section 5 - Financial statements
Consolidated Statement of Comprehensive Income as at 31 March 2026
| Group | Notes | 2025-26 | 2024-25 |
|---|---|---|---|
| £’000 | £’000 | ||
| Revenue | 2 | 198,673 | 194,597 |
| Cost of Sales | (34,929) | (34,896) | |
| Gross Profit | 163,744 | 159,701 | |
| Operating costs | 3 | (152,709) | (151,317) |
| Cost associated with staff redundancy programme | 4 | (963) | (3,872) |
| Share of results of joint ventures | 8 | 10,842 | 10,748 |
| Other income | 1,449 | 2,164 | |
| Net gain on bargain purchase | 8 | 1,234 | - |
| Operating profit | 23,597 | 17,424 | |
| Finance income | 38 | 401 | |
| Finance cost | (164) | (181) | |
| Finance income - net | (126) | 220 | |
| Profit before corporation tax | 23,471 | 17,644 | |
| Corporation tax expense | 5 | (6,491) | (4,563) |
| Total Comprehensive income | 16,980 | 13,081 | |
| Profit is attributable to owners of the company | 16,980 | 13,081 | |
| Dividends | 6 | (7,700) | (5,700) |
| Profit retained for the year | 9,280 | 7,381 |
All the activities of the Group are classified as continuing.
The Notes to the financial statements are an integral part of these financial statements.
Consolidated statement of financial position as at 31 March 2026
| Group | Notes | 2025-26 | 2024-25 |
|---|---|---|---|
| £’000 | £’000 | ||
| Non-current assets | |||
| Intangible assets | 9 | 56,335 | 60,141 |
| Property plant and equipment | 10 | 26,368 | 27,327 |
| Right of Use Assets | 10 | 2,614 | 3,477 |
| Investments | 7 | 675 | 3 |
| Interests in Joint Ventures | 8 | 6,069 | 9,731 |
| 92,061 | 100,679 | ||
| Current assets | |||
| Inventories | 11 | 1,381 | 2,355 |
| Trade and other receivables | 12 | 25,787 | 24,098 |
| Current Tax Asset | 3,314 | 7,325 | |
| Cash and cash equivalents | 13 | 96,550 | 76,777 |
| 127,032 | 110,555 | ||
| Total assets | 219,093 | 211,234 | |
| Current liabilities | |||
| Trade and other payables | 14 | (35,316) | (32,677) |
| Lease liabilities due in less than 1 year | 15 | (1,238) | (1,608) |
| Provisions | 16 | - | - |
| Deferred Revenue | 17 | (23,262) | (25,338) |
| (59,816) | (59,623) | ||
| Net current assets | 67,216 | 50,932 | |
| Non-current assets plus net current assets | 159,277 | 151,611 |
| Group | Notes | 2025-26 | 2024-25 |
|---|---|---|---|
| £’000 | £’000 | ||
| Non-current liabilities | |||
| Lease liabilities payable after more than 1 year | 15 | (1,395) | (1,840) |
| Provisions | 16 | (178) | (156) |
| Deferred Revenue | 17 | - | (1,037) |
| Deferred tax liability | 18 | (4,866) | (5,020) |
| Total liabilities | (66,255) | (67,676) | |
| Net assets | 152,838 | 143,558 | |
| Equity | |||
| Share capital | 19 | 34,000 | 34,000 |
| Retained earnings | 118,838 | 109,558 | |
| Capital and reserves attributable to owners of the Company | 152,838 | 143,558 |
The financial statements of Ordnance Survey Limited, registration no. 09121572 were approved by the Board of Directors and authorised for issue on 9 July 2026. They were signed on its behalf by
Nick Bolton
CEO
The Notes to the financial statements are an integral part of these financial statements.
Ordnance Survey Limited Statement of financial position as at 31 March 2026
| Company | Notes | 2025-26 | 2024-25 |
|---|---|---|---|
| £’000 | £’000 | ||
| Non-current assets | |||
| Intangible assets | 9 | 56,335 | 60,141 |
| Property plant and equipment | 10 | 25,555 | 27,327 |
| Right of Use Assets | 10 | 2,290 | 3,477 |
| Investments | 7 | 1,075 | 403 |
| Interests in Joint Ventures | 8 | 6,069 | 9,731 |
| 91,324 | 101,079 | ||
| Current assets | |||
| Inventories | 11 | 1,451 | 2,342 |
| Trade and other receivables | 12 | 27,570 | 23,171 |
| Current Tax Asset | 3,564 | 7,463 | |
| Cash and cash equivalents | 13 | 69,181 | 55,708 |
| 101,766 | 88,683 | ||
| Total assets | 193,090 | 189,762 | |
| Current liabilities | |||
| Trade and other payables | 14 | (34,853) | (32,439) |
| Lease liabilities due in less than 1 year | 15 | (1,143) | (1,608) |
| Provisions | 16 | - | - |
| Deferred Revenue | 17 | (18,461) | (20,993) |
| (54,457) | (55,040) | ||
| Net current assets | 47,309 | 33,643 | |
| Non-current assets plus net current assets | 138,633 | 134,722 |
| Company | Notes | 2025-26 | 2024-25 |
|---|---|---|---|
| Non-current liabilities | |||
| Lease liabilities payable after more than 1 year | 15 | (1,152) | (1,840) |
| Provisions | 16 | (178) | (156) |
| Deferred Revenue | 17 | - | (851) |
| Deferred tax liability | 18 | (4,822) | (5,035) |
| Total liabilities | (60,609) | (62,922) | |
| Net assets | 132,481 | 126,840 | |
| Equity | |||
| Share capital | 19 | 34,000 | 34,000 |
| Retained earnings | 98,481 | 92,840 | |
| Capital and reserves attributable to owners of the Company | 132,481 | 126,840 |
Ordnance Survey Limited generated a profit of £13.3m for the year ended 31 March 2026 before payment of the dividend.
As permitted by section 408(3) of the Companies Act 2006, the income statement of the company is not presented in this Annual Report.
The financial statements of Ordnance Survey Limited, registration no. 09121572 were approved by the Board of Directors and authorised for issue on 9 July 2026. They were signed on its behalf by
Nick Bolton
CEO
The Notes to the financial statements are an integral part of these financial statements.
Consolidated statement of changes in equity for the year ended 31 March 2026
| Group | Notes | Share Capital | Retained earnings | Total |
|---|---|---|---|---|
| £’000 | £’000 | £’000 | ||
| As at 1 April 2024 | 34,000 | 102,177 | 136,177 | |
| Profit for the year | - | 13,081 | 13,081 | |
| Total comprehensive income for the period | - | 13,081 | 13,081 | |
| Transactions with owners in their capacity as owners | ||||
| Dividends payable | - | (5,700) | (5,700) | |
| As at 1 April 2025 | 34,000 | 109,558 | 143,558 | |
| Profit for the year | - | 16,980 | 16,980 | |
| Total comprehensive income for the period | - | 16,980 | 16,980 | |
| Transactions with owners in their capacity as owners | ||||
| Dividends payable | 6 | - | (7,700) | (7,700) |
| As at 31 March 2026 | 34,000 | 118,838 | 152,838 |
The Notes to the financial statements are an integral part of these financial statements.
Company Statement of changes in equity for the year ended 31 March 2026
| Company | Notes | Share Capital | Retained earnings | Total |
|---|---|---|---|---|
| £’000 | £’000 | £’000 | ||
| As at 1 April 2024 | 34,000 | 87,223 | 121,223 | |
| Profit for the year | - | 11,317 | 11,317 | |
| Total comprehensive income for the period | - | 11,317 | 11,317 | |
| Transactions with owners in their capacity as owners | ||||
| Dividends payable | - | (5,700) | (5,700) | |
| As at 1 April 2025 | 34,000 | 92,840 | 126,840 | |
| Profit for the year | - | 13,341 | 13,341 | |
| Total comprehensive income for the period | - | 13,341 | 13,341 | |
| Transactions with owners in their capacity as owners | ||||
| Dividends payable | 6 | - | (7,700) | (7,700) |
| As at 31 March 2026 | 34,000 | 98,481 | 132,481 |
The Notes to the financial statements are an integral part of these financial statements.
Consolidated cash flow statement for the year ended 31 March 2026
| Group | Notes | 2025-26 | 2024-25 |
|---|---|---|---|
| £’000 | £’000 | ||
| Profit before corporation tax | 23,471 | 17,644 | |
| Amortisation of intangible assets | 17,879 | 16,389 | |
| Depreciation of tangible fixed assets | 4,008 | 4,156 | |
| Decrease in deferred tax liability | (154) | 1,791 | |
| Loss on disposal of intangible assets | - | 69 | |
| Share of joint venture results | (10,842) | (10,748) | |
| Revaluation of investments | (672) | - | |
| Revaluation of interest in joint venture | (118) | - | |
| Net assets acquired with Dennis Maps | (1,116) | - | |
| Interest received | (38) | (48) | |
| Interest paid | 164 | 181 | |
| Decrease/(increase) in inventories | 1,293 | (151) | |
| (Decrease) in trade and other receivables | (3,511) | (4,375) | |
| Increase in trade and other payables | 513 | 6,941 | |
| Increase in provisions for liabilities and charges | 22 | 23 | |
| (Decrease)/increase in deferred revenue | (3,113) | 1,896 | |
| Cashflow from operations | 27,786 | 33,768 | |
| Income taxes paid | (605) | - | |
| Net cash inflow from operating activities | 27,181 | 33,768 | |
| Cash flows from investing activities | |||
| Interest received | 38 | 48 | |
| Purchase of plant property and equipment | (572) | (3,113) | |
| Purchase of intangible assets | (14,388) | (15,397) | |
| Cash acquired with purchase of subsidiary | 761 | - | |
| Distributions from joint ventures | 14,250 | 6,750 | |
| Net cash inflow/(used) in investing activities | 89 | (11,712) | |
| Cash flows from financing activities | |||
| Interest paid | (164) | (181) | |
| Lease liability capital repayments | (1,632) | (1,802) | |
| Payment of Dividends | 6 | (5,700) | (16,900) |
| Net cash used in financing activities | (7,496) | (18,883) | |
| Net increase in cash and cash equivalents | 19,774 | 3,173 | |
| Cash and cash equivalents at beginning of year | 76,777 | 73,604 | |
| Cash and cash equivalents at end of year | 13 | 96,550 | 76,777 |
The Notes to the financial statements are an integral part of these financial statements.
Company cash flow statement for the year ended 31 March 2026
| Notes | 2025-26 | 2024-25 | |
|---|---|---|---|
| Company | £’000 | £’000 | |
| Profit before corporation tax | 19,268 | 15,056 | |
| Amortisation of intangible assets | 17,879 | 16,389 | |
| Depreciation of tangible fixed assets | 3,946 | 4,156 | |
| (Decrease)/increase in deferred tax liability | (213) | 1,787 | |
| Loss on disposal of intangible assets | - | 69 | |
| Share of joint venture results | (10,842) | (10,748) | |
| Revaluation of investments | (672) | - | |
| Write off of interest in joint venture | 254 | - | |
| Interest received | (356) | (682) | |
| Interest paid | 139 | 181 | |
| Decrease/(increase) in inventories | 891 | (148) | |
| (Decrease)/increase in trade and other receivables | (6,643) | 1,857 | |
| Increase in trade and other payables | 1,008 | 7,281 | |
| Increase in provisions for liabilities and charges | 22 | 23 | |
| (Decrease)/increase in deferred revenue | (3,383) | 1,377 | |
| Cashflow from operations | 21,298 | 36,598 | |
| Income taxes paid | - | - | |
| Net cash inflow from operating activities | 21,298 | 36,598 | |
| Company | |||
| Cash flows from investing activities | |||
| Interest received | 356 | 682 | |
| Purchase of plant property and equipment | (572) | (3,113) | |
| Purchase of intangible assets | (14,388) | (15,397) | |
| Distributions from joint ventures | 14,250 | 6,750 | |
| Net cash used in investing activities | (354) | (11,078) | |
| Cash flows from financing activities | |||
| Interest paid | (139) | (181) | |
| Lease liability capital repayments | (1,632) | (1,802) | |
| Payment of dividends | 6 | (5,700) | (16,900) |
| Net cash used in financing activities | (7,471) | (18,883) | |
| Net increase in cash and cash equivalents | 13,473 | 6,637 | |
| Cash and cash equivalents at beginning of year | 55,708 | 49,071 | |
| Cash and cash equivalents at end of year | 13 | 69,181 | 55,708 |
The Notes to the financial statements are an integral part of these financial statements.
Notes to the consolidated financial statements
1. Principal accounting policies
Ordnance Survey Limited (the Company) is incorporated in the United Kingdom under the Companies Act 2006. The address of the registered office is:
Explorer House
Adanac Drive
Southampton
SO16 0AS
The principal activities of the Company and its subsidiaries (the Group) and the nature of the Group’s operations are set out in note 8 and in the strategic report. These financial statements are presented in pounds sterling, because that is the currency of the primary economic environment in which the Group operates.
1.1 Basis of preparation
(i) Compliance with IFRS
The consolidated financial statements have been prepared in accordance with UK adopted International Accounting Standards and the requirements of the Companies Act 2006.
Where IFRS permits a choice of accounting policy, the accounting policy which is judged to be most appropriate to the specific circumstances of Ordnance Survey Limited (‘Ordnance Survey’) for the purpose of giving a true and fair view has been selected. The policies adopted are described below. They have been applied consistently unless otherwise stated in dealing with items that are considered material to the financial statements.
The Company has taken advantage of the exemption under Section 408 of the Companies Act 2006 from presenting its own profit and loss account.
(ii) Going concern
The financial statements have been prepared on a going concern basis.
(iii) Historical cost convention
The financial statements have been prepared under the historic cost convention except for the following:
- Financial assets and liabilities − measured at fair value.
- Assets held for sale − measured at fair value less cost of disposal.
There are no standards that are not yet effective and that would be expected to have a material impact on the entity in the current or future reporting periods and on foreseeable future transactions.
1.2 Basis of consolidation
The consolidated financial statements incorporate the financial statements of the Company and its subsidiaries.
Subsidiaries are all entities over which the Group has control. The Group controls an entity when the Group is exposed to, or has rights to, variable returns from its involvement with the entity and has the ability to affect those returns through its power to direct the activities of the entity. Subsidiaries are fully consolidated from the date on which control is transferred to the Group. They are deconsolidated from the date that control ceases.
Where necessary, adjustments are made to the financial statements of subsidiaries to bring their accounting policies into line with those used by other members of the Group.
All intra-group transactions, balances, income and expenditure are eliminated in full on consolidation.
Non-controlling interests in the net assets of consolidated subsidiaries are identified separately from the Group’s equity. Total comprehensive income is attributed to non-controlling interests even if this results in the non-controlling interests having a deficit balance.
Business combinations are accounted for using the acquisition method in accordance with IFRS 3 Business Combinations. On acquisition, the identifiable assets acquired and liabilities assumed are recognised and measured at their fair values at the acquisition date.
Where the Group obtains control of an entity that was previously accounted for as a joint venture, any previously held equity interest is remeasured to its fair value at the acquisition date, and any resulting gain or loss is recognised in profit or loss. If the fair value of the identifiable net assets acquired exceeds the aggregate of the consideration transferred and the fair value of any previously held equity interest, the resulting excess is recognised as a bargain purchase gain in the Group income statement at the acquisition date.
Prior to recognising a bargain purchase gain, the Group reassesses whether all assets acquired and liabilities assumed have been identified and whether the measurements of those assets and liabilities, the consideration transferred, and any previously held equity interest are appropriate.
Bargain purchase gains are recognised immediately in profit or loss and are not amortised. Bargain purchase gains arise from consolidation adjustments only and do not affect the statutory results of the acquired entity.
1.3 Joint Ventures
Joint ventures are entities over which the Group has significant influence but does not control.
The Group accounts for investments in joint ventures using the equity method of accounting, recording the investment initially at cost. Adjustment is made in the Group accounts to ensure consistent application of Group accounting policies.
1.4 Segment reporting
The Board receives an analysis of revenue by channel and operating segments, and this is presented in note 2.
1.5 Foreign currency transactions
Transactions denominated in foreign currencies are translated into the functional currency at the exchange rate ruling at the dates of the transactions. Exchange rate differences are charged to the statement of profit or loss as incurred. Monetary assets and liabilities denominated in foreign currencies at the statement of financial position reporting date are translated at the rates ruling at that date.
1.6 Investments
Investments held as non-current assets are stated at cost less provision for permanent diminution in value.
1.7 Property, plant and equipment
Property, plant and equipment held for use in the supply of goods or services, or for administration purposes, are stated in the statement of financial position at costs less any accumulated depreciation.
The depreciable amount of an asset is calculated by deducting its residual value from its initial cost. The residual value of an asset is the estimated amount that the Group would obtain from the disposal of the asset after deducting the estimated cost of disposal. Depreciation is charged to write off the cost of assets less their residual value over their estimated useful lives, using the straight-line method.
The depreciation policy applied to property, plant and equipment details the following useful lives to be applied to tangible fixed assets:
| Asset class | Depreciation Policy |
|---|---|
| Freehold land | Not depreciated |
| Freehold buildings | 40 years from acquisition or remaining useful economic life |
| Equipment and fixtures: | |
| IT Equipment | 1 to 5 years |
| Equipment, facilities and fixtures | 2 to 15 years |
| Vehicles | 4 years |
| Assets under construction | Not depreciated |
| Right of Use Assets | See note 1.15 |
The minimum level for capitalisation of property, plant and equipment is £5,000, with the exception of IT and support systems hardware, which is £1,000. All IT workstations (office computers and laptops) bought together are grouped as one asset.
1.8 Intangible assets
Expenditure on research activities is recognised as an expense in the period in which it is incurred. Internally generated intangible assets are capitalised if an asset has been created which can be identified and meets the following criteria:
- It is probable that the asset will give rise to future economic benefit.
- The original cost can be reliably measured.
- It is technically feasible that the asset can be completed for use.
- There is the intention to complete and use it.
- There is the ability to use it.
- Resources are available to complete the development.
These assets are capitalised at the cost of development.
Amortisation is charged on a straight-line basis to write down the asset over its useful life. Useful lives are reviewed on an annual basis and adjustments, where applicable, are made on a prospective basis.
The useful lives of intangible assets are expected to fall within the following limits:
| Asset class | Estimated useful life |
|---|---|
| Data content | 3 to 5 years |
| Software | 3 to 12 years |
| Assets under construction | Not amortised |
The Group’s internally generated intangible assets consist of:
a) Data content
Data content represents those data sets which have been considered to meet the criteria of IAS 38. The underlying National Geographic Database has not been capitalised as it has evolved from the data capture which commenced over 200 years ago, and therefore the original cost cannot be reliably measured. Significant enhancements and other data content is capitalised where these are considered to meet the criteria of IAS 38.
b) Software
The costs of data delivery and business systems include all directly attributable costs including the cost of purchased computer software licences used to develop the systems.
c) Assets under construction
Assets under construction are capitalised at cost and carried at cost less any recognised impairment loss.
Cost includes all directly attributable costs including professional fees.
Amortisation of these assets commences when the assets are ready for their intended use.
For software as a service (“SAAS”) arrangements, the Group does not capitalise costs relating to the configuration and customisation of SAAS arrangements as intangible assets except where control of the software exists. Costs relating to integration with existing Group owned software may be capitalised.
1.9 Impairment of non-financial assets
Assets that are subject to amortisation are reviewed annually to consider whether there have been any events or changes in circumstance that indicate the carrying amount may not be recoverable. An impairment loss is recognised for the amount by which the asset’s carrying amount exceeds its recoverable amount.
The recoverable amount is the higher of an asset’s fair value less costs to sell and value in use. For the purposes of assessing impairment, assets are grouped at the lowest levels for which there are separately identifiable cash flows (cash generating units). Non-financial assets which have suffered impairment are reviewed for possible reversal of the impairment at each reporting date.
Where there is no expectation of future impairment reversal, assets will be fully removed from the financial statements.
1.10 Inventory and work in progress
Inventories and work in progress are stated at the lower of cost and net realisable value. Cost is determined using the weighted average costing method.
Cost comprises design costs, direct materials, direct labour and those overheads that have been incurred in bringing the inventories to their present location and condition.
Net realisable value represents the estimated selling price in the ordinary course of business less applicable variable selling expenses.
Where inventories are transferred between Group entities at a profit and remain unsold at the reporting date, the unrealised profit included in the carrying amount of inventories is eliminated against Group cost of sales. The elimination is calculated based on the profit component included in inventories held by Group entities at the reporting date.
Unrealised profits eliminated on consolidation are recognised in the Group income statement in the period in which the related inventories are sold to external customers.
PURP eliminations are made solely for the purposes of preparing the consolidated financial statements and do not affect the results or financial positions of individual Group entities.
1.11 Financial assets and liabilities
a) Financial Assets
Financial assets are classified under IFRS 9 as either amortised cost, fair value through profit or loss (“FVTPL”), or fair value through other comprehensive income (“FVOCI”), depending on the Group’s business model for managing the assets and the contractual cash flow characteristics of the instruments.
The Group applies the IFRS 9 expected credit loss (“ECL”) model to financial assets measured at amortised cost. For trade receivables, contract assets and lease receivables, the Group applies the simplified approach and recognises lifetime expected credit losses.
IFRS 9 establishes a three-stage impairment model based on changes in credit risk since initial recognition:
- Stage 1 – Financial instruments that have not experienced a significant increase in credit risk since initial recognition. ECL is measured based on default events that may occur within the next 12 months.
- Stage 2 – Financial instruments for which there has been a significant increase in credit risk since initial recognition, but which are not credit impaired. ECL is measured over the lifetime of the instrument.
- Stage 3 – Financial instruments that are considered credit impaired. Lifetime expected credit losses are recognised.
The Group considers a financial asset to be credit impaired where one or more of the following conditions apply:
- the borrower is considered unlikely to pay and is experiencing significant financial difficulty;
- the borrower is insolvent;
- the borrower continues to rely on Group support to meet liabilities as they fall due; or
- the borrower does not have a viable financial plan demonstrating a likelihood of repayment.
Expected credit losses are estimated using the Group’s historical credit loss experience, adjusted for debtor-specific factors, current economic conditions and forecasts of future economic conditions at the reporting date, including the time value of money where appropriate.
Cash and cash equivalents comprise cash at bank and in hand together with short-term deposits with original maturities of three months or less.
b) Financial liabilities
Trade payables and other financial liabilities are recognised initially at fair value and subsequently measured at amortised cost using the effective interest method.
1.12 Provisions
Provisions are recognised when the Group has a present obligation as a result of a past event, it is probable that the Group will be required to settle that obligation and a reliable estimate can be made of the obligation.
Provisions are measured at the best estimate of the expenditure required to settle the obligation at the statement of financial position reporting date, taking into account the risks and uncertainties surrounding the obligation and are discounted to present value, where material.
1.13 Employee benefits
a) Pensions − legacy schemes
Pension benefits are provided through the Principal Civil Service Pension Scheme (PCSPS); details are outlined in note 4 of the pension schemes of which the Company staff are members.
From 1 October 2002, the Trading Fund staff could have joined one of three statutory based final salary defined benefit schemes (Classic, Premium, and Classic Plus). New entrants after 1 October 2002 chose between membership of the premium scheme and joining a defined contribution scheme with a significant employer contribution (partnership pension account). These schemes were closed to new entrants on 29 July 2007.
All new employees who joined the Trading Fund (the former legal entity through which our business was conducted) on or after 30 July 2007 could choose between membership of the Nuvos scheme and a partnership pension account. The defined benefit schemes were closed to employees on 31 March 2015.
All employer pension contributions payable are charged to the statement of profit or loss and other comprehensive income for the financial year as incurred, on the basis that the schemes are multi-employer and the Company is unable to identify its share of the underlying assets and liabilities in accordance with IAS 19.
b) Pensions − Horizon scheme
The 2015-16 year was the first year of trade for Ordnance Survey Limited. On 1 April 2015, the entire functions, business, subsidiaries, operations and assets of the Ordnance Survey Trading Fund were transferred to Ordnance Survey Limited, a limited company wholly owned by the Secretary of State for Business, Energy & Industrial Strategy, and the company commenced trading on this date.
From 1 April 2015, all new Company employees were offered the opportunity to join the Horizon defined contribution pension scheme. For this scheme the amount charged to the profit and loss account in respect of pension costs and other retirement benefits is the contributions payable in the year. Differences between contributions payable in the year and contributions actually paid are shown as either accruals or prepayments in the statement of financial position.
c) Early release costs
A provision is recognised in the financial statements for the full departure cost of employees who have agreed to exit the Group prior to the year end.
1.14 Revenue recognition
Revenue is measured at the fair value of the consideration received or receivable for the delivery of mapping goods and services, which comprises mapping data, information, customer tailored services and copyright revenue, in the ordinary course of business. Revenue is shown net of VAT and discounts.
The Group recognises revenue once the amount of revenue can be reliably measured, it is probable that future economic benefits will flow to the entity and when specific other criteria are met for each of the activities shown below.
Public Sector Geospatial Agreement (PSGA) revenue is recognised each year on two bases;
- Direct Licences − Licences which allow the customer to use the data. The revenue deriving from these licences is recognised over the length of the licence agreement as this reflects the usage of the data by the customer and the Group’s obligation of ongoing supply and to provide updates.
- Services − revenue from services is recognised on a ‘performance completed to date’ basis by assessing the proportion of the total contract that has been completed at each point in time in accordance with IFRS 15, para 35(a). There is a facility for the Group to share private sector revenue above a certain threshold with HM Government. This is recognised on an accruals basis.
Direct Licences − Licences which allow the customer to use the Group data for internal purposes only. The revenue deriving from these licences is recognised over the length of the licence agreement (usually 12 months) as this reflects the usage of the data by the customer and the Group’s obligation of ongoing supply and to provide updates.
Partner Licences − Licences which enable the customer to add value to the Group data and resell the product to third parties. The revenue deriving from these licences is recognised over the length of the licence agreement (usually 12 months) as this reflects the usage of the data by the end customer and the Group’s obligation of ongoing supply and to provide updates. Where partner returns are subsequently identified to be incorrect, whether arising from an audit or partner identified, revenue will be adjusted upwards to the extent that the new information provides an indication on cash flows now virtually certain to be received or receivable in respect of the relevant period, or downwards to the extent that the impact on cash flows is probable. This would be the case unless there are indications that the misdeclaration was accepted in the prior period.
Paper maps − Revenue from paper map sales is recognised when the control of ownership passes to the customer.
Services − Revenue from services are recognised at the point at which the services are transferred to the customer, performed by the Group, or on a proportion of completeness of total contract method, depending on which is most appropriate to the contract.
Unpaid invoices for licence fees which relate to periods after the statement of financial position reporting date are included in the trade receivables balance. The net invoiced value relating to revenue to be recognised in the period after the statement of financial position reporting date is recorded in current and long-term creditors as deferred income.
Payment is typically due shortly after delivery of goods or services. In respect of bespoke services delivered over longer periods of time, the Group negotiates payment terms to match delivery of the contractual obligations.
1.15 Leases
IFRS 16 was adopted as from 1 April 2019. All operating lease contracts, with limited exceptions, were recognised on the balance sheet by recognising right-of-use assets and corresponding lease liabilities at the transition date.
At inception of a contract, the Group assesses whether a contract is, or contains, a lease based on whether the contract conveys the right to control the use of an identified asset for a period of time in exchange for consideration. The Group recognises a right-of-use asset and a lease liability at the lease commencement date. The right-of use asset is initially measured based on the initial amount of the lease liability.
The assets are depreciated to the earlier of the end of the useful life of the right-of-use asset or the lease term using the straight-line method as this most closely reflects the expected pattern of consumption of the future economic benefits. The lease term includes periods covered by an option to extend if the Company is reasonably certain to exercise that option.
The lease liability is initially measured at the present value of the lease payments that are not paid at the commencement date, discounted using the interest rate implicit in the lease or, if that rate cannot be readily determined, the Company’s incremental borrowing rate. Generally, the Company uses its incremental borrowing rate as the discount rate. Leases of less than one year are not included in the assets and liabilities. Leased assets are depreciated on a straight-line basis over the period of the lease.
Where the Group is a lessor, rental income is recognised on a straight-line basis and any revenues received in advance or arrears are deferred or accrued as appropriate.
On acquisition of entities, if the acquired entity had not applied IFRS 16 Leases and therefore did not recognise lease liabilities or right-of-use assets, the Group recognised lease liabilities in respect of these arrangements measured at the present value of the remaining lease payments, with corresponding right-of-use assets recognised at an equal amount, adjusted for any prepaid or accrued lease payments. These amounts reflect the accounting alignment to the Group’s accounting policies and do not represent new leasing activity.
1.16 Taxation
Current taxation
The corporation tax expense or credit for the period is the tax payable on the current period’s taxable income based on the applicable income tax rate for each jurisdiction adjusted by changes in deferred tax assets and liabilities attributable to temporary differences and to unused tax losses.
The current corporation tax charge is calculated on the basis of the tax laws enacted or substantively enacted at the end of the reporting period in the countries where the Group’s subsidiaries and joint ventures operate and generate taxable income. Management periodically evaluates positions taken in tax returns with respect to situations in which applicable tax regulation is subject to interpretation. The Group establishes provisions where appropriate on the basis of amounts expected to be paid to the tax authorities.
Deferred taxation
Deferred corporation tax is provided in full, using the liability method, on temporary differences arising between the tax bases of assets and liabilities and their carrying amounts in the consolidated financial statements.
However, deferred corporation tax is not accounted for if it arises from initial recognition of an asset or liability in a transaction other than a business combination that at the time of the transaction affects neither accounting nor taxable profit or loss. Deferred corporation tax is determined using tax rates (and laws) that have been enacted or substantially enacted by the end of the reporting period and are expected to apply when the related deferred corporation tax asset is realised or the deferred corporation tax liability is settled.
Deferred tax assets are recognised only if it is probable that future taxable amounts will be available to utilise those temporary differences and losses.
1.17 Capital Management
The Group manages its capital to ensure sufficient funds are available to meet future foreseeable funding requirements, including an assessment of contractual cash receipts, via the use of cash flow forecasts to ensure that adequate under-utilised cash facilities are maintained.
1.18 Share Options
The Group seeks to take options in exchange for support given to start-up ventures. Options are exercised where the Group has confidence in the viability of the venture. Once exercised options are assessed and shares may be sold where the Group believes the full value has been obtained. Exercised options are initially valued at cost, then revalued in accordance with IFRS9 where there is evidence of a material change in the value.
1.19 Rounding of amounts
All amounts disclosed in the financial statements and notes have been rounded off to the nearest thousand pounds unless otherwise stated.
1.20 Critical accounting estimates and judgements
In applying the Group’s accounting policies set out above, management is required to make certain estimates and judgements concerning the future. These estimates and judgements are regularly reviewed and updated as necessary. The estimates and judgements that have the most significant effect on the amount included in these financial statements are as follows:
Data Capture − Data captured in the course of our operations is expensed, unless it meets the criteria of IAS38 for capitalisation. See note 1.8a for further details.
Development costs − The Group capitalises development costs when the project meets certain criteria. Costs are only capitalised if they meet the criteria set out in IAS38 and the project has been approved by the Investment Group within the Group. Prior to this approval all project costs are expensed.
Revenue recognition − The Group recognises royalty revenue based on returns from Partners. These returns are provided on a timely basis, usually quarterly, thus limiting the time-frame of the estimate. See note 2 for the breakdown of revenue by channel, segment and geography. The Group has a partner audit programme which scrutinises our partner returns on a risk assessed basis to provide assurance over accuracy and completeness of these returns.
Services including data captured for customers − The Group recognises revenue on a percentage completion basis which requires estimating of the total costs throughout the contract.
Impairment of assets − Property, plant and equipment and intangible assets are considered for impairment if there is a reason to believe that impairment may be necessary. Factors taken into consideration in reaching such a decision include the current and future usage of the assets in the Group, the economic viability of the asset itself and, where it is a component of a larger economic unit, the viability of that unit itself. Future cash flows expected to be generated by the assets are projected, taking into account market conditions and the expected useful lives of the assets. The present value of these cash flows, determined using an appropriate discount rate, is compared with the current net asset value and, if lower, the assets are impaired to current value.
Asset lives − The determination of asset lives for depreciation and amortisation purposes is reviewed initially on acquisition and thereafter on a regular basis. Assessing the useful economic life of an asset is based on management judgement taking into account historical experience and the impact of technological change. Consequently, this represents a source of estimation uncertainty.
2. Revenue & Segmental Reporting
| 2025-26 | 2024-25 | |
|---|---|---|
| £’000 | £’000 | |
| Trading Revenue | 194,784 | 191,077 |
| Other operating activities | 3,340 | 3,031 |
| Property rental income | 549 | 489 |
| 198,673 | 194,597 |
| Trading Revenue | 2025-26 | 2024-25 |
|---|---|---|
| Channel | £’000 | £’000 |
| Direct Licences | 132,599 | 131,972 |
| Partner Licences | 40,999 | 37,966 |
| OS Maps | 12,524 | 11,679 |
| Paper maps | 6,470 | 7,446 |
| Services | 2,192 | 2,014 |
| 194,784 | 191,077 |
| 2025-26 | 2024-25 | |
|---|---|---|
| Segment | £’000 | £’000 |
| Business to government | 116,850 | 110,851 |
| Business to business | 58,516 | 59,688 |
| Business to consumer | 19,418 | 20,538 |
| 194,784 | 191,077 |
| 2025-26 | 2024-25 | |
|---|---|---|
| Geography | £’000 | £’000 |
| United Kingdom | 187,559 | 184,173 |
| Other European countries | 1,082 | 1,121 |
| Rest of World | 6,143 | 5,783 |
| 194,784 | 191,077 |
The Group’s operating revenue is principally generated by sales of mapping data, information, customer tailored services and copyrights or copyright material.
Revenues are attributed by country, based on the location of the entity to whom the Group provide the product or service. No details are available of the location of the ultimate end user.
£6.1m of rest of world revenue was from customers based in the United States.
During the year one customer (DSIT) accounted for more than 10% of turnover. The revenue received from DSIT is secured under separate long-term agreements. The total revenue from DSIT of £113.4m (2024-25 £104.8m) is reported within Direct Licences, Business to Government and United Kingdom derived, in the above tables.
Revenue from contracts with customers amounted to £175.3m (2024-25 £176.0m).
3. Operating costs
Operating profit for the year has been arrived at after charging:
| Notes | 2025-26 | 2024-25 | |
|---|---|---|---|
| £’000 | £’000 | ||
| Employee benefit expenses | 4 | 80,942 | 83,225 |
| Less Additional early release costs in year | (963) | (3,872) | |
| Amortisation of intangible assets | 9 | 17,879 | 16,389 |
| Depreciation of tangible fixed assets | 10 | 2,344 | 2,344 |
| Depreciation of right of use assets | 10 | 1,664 | 1,813 |
| Research and development | 1,165 | 1,387 | |
| Short term leases - buildings | 62 | 48 | |
| Short term leases - PPE | 298 | 336 | |
| Write-down of inventory to net realisable value | 11 | 223 | (348) |
| Foreign exchange losses/(gains) | (22) | (24) | |
| Consultancy | 1,152 | 1,170 | |
| Marketing | 4,861 | 4,204 | |
| Other operating charges | 43,104 | 44,645 | |
| 152,709 | 151,317 |
The Company’s auditor is The National Audit Office. Payments due in respect of audit services during the year was £135k (2024-25 £145k). Ordnance Survey exited the lease of offices at the NAO in 23-24, therefore £nil payments were made to the auditors for the provision of non-audit services during the year (2024-25 £nil). The fee payable for subsidiary audits for the current year audit is £69k (2024-25 £54k). Payment for non-audit services during the year were £nil (2024-25 £nil).
Losses and special payments
Losses and special payments in year were below the reportable threshold of £300k. (2024-25 £306k).
4. Staff numbers and costs
Employee benefit expenses
| 2025-26 | 2024-25 | |
|---|---|---|
| £’000 | £’000 | |
| Wages and salaries - permanent employees | 65,724 | 65,947 |
| Additional early release costs in year exceptional item | 963 | 3,872 |
| Social security costs | 9,567 | 8,087 |
| Pension costs | 10,628 | 10,892 |
| Temporary / agency contract labour costs | 2,652 | 5,034 |
| 89,534 | 93,831 | |
| Capitalised permanent labour | (8,083) | (8,901) |
| Capitalised temporary / agency contract labour | (509) | (1,706) |
| 80,942 | 83,225 |
Total permanent staff numbers, including directors
The average monthly number of full-time equivalent persons during the year was as follows:
| 2025-26 | 2024-25 | |
|---|---|---|
| Operations | 964 | 957 |
| Sales and Marketing | 199 | 236 |
| Corporate Services | 179 | 222 |
| 1,342 | 1,415 |
Total temporary/agency staff
The average monthly number of full time equivalent temporary/ agency/ contract persons employed by the Group during the year was as follows:
| 2025-26 | 2024-25 | |
|---|---|---|
| Operations | 4 | 19 |
| Sales and Marketing | 0 | 2 |
| Corporate Services | 2 | 3 |
| 6 | 24 |
Annual leave
| 2025-26 | 2024-25 | |
|---|---|---|
| £’000 | £’000 | |
| Annual leave - charge/(credit) included in wages and salaries | 92 | 129 |
| Annual leave – liability | 1,194 | 1,372 |
Pension costs - Employers contributions
| 2025-26 | 2024-25 | |
|---|---|---|
| £’000 | £’000 | |
| Defined contribution | 4,267 | 3,784 |
| Defined benefit | 6,361 | 7,108 |
For 2025-26, employers’ contributions were payable to the PCSPS at the rate 28.97% of pensionable pay. The scheme actuary reviews employers’ contributions every four years following a full scheme valuation. The contribution rates are set to meet the costs of the benefits accrued during 2025-26 to be paid when the member retires and not the benefits paid during this period to existing pensioners.
Early release costs provided for in financial year
The statement of profit or loss and other comprehensive income includes a charge of £963k (2024-25 £3,872k) in respect of new leavers identified in 2025-26. This charge reflects the costs of exit packages agreed and accounted for by 31 March 2026.
| Early release package cost band (excluding restructure provision) | 2025-26 | 2024-25 |
|---|---|---|
| Less than £10,000 | 5 | 20 |
| £10,000-£25,000 | 6 | 13 |
| £25,001 - £50,000 | 1 | 8 |
| £50,001 - £100,000 | 8 | 28 |
| £100,001 - £150,000 | 2 | 5 |
| £150,001 - £500,000 | - | 2 |
| Total number of exit packages | 22 | 76 |
| Total cost £’000 | 963 | 3,872 |
5. Taxation
As set out in the Strategic Report, on 1 April 2015, Ordnance Survey Limited acquired the entire functions, business, subsidiaries, operations and assets of the Ordnance Survey Trading Fund. The Trading Fund was outside the scope of UK Corporation Tax whereas Ordnance Survey Limited is a fully taxable entity. The subsidiaries and joint ventures of Ordnance Survey have throughout been subject to UK Corporation Tax.
| (a) Corporation tax expense | Notes | 2025-26 | 2024-25 |
|---|---|---|---|
| £’000 | £’000 | ||
| Current tax | |||
| Current tax on profits for the year | 5,664 | 3,792 | |
| Adjustments in respect of prior years | 1,151 | (1,019) | |
| Total current tax expense | 6,815 | 2,773 | |
| Deferred tax | 18 | ||
| Deferred tax charge to I/S for the period | (72) | 716 | |
| Adjustments in respect of prior years | (252) | 1,074 | |
| Total deferred tax (credit)/expense | (324) | 1,790 | |
| Income tax expense | 6,491 | 4,563 |
| (b) Reconciliation of income tax expense | 2025-26 | 2024-25 |
|---|---|---|
| £’000 | £’000 | |
| Profit before income tax expense | 23,471 | 17,644 |
| Tax on profit at the standard rate of 25% (2025: 25%) | 5,868 | 4,411 |
| Reasons affecting charge for the period: | ||
| Prior year adjustments | 901 | 55 |
| Impact of expenses not deductible | 2,759 | 2,713 |
| Non-taxable income | (3,196) | (2,775) |
| Exempt amounts | 159 | 159 |
| Income tax (credit)/expense | 6,491 | 4,563 |
6. Dividends
| 2025-26 | 2024-25 | |
|---|---|---|
| £’000 | £’000 | |
| Dividends | 7,700 | 5,700 |
In March 2026 the company declared a final dividend of £7.7m for 2025-26 (2024-25 £5.7m). During the year payments of £5.7m were made in respect of the dividend creditor of £5.7m at 31 March 2025, in line with our shareholder requirements. The creditor at 31 March 2026 of £7.7m represents £7.7m declared in respect of 2025-26.
7. Investments and loan
| Group | 2025-26 | 2024-25 |
|---|---|---|
| £’000 | £’000 | |
| Value of shares at beginning of period | 3 | 3 |
| Revaluation | 672 | - |
| Value of shares at the end of period | 675 | 3 |
| Company | 2025-26 | 2024-25 |
|---|---|---|
| £’000 | £’000 | |
| Value of shares at beginning of period | 403 | 403 |
| Revaluation | 672 | - |
| Value of shares at the end of period | 1,075 | 403 |
| 2025-26 | 2024-25 | |
|---|---|---|
| £’000 | £’000 | |
| Value of loans at beginning of period | 203 | 203 |
| Loan to Dennis Maps Limited eliminated on consolidation following acquisition | (203) | - |
| Value of loans at end of period | - | 203 |
| Value of investments | 1,075 | 606 |
During the year, Ordnance Survey Limited formally waived the financial asset due from Ordnance Survey International Services Limited. Following the requirements of IFRS9, the waiver is classified as a capital contribution.
Ordnance Survey Limited owns 100% of the ordinary shares in Ordnance Survey Leisure Limited (3,924,000 shares at £1 a share). Ordnance Survey Limited owns 100% of the ordinary shares in Ordnance Survey International Services Limited (1 share at £1 a share).
8. Joint ventures
Details of the Company’s subsidiaries at 31 March 2026 are as follows:
| Name of subsidiary | Principal activity | Country of incorporation | Proportion of control/ordinary shares held |
|---|---|---|---|
| Ordnance Survey Leisure Limited | Consumer Web | England and Wales | 100% |
| Ordnance Survey International Services Limited | International Consultancy | England and Wales | 100% |
| Ordnance Survey international Services FZ-LLC | International Consultancy | United Arab Emirates | 100% |
| Dennis Maps Limited | Map Printers | England and Wales | 100% |
All subsidiaries are Registered at Explorer House, Adanac Drive, Southampton, Hampshire, SO16 0AS with the exception of Dennis Maps, which is registered at Unit 2 Grove Lane, Frome, Somerset, BA11 4AT.
Ordnance Survey Limited has provided an unlimited bank guarantee to secure all bank liabilities of Ordnance Survey International Services Limited.
Details of the Company’s non-consolidated joint ventures at 31 March 2026 are as follows:
| Name of Joint Ventures | Principal activity | Country of incorporation | Proportion of control/ordinary shares held |
|---|---|---|---|
| GeoPlace LLP | National Addressing | England and Wales | 50% |
The share of profit/(loss) received from joint ventures is as follows:
| 2025-26 | 2024-25 | |
|---|---|---|
| £’000 | £’000 | |
| GeoPlace LLP | 10,861 | 10,705 |
| Dennis Maps | (19) | 43 |
| 10,842 | 10,748 |
The share of net assets of joint ventures is as follows:
| 2025-26 | 2024-25 | |
|---|---|---|
| £’000 | £’000 | |
| GeoPlace LLP | 6,069 | 9,458 |
| Dennis Maps | - | 273 |
| 6,069 | 9,731 |
On 1 August 2025, the Group acquired the remaining shareholding in Dennis Maps Limited (“Dennis Maps”), increasing its ownership from 25% to 100% and obtaining control. Prior to the acquisition, Dennis Maps was accounted for as a joint venture.
The acquisition has been accounted for as a business combination in accordance with IFRS3 Business Combinations, and Dennis Maps has been consolidated from the acquisition date.
On acquisition of control, the Group’s previously held equity interest in Dennis Maps was remeasured to fair value at the acquisition date, with any resulting gain or loss recognised in profit or loss.
The consideration transferred for the acquisition comprised cash only.
Bargain purchase (negative goodwill)
The identifiable assets acquired and liabilities assumed were recognised at their fair values at the acquisition date. Based on management’s assessment, the fair value of the net identifiable assets acquired was materially consistent with the carrying value shown in the balance sheet at the acquisition date, reflecting the fact that Dennis Maps was acquired as a going concern.
The fair value of net assets acquired amounted to £1,488k, compared to a previously held interest of £254k. The 25% holding in Dennis Maps was therefore worth £372k, resulting in an upward revaluation of £118k. The subsequent purchase of the remaining 75% of Dennis Maps for £1 resulted in the acquisition of an additional £1,116k of net assets. The £118k revaluation and £1,116k of net assets acquired resulted in a net bargain purchase gain of £1,234k.
As the fair value of the identifiable net assets acquired exceeded the aggregate of the consideration transferred and the fair value of the previously held interest, this is considered as a bargain purchase gain, under IFRS 3.
In accordance with IFRS 3, management reassessed the identification and measurement of the assets acquired, liabilities assumed, consideration transferred and the previously held interest and concluded that all amounts were complete and appropriately measured.
The bargain purchase gain of £1,234k has been recognised immediately in the profit or loss and is presented as “Gain on bargain purchase” within operating profit.
Elimination of joint venture balances
Immediately prior to the acquisition, the Group had outstanding balances, including a loan with Dennis Maps. On consolidation, these balances were eliminated in full as intra‑group balances and did not form part of the consideration transferred.
Impact on Group results
From the acquisition date to 31 March 2026, Dennis Maps contributed £461k to Group profit for the period. Results prior to the acquisition date have been included in note 8 as share of profit from Joint Ventures.
Material other investments - GeoPlace LLP
The investment in GeoPlace LLP at 31 March 2026 is as follows:
| 2025-26 | 2024-25 | |
|---|---|---|
| £’000 | £’000 | |
| Current assets | ||
| Cash and cash equivalents | 2,370 | 6,872 |
| Other currents assets | 8,668 | 6,977 |
| Total current assets | 11,038 | 13,849 |
| Current liabilities | ||
| Other current liabilities | (1,684) | (2,488) |
| Total current liabilities | (1,684) | (2,488) |
| Net assets | 9,354 | 11,361 |
| Less further drawings required to achieve parity of distributions relative to Partners’ profit share entitlements | - | (3,750) |
| Net assets after adjustment for unpaid profit shares | 9,354 | 7,611 |
| Ordnance Survey share of net assets at 75% | 7,016 | 5,708 |
| Add benefit to Ordnance Survey from distributions needed to arrive at parity arising from profit share rights | - | 3,750 |
| Ordnance Survey Share of Net Assets | 7,016 | 9,458 |
| 2025-26 | 2024-25 | |
|---|---|---|
| £’000 | £’000 | |
| Revenue | 25,190 | 24,131 |
| Interest income | 127 | 103 |
| Operating costs | (10,802) | (9,924) |
| Depreciation and amortisation | (34) | (36) |
| Operating profit | 14,481 | 14,274 |
| Ordnance Survey share of profit at 75% | 10,861 | 10,705 |
GeoPlace LLP is a joint venture limited liability partnership set up in 2010−11 to develop and market a national addressing product. GeoPlace LLP commenced trading on 1 April 2011 and is not subject to UK Corporation Tax. GeoPlace LLP does not have share capital. Ordnance Survey appoints 50% of the Board Members of the LLP and has a 75% profit share in accordance with a members’ agreement.
Profit share payments of £14.25m were received from GeoPlace LLP during the year (2024-25 £6.75m).
The registered office of GeoPlace LLP is Explorer House, Adanac Drive, Southampton, Hampshire, SO16 0AS.
The principal place of business of GeoPlace LLP was Sutton Yard, 65 Goswell Rd, London EC1V 7EN.
9. Intangible assets
| Group and Company | Software | Data content | Assets under construction | Total |
|---|---|---|---|---|
| £’000 | £’000 | £’000 | £’000 | |
| Cost at 1 April 2024 | 87,574 | 604 | 10,874 | 99,052 |
| Additions | - | - | 15,397 | 15,397 |
| Transfers | 18,655 | - | (18,655) | - |
| Disposals | (937) | - | - | (937) |
| Cost at 31 March 2025 | 105,292 | 604 | 7,616 | 113,512 |
| Amortisation at 1 April 2024 | (34,221) | (588) | (3,041) | (37,850) |
| Amortisation charge | (16,373) | (16) | - | (16,389) |
| Released on disposals | 868 | - | - | 868 |
| Amortisation at 31 March 2025 | (49,726) | (604) | (3,041) | (53,371) |
| Cost at 1 April 2025 | 105,292 | 604 | 7,616 | 113,512 |
| Additions | - | - | 14,073 | 14,073 |
| Transfers | 14,655 | - | (14,655) | - |
| Disposals | - | - | - | - |
| Cost at 31 March 2026 | 119,947 | 604 | 7,034 | 127,585 |
| Amortisation at 1 April 2025 | (49,726) | (604) | (3,041) | (53,371) |
| Amortisation charge | (17,879) | - | - | (17,879) |
| Released on disposals | - | - | - | - |
| Amortisation at 31 March 2026 | (67,605) | (604) | (3,041) | (71,250) |
| Net Book Value 31 March 2026 | 52,342 | - | 3,993 | 56,335 |
| Net Book Value 31 March 2025 | 55,566 | - | 4,575 | 60,141 |
Details of judgement relating to asset lives and impairment are given in Note 1.20
Individual material assets include:
- The Geoproduction system, current year carrying value is £19.0m (2024-25 £18.7m), the asset is being amortised over 10 years
- Systems of Engagement, current year carrying value £5.6m (2024-25 £7.4m), the asset is being amortised over 5 years
- Common Services Data Platform, current year carrying value £2.2m (2024-25 £5.2m), the asset is being amortised over 5 years
10. Property, Plant & Equipment
| Group | Land | Buildings | IT Equipment | Equipment, facilities, & fixtures | Assets under construction | Total | Right of Use Assets | Total |
|---|---|---|---|---|---|---|---|---|
| £’000 | £’000 | £’000 | £’000 | £’000 | £’000 | £’000 | £’000 | |
| Cost at 1 April 2024 | 6,300 | 22,544 | 12,377 | 3,474 | 71 | 44,766 | 9,855 | 54,621 |
| Transfers | - | - | 1,808 | 128 | (1,936) | - | - | - |
| Additions | - | - | - | - | 3,113 | 3,113 | 939 | 4,052 |
| Disposals | - | - | (231) | - | - | (231) | - | (231) |
| Cost at 31 March 2025 | 6,300 | 22,544 | 13,954 | 3,602 | 1,248 | 47,648 | 10,794 | 58,442 |
| Depreciation at 1 April 2024 | - | (5,698) | (9,517) | (2,993) | - | (18,208) | (5,504) | (23,712) |
| Depreciation charge | - | (634) | (1,574) | (136) | - | (2,344) | (1,812) | (4,156) |
| Released on disposals | - | - | 231 | - | - | 231 | - | 231 |
| Depreciation at 31 March 2025 | - | (6,332) | (10,860) | (3,129) | - | (20,321) | (7,317) | (27,637) |
| Cost at 1 April 2025 | 6,300 | 22,544 | 13,954 | 3,602 | 1,248 | 47,648 | 10,794 | 58,442 |
| Additions | - | - | - | 21 | 551 | 572 | 417 | 989 |
| Transfers | - | - | 302 | 1,359 | (1,661) | - | - | - |
| Acquisition of subsidiary | - | - | - | 813 | - | 813 | 384 | 1,197 |
| Disposals | - | - | - | - | - | - | - | - |
| Cost at 31 March 2026 | 6,300 | 22,544 | 14,256 | 5,795 | 138 | 49,033 | 11,595 | 60,628 |
| Depreciation at 1 April 2025 | - | (6,332) | (10,860) | (3,129) | - | (20,321) | (7,317) | (27,637) |
| Depreciation charge | - | (634) | (1,461) | (249) | - | (2,344) | (1,664) | (4,008) |
| Depreciation at 31 March 2026 | - | (6,966) | (12,321) | (3,378) | - | (22,665) | (8,981) | (31,646) |
| Net Book Value 31 March 2026 | 6,300 | 15,578 | 1,935 | 2,417 | 138 | 26,368 | 2,614 | 28,982 |
| Net Book Value 31 March 2025 | 6,300 | 16,212 | 3,094 | 473 | 1,248 | 27,327 | 3,478 | 30,804 |
Individual material assets include: Land and Buildings at our Head Office with net book value of £21,878k (2024-25 £22,512k)
Details of judgements relating to asset lives and impairment are given in Note 1.20
Right-Of-Use assets consist primarily of leased properties and vehicles for our field surveyors. The Group received income of £60k (2024-25 £59k) from sub-letting Right-Of-Use assets in the year.
The carrying amount of Right-Of-Use assets by asset class is as follows; Property £712k (2024-25 £1,053k), Vehicles £1,473k (2024-25 £2,344k) and IT Equipment £105k (2024-25 £80k).
| Company | Land | Buildings | IT Equipment | Equipment, facilities, & fixtures | Assets under construction | Total | Right of Use Assets | Total |
|---|---|---|---|---|---|---|---|---|
| £’000 | £’000 | £’000 | £’000 | £’000 | £’000 | £’000 | £’000 | |
| Cost at 1 April 2024 | 6,300 | 22,544 | 12,377 | 3,474 | 71 | 44,766 | 9,855 | 54,621 |
| Transfers | - | - | 1,808 | 128 | (1,936) | - | - | - |
| Additions | - | - | - | - | 3,113 | 3,113 | 939 | 4,052 |
| Disposals | - | - | (231) | - | - | (231) | - | (231) |
| Cost at 31 March 2025 | 6,300 | 22,544 | 13,954 | 3,602 | 1,248 | 47,648 | 10,794 | 58,442 |
| Depreciation at 1 April 2024 | - | (5,698) | (9,517) | (2,993) | - | (18,208) | (5,504) | (23,712) |
| Depreciation charge | - | (634) | (1,574) | (136) | - | (2,344) | (1,812) | (4,156) |
| Released on disposals | - | - | 231 | - | - | 231 | - | 231 |
| Depreciation at 31 March 2025 | - | (6,332) | (10,860) | (3,129) | - | (20,321) | (7,317) | (27,637) |
| Cost at 1 April 2025 | 6,300 | 22,544 | 13,954 | 3,602 | 1,248 | 47,648 | 10,794 | 58,442 |
| Additions | - | - | - | 21 | 551 | 572 | 415 | 987 |
| Transfers | - | - | 302 | 1,359 | (1,661) | - | - | - |
| Cost at 31 March 2026 | 6,300 | 22,544 | 14,256 | 4,982 | 138 | 48,220 | 11,209 | 59,429 |
| Depreciation at 1 April 2025 | - | (6,332) | (10,860) | (3,129) | - | (20,321) | (7,317) | (27,637) |
| Depreciation charge | - | (634) | (1,467) | (243) | - | (2,344) | (1,603) | (3,947) |
| Depreciation at 31 March 2026 | - | (6,966) | (12,327) | (3,372) | - | (22,665) | (8,919) | (31,584) |
| Net Book Value 31 March 2026 | 6,300 | 15,578 | 1,929 | 1,610 | 138 | 25,555 | 2,290 | 27,845 |
| Net Book Value 31 March 2025 | 6,300 | 16,212 | 3,094 | 473 | 1,248 | 27,327 | 3,478 | 30,804 |
Details of material company assets are included within the Group narrative above.
11. Inventories
| Group | 2025-26 | 2024-25 |
|---|---|---|
| £’000 | £’000 | |
| Finished Goods | 996 | 2,355 |
| Work in Progress | 385 | - |
| 1,381 | 2,355 |
| Company | 2025-26 | 2024-25 |
|---|---|---|
| £’000 | £’000 | |
| Finished Goods | 1,451 | 2,342 |
| 1,451 | 2,342 | |
| Stock provision at 31 March | 773 | 550 |
During the year Ordnance Survey wrote off and made allowance for potentially unsaleable stock of £223k (2024-25 reversal of £296k)
12. Trade and other receivables
| Group | 2025-26 | 2024-25 |
|---|---|---|
| £’000 | £’000 | |
| Trade Receivables | 5,713 | 4,948 |
| Cumulative impairment for Expected Credit Losses | (7) | (41) |
| 5,706 | 4,907 | |
| Other receivables | 69 | 230 |
| Taxation and social security receivable | 1,930 | 1,752 |
| Accrued income | 7,591 | 7,349 |
| Prepayments | 10,491 | 9,860 |
| 25,787 | 24,098 |
| Company | 2025-26 | 2024-25 |
|---|---|---|
| £’000 | £’000 | |
| Trade Receivables | 5,472 | 4,920 |
| Cumulative impairment for Expected Credit losses | (242) | (41) |
| 5,230 | 4,879 | |
| Other receivables | 44 | 213 |
| Taxation & Social Security Receivable | 1,695 | - |
| Accrued income | 7,396 | 7,166 |
| Prepayments | 10,285 | 9,791 |
| Loans owed by Group undertakings | 203 | - |
| Accrued income due from Group undertakings | 2,455 | 1,051 |
| Trade Receivables owed by Group undertakings | 262 | 71 |
| 27,570 | 23,171 |
The total bad debt written off in the year was £7k (2024-25: £nil).
Loans to Ordnance Survey International Services Limited are repayable on demand. Interest is charged to Ordnance Survey International Services Limited at Base Rate + 3%.
The fair value of trade and other receivables is not materially different to the book values above.
Before accepting any new customer, the Group uses an external credit scoring system to assess the potential customer’s credit quality and defines credit limits by customer. Limits and scoring attributed to customers are reviewed on a regular basis.
13. Cash and cash equivalents
| Group | 2025-26 | 2024-25 |
|---|---|---|
| £’000 | £’000 | |
| Balance held at Paymaster Generals Office | 84,635 | 65,108 |
| Balance held in commercial banks and cash in hand | 11,915 | 11,669 |
| 96,550 | 76,777 |
| Company | 2025-26 | 2024-25 |
|---|---|---|
| £’000 | £’000 | |
| Balance held at Paymaster Generals Office | 59,801 | 45,198 |
| Balance held in commercial banks and cash in hand | 9,380 | 10,510 |
| 69,181 | 55,708 |
14. Trade and other payables
| Group | 2025-26 | 2024-25 |
|---|---|---|
| £’000 | £’000 | |
| Trade payables | 6,785 | 3,493 |
| Taxation and social security payable | 55 | 502 |
| Other payables | 5,450 | 3,752 |
| Accruals | 15,326 | 19,230 |
| Dividend payable | 7,700 | 5,700 |
| 35,316 | 32,677 |
| Company | 2025-26 | 2024-25 |
|---|---|---|
| £’000 | £’000 | |
| Trade payables | 6,697 | 3,442 |
| Taxation and social security payable | - | 502 |
| Other payables | 5,450 | 3,752 |
| Accruals | 14,998 | 18,920 |
| Dividend payable | 7,700 | 5,700 |
| Intercompany payable | 8 | 123 |
| 34,853 | 32,439 |
The trade payables balance for both Group and Company includes long term payables of £nil (2024-25 £nil). The fair value of trade and other payables is not materially different to the book values above.
15. Lease Liabilities
Maturity Analysis - contractual, undiscounted cash flows
| Group | 2025-26 | 2024-25 |
|---|---|---|
| £’000 | £’000 | |
| At start of period | 3,448 | 4,311 |
| Additions | 419 | 939 |
| Assets acquired on purchase of subsidiary | 398 | - |
| Interest accrued in year | 152 | 181 |
| Payments | (1,784) | (1,983) |
| At end of period | 2,633 | 3,448 |
| Current liability | 1,238 | 1,608 |
| Non-Current liability | 1,395 | 1,840 |
| Obligations under leases | ||
| Not later than 1 year | 1,301 | 1,717 |
| Later than 1 year and not later than 5 years | 1,457 | 1,963 |
| Total undiscounted liabilities | 2,758 | 3,680 |
| less interest | (125) | (232) |
| At end of period | 2,633 | 3,448 |
The Group has no significant exposure due to variability in lease payments for the duration of above leases.
During the year the Group paid interest expense on lease liabilities £152k (2024-25 £181k)
Details of book value of right of use assets are given in note 10
| Group and company | 2025-26 | 2024-25 |
|---|---|---|
| £’000 | £’000 | |
| Minimum lease payments under operating leases as an expense in the year | 360 | 384 |
As at 31 March 2026, Ordnance Survey Ltd has future minimum lease payments under non-cancellable operating leases as set out below:
| Group and company | 2025-26 | 2024-25 |
|---|---|---|
| £’000 | £’000 | |
| Within 1 year | 489 | 691 |
| Between two and five years | - | - |
| 489 | 691 |
16. Provisions for liabilities and charges
| Group & company | Provision for Dilapidations | Total |
|---|---|---|
| £’000 | £’000 | |
| As at 1 April 2025 | 156 | 156 |
| Additional provision in year | 22 | 22 |
| As at 31 March 2026 | 178 | 178 |
The provisions balance is estimated as falling due as of 2027/28.
17. Deferred revenue
| Group | 2025-26 | 2024-25 |
|---|---|---|
| £’000 | £’000 | |
| Current deferred revenue - contracts with customers | 23,257 | 25,327 |
| Current deferred revenue - grant funding | 5 | 11 |
| Non-current deferred revenue | - | 1,037 |
| 23,262 | 26,375 |
| Company | 2025-26 | 2024-25 |
|---|---|---|
| £’000 | £’000 | |
| Current deferred revenue | 18,461 | 20,993 |
| Non-current deferred revenue | - | 851 |
| 18,461 | 21,844 |
Contract assets and contract liabilities
| Group | 2025-26 | 2024-25 |
|---|---|---|
| £’000 | £’000 | |
| Revenue recognised in the period from: Amounts included in contract liability at the beginning of the period | 25,913 | 24,009 |
| Revenue received in the period from: Performance obligations satisfied in previous periods | 914 | 731 |
The Group receives payments from customers based on the invoicing schedule, as established in the contracts. Contract assets relate to the Groups conditional right to consideration for completed performance under the contract. Accounts receivable are recognised when the right to consideration becomes unconditional. Contract liability relates to payments received in advance of performance under the contract. Contract liabilities were recognised as revenue as we perform services under the contract. No contract assets were impaired in the financial year ended 31 March 2026.
18. Deferred tax liability/asset
| Group | Losses | Provisions | Non-current assets | Total |
|---|---|---|---|---|
| £’000 | £’000 | £’000 | £’000 | |
| At 1 April 2024 | - | 169 | (3,398) | (3,229) |
| (Charged)/credited to the income statement | - | (28) | (1,762) | (1,791) |
| At 31 March 2025 | - | 141 | (5,160) | (5,020) |
| (Charged)/credited to the income statement | - | 613 | (289) | 324 |
| Recognised on acquisition | - | - | (171) | (171) |
| At 31 March 2026 | - | 754 | (5,620) | (4,866) |
| Company | Losses | Provisions | Non-current assets | Total |
|---|---|---|---|---|
| £’000 | £’000 | £’000 | £’000 | |
| At 1 April 2024 | - | 169 | (3,417) | (3,248) |
| (Charged)/credited to the income statement | - | (28) | (1,758) | (1,787) |
| At 31 March 2025 | - | 141 | (5,175) | (5,035) |
| (Charged)/credited to the income statement | - | 500 | (287) | 213 |
| At 31 March 2026 | - | 641 | (5,462) | (4,822) |
Taxable temporary differences on non-current assets arise due to the capital allowances claims in excess of depreciation or amortisation and use of research and development tax credits.
Ordnance Survey Leisure Limited
Ordnance Survey Leisure Limited generated a current year profit before tax of £3,138,000 (2024-25 profit: £4,665,000)
19. Share capital
| Group and Company | |
|---|---|
| £’000 | |
| Balance at 1 April 2024 | 34,000 |
| Acquisition | - |
| Balance at 31 March 2025 | 34,000 |
| Balance at 1 April 2025 | 34,000 |
| Acquisition | - |
| Balance at 31 March 2026 | 34,000 |
The company has issued 34,000,002 ordinary shares of £1 each.
No shares in Ordnance Survey Limited are held by or on behalf of its subsidiary undertakings.
20. Contingent liabilities and contingent assets
No significant contingent assets or liabilities noted for current year.
21. Capital and Other Financial commitments
At 31 March 2026, the company had the following capital commitments:
| Group and Company | 2025-26 | 2024-25 |
|---|---|---|
| £’000 | £’000 | |
| Contracts for future capital expenditure not provided in the financial statements | - | - |
Other financial commitments are non-cancellable contracts with suppliers, not already included on the statement of financial position which are not leases, PFI’s or other service concession arrangements;
| 31-Mar-26 | 31-Mar-25 | |
|---|---|---|
| £’000 | £’000 | |
| Not later than 1 year | 9,268 | 1,039 |
| Later than 1 year but not more than 5 years | 3,883 | 277 |
| Later than 5 years | - | - |
| Total | 13,151 | 1,316 |
The allocation of future cash flows is related to the contractual terms agreed with the supplier.
22. Financial Instruments
The Group’s financial instruments comprise cash deposits and other items such as trade receivables, receivables owing from joint ventures, trade payables, provisions and loans. The main purpose of these financial instruments is to finance the Group’s operations.
The main risks arising from the Group’s financial instruments are credit and liquidity risks. The Group’s policies for managing these risks are set to achieve compliance with the regulatory framework. The Group follows Government Accounting rules, negotiating contracts with suppliers or contractors in sterling or major international currencies such as the euro. The Group’s policy during the year on routine transactional conversions between currencies (for example, the collection of receivables and the settlement of payables) remained that these should be affected at the relevant spot exchange rate.
Credit risk
The Group is exposed to credit risk through its trade receivables over a number of sectors. The Credit Policy has a deemed level of risk acceptance for commercial business and higher credit risks are subject to credit checking using external sources.
Generally, payment terms are 30 days from date of invoice except in the consumer sector, where payment terms of 60 or 90 days prevail. The profile of debt not impaired is shown below:
| Credit risk | 2025-26 | 2025-26 | 2025-26 | 2024-25 | 2024-25 | 2024-25 |
|---|---|---|---|---|---|---|
| Gross | Expected Credit Losses | Net | Gross | Expected Credit Losses | Net | |
| £’000 | £’000 | £’000 | £’000 | £’000 | £’000 | |
| Not yet due | 5,484 | - | 5,484 | 4,110 | - | 4,110 |
| Past due 0-30 days [Note] | (67) | - | (67) | 748 | - | 748 |
| Past due 31-60 days | 244 | (1) | 243 | 46 | (41) | 5 |
| Past due 61-90 days | 28 | - | 28 | 1 | - | 1 |
| Past 90 days | 24 | (6) | 18 | 42 | - | 42 |
| Note: This is a negative value due to unallocated payments on account made by customers. |
In arriving at the impairment against trade receivables the following have been considered:
- An individual account-by-account rate for each debt tranche, applying this to the debt tranche at the end of the period.
- Any prior knowledge of debtor insolvency or other credit risk.
Disclosures on credit risk related to inter-company loans are provided in note 7.
Interest rate risk
The Group finances its operations through equity and retained profits thus is not exposed to interest rate risk.
Liquidity risk
The Group has maintained short-term liquidity throughout the year by management of its cash deposits.
Foreign exchange risk
The Group’s activities expose it primarily to the financial risks of changes in foreign currencies. The sensitivity analysis below has been determined based on the exposure to foreign exchange on the financial instrument balances at the reporting date and the stipulated change taking place at the beginning of the financial year and held constant throughout the reporting period. An increase of 5% of foreign exchange versus sterling would not result in any reduction of the Group’s profit (2024-25: £nil).
Fair value hierarchy
The carrying values of financial assets and liabilities at 31 March 2026 are considered to represent fair value. This is due to the short-term nature of the financial instruments held and carrying values of lease liabilities being based on the present value of future lease payments.
Interest rate risk profile
The interest rate profile of the Group’s financial assets and liabilities at 31 March 2026 are set out below. All balances are held in sterling.
Group
| Financial Assets | 2025-26 | 2025-26 | 2025-26 | 2024-25 | 2024-25 | 2024-25 | ||
|---|---|---|---|---|---|---|---|---|
| Fixed rate | Floating rate | Total | Fixed rate | Floating rate | Total | |||
| £’000 | £’000 | £’000 | £’000 | £’000 | £’000 | |||
| Cash at bank | - | 96,550 | 96,550 | - | 76,777 | 76,777 | ||
| Trade receivables | 5,706 | - | 5,706 | 4,907 | - | 4,907 |
Fixed and floating rates refer to the interest that may be receivable by the Group.
23. Related Parties
The Company is wholly owned by the Secretary of State for Science, Innovation and Technology which is a ministerial department of HM Government. The Secretary of State for Science, Innovation and Technology is regarded as a related party as it has both an ownership and customer role.
In the course of its normal business the Group provides mapping data and licences to both the private and public sectors.
During the year the Group had a significant number of material transactions with other governmental departments and central government bodies. Most of these transactions have been with the Secretary of State for Science, Innovation and Technology, Land Registry and the Scottish Government.
No other Board member, senior management or other related party has undertaken any material transactions with Ordnance Survey during the year. Compensation paid to management in the ordinary course of Group operations is given in the Remuneration Report.
Ordnance Survey Leisure Limited, is 100% owned by the company. At the 31 March 2026, Nicholas Giles and Steven Showell represented the company as Directors of Ordnance Survey Leisure Limited.
Ordnance Survey International Services Limited, is 100% owned by the company. At the 31 March 2026, Steven Showell represented the company as Director of Ordnance Survey International Services Limited.
Dennis Maps Limited is 100% owned by the company. At the 31 March 2026, Hazel Hendley and David Ball represented the Company as Directors of Dennis Maps Limited.
GeoPlace LLP is a joint venture LLP with Local Government Association. At 31 March 2026, John Kimmance and Steven Showell represented the Company on the Board of GeoPlace.
The results of Ordnance Survey Leisure Limited, Ordnance Survey International Limited, GeoPlace LLP and Dennis Maps Limited are included in the consolidated financial statements as described in the accounting policies.
The Group uses the exemption for government bodies not to disclose full details of related party transactions.
24. Control
The immediate parent undertaking and ultimate controlling party of the Company is the Secretary of State for Science, Innovation and Technology on behalf of HM Government.
The annual report and accounts for the Department of Science, Innovation and Technology is available at: GOV.UK Official documents
-
Revenue is total income generated. ↩
-
Adjusted EBITDA is EBITDA before one-off restructuring costs and gain on bargain purchase. The Group feels this better reflects underlying performance and enables a like for like comparison of group performance. ↩
-
EBITDA is defined as earnings before interest, tax, depreciation and amortisation. ↩
-
Operating cost efficiency is Operating costs expressed as a percentage of revenue ↩
-
Free cash flow is the cash flow generated by the Group before payment of dividends. ↩
-
Net Promotor Score is an index ranging from -100 to +100 that measures the willingness of customers to recommend a company’s products or services to others. It’s used as a proxy for gauging the customer’s overall satisfaction with a company’s product to service and the customer’s loyalty to the brand. ↩
-
Adjusted EBITDA is EBITDA before one-off restructuring costs and gain on bargain purchase. The Group feels this better reflects underlying performance and enables a like for like comparison of group performance. ↩