Equality objectives progress review 2019 to 2020
Updated 17 December 2020
Applies to England

© Crown copyright 2020
This publication is licensed under the terms of the Open Government Licence v3.0 except where otherwise stated. To view this licence, visit nationalarchives.gov.uk/doc/open-government-licence/version/3 or write to the Information Policy Team, The National Archives, Kew, London TW9 4DU, or email: psi@nationalarchives.gov.uk.
Where we have identified any third party copyright information you will need to obtain permission from the copyright holders concerned.
This publication is available at https://www.gov.uk/government/publications/ofsteds-equality-objectives-2016-to-2020/equality-objectives-progress-review-2019-to-2020
Introduction
This report is a review of our progress against our 2017–20 equality objectives. It covers the period April 2019 to March 2020.
We developed our equality objectives in consultation with our staff and equalities networks.
The objectives relate to how we inspect and our practice as an employer and contractor. As a result, this report does not include what we found in inspections in relation to equalities over the last year. We report on our inspection findings through individual inspection reports, research and evaluation reports, commentaries, blogs and Annual Reports.
Please send any questions or comments to: EDI@ofsted.gov.uk.
Objective 1
Ofsted will give due regard to equality, diversity and inclusion during inspection and in its research and evaluation work
This objective is broken down into 2 parts. The numbering relates to that within our 2017–20 equality objectives.
1.1 In making judgements, inspectors will consider whether those we inspect comply with their relevant duties set out in the Equality Act 2010 and, where applicable, the extent to which they promote British values and promote equality and diversity.
1.2 Where meaningful we will comment on outcomes for children and learners with relevant protected characteristics and we will continue our programme of local area special educational needs and/or disabilities (SEND) inspections (now known as area SEND inspections).
Actions
Our actions are to:
- be clear in all published inspection frameworks that inspectors will take the above factors into account
- provide training to inspectors on equality, diversity and inclusion and how to assess these on inspection
- ensure that we consider those with protected characteristics when setting and carrying out our research and analysis programmes
Success criterion
Inspectors report non-compliance with the Equality Act 2010 when encountered.
Update on objective 1 action: Be clear in all published inspection frameworks that inspectors will take the above factors into account
Education inspection framework
We have reported in previous years on how we fulfilled our duties under the Equality Act 2010 through our routine early years, school and further education inspections by following the common inspection framework that we introduced in 2015.
In September 2019, we began inspecting early years, schools and further education and skills against a new framework. We published an updated equality, diversity and inclusion statement alongside the publication of the education inspection framework (EIF) and associated inspection handbooks in May 2019.
In developing the new inspection arrangements, we considered how the framework, remit-specific inspection handbooks and resulting inspection practice could affect individuals or groups of people with protected characteristics. We also considered how the EIF met the 3 points of the public sector equality duty (PSED). The consultation process provided an opportunity for all stakeholders and members of the public to raise any concerns that they had about equality, diversity or inclusion. We considered these carefully and made changes to the framework and inspection handbooks in response.
As we explained in last year’s progress report, the EIF addressed a number of issues with the common inspection framework and its relationship with the wider accountability system. In particular, the EIF’s emphasis on the quality and substance of education addresses concerns about the curriculum being limited in some education providers due to a narrow focus on test and examination results and other internal performance measures. We identified the fact that this was something that could have a particularly detrimental impact on those with protected characteristics, especially those with SEND.
The EIF is clearer about the importance of high-quality education for all learners. Under the EIF, we consider whether education providers offer inclusive education and whether, for example:
- schools and early years providers are inclusive of children with SEND
- schools are removing some children with SEND from their rolls solely to improve published outcomes
- colleges and other further education providers are doing all they can to ensure that all learners are able to complete their courses
- the curriculum available for all learners, including the most disadvantaged and those with protected characteristics, is ambitious and meets their needs
The EIF contributes to eliminating discrimination and to advancing equality of opportunity through inspectors making judgements against the following criteria:
- the quality of education, which is clear that the entitlement to a high-quality education applies equally to all learners
- personal development, which makes clear the importance of a provider’s curriculum preparing learners for life in modern Britain. The criteria highlight the important role that providers are expected to play in equipping learners to be respectful citizens, developing their appreciation of diversity and ability to recognise and value the things we share in common and promoting respect for the different protected characteristics as defined in law
- leadership and management, which include the extent to which leaders have a clear and ambitious vision for providing high-quality, inclusive education for all, and the extent to which those with responsibility for governance ensure that the provider fulfils its legal duties, including those under the Equality Act 2010 and, if applicable, the PSED
The EIF is also intended to help Ofsted to have a positive impact in terms of developing good relations. The criteria for the behaviour and attitudes judgement include:
- the extent to which relationships among learners and staff reflect a positive and respectful culture
- whether leaders, teachers and learners create an environment where bullying, peer-on-peer abuse or discrimination are not tolerated
- the speed and effectiveness of the response to bullying, peer-on-peer abuse and discrimination, when these happen
We believe that focusing on these areas through education inspection enables us to be a force for improvement. We are introducing new quality assurance and national sampling processes to evaluate both the way we are working and the success of the framework. We will report on what we find in relation to equalities in future progress reports.
Area SEND inspection framework
We have reported previously on the development of the area SEND inspection framework and the way it takes into account equality, diversity and inclusion issues.
We have now completed the third year of the programme of inspections under the area SEND inspection framework. We continue to hear that these inspections are making a difference to children and young people with SEND and their families.
In July 2020, we published an evaluation of the area SEND inspection framework. We found that the inspections allow us to collect good evidence on how well areas identify children and young people with SEND and assess and meet their needs. The joint working between inspectorates allowed us to get a holistic picture of education and health provision, though there is a need for a greater emphasis on social care in future inspections.
Work has started on the development of the post-2021 SEND inspection programme with Care Quality Commission and Department for Education. We will report on progress in future years.
Initial teacher education inspection framework
During the year, we continued to work on our new initial teacher education (ITE) inspection framework, which we intend to inspect under from January 2021. After a public consultation, we published the final version of the ITE framework and handbook in June 2020, alongside an updated ITE equality, diversity and inclusion (EDI) statement.
As we note in the EDI statement, in developing the framework, we considered how the new framework, handbook and consequent inspection practice could affect individuals or groups of people with protected characteristics. We also considered whether the new framework meets the 3 aims of the PSED). We believe that the framework’s focus on high-quality education and training for trainee teachers will have a positive impact on trainees and, as a result, on the children and young people who they will go on to teach.
The new framework and handbook set out the criteria against which we will inspect all ITE partnerships. Under the new framework and handbook:
- as part of the initial evidence-gathering process, inspectors will ask for evidence from the ITE partnership that demonstrates how the partnership meets the requirements of the Equality Act 2010, including the PSED (where applicable)
- inspectors will consider how partnerships ensure that the training respects and teaches knowledge and application of the Equality Act 2010
- inspectors must establish the extent to which trainee teachers are prepared to be able to support pupils with SEND
We will monitor and evaluate implementation of the framework, including an evaluation against these aspects of inspection practice, when inspections begin in 2021.
Social care common inspection framework
We implemented the social care common inspection framework (SCCIF) in April 2017. Although it covers all types of children’s social care provision, the SCCIF is not a ‘one-size-fits-all’ framework. It reflects the unique and distinct aspects of each type of setting within the children’s social care sector. However, the evaluation criteria we use to make judgements and the accompanying guidance are, wherever possible, consistent across setting types.
The SCCIF sets out the way in which inspectors consider whether social care providers comply with their relevant duties as outlined in the Equality Act 2010 and, if applicable, the extent to which providers promote fundamental British values and equality and diversity.
Under the SCCIF, inspectors must evaluate the extent to which children are protected and helped to keep themselves safe from bullying, homophobic behaviour, racism, sexism, radicalisation and other forms of discrimination. Inspectors also consider the extent to which leaders and managers actively promote tolerance, equality and diversity.
We can take enforcement action, including emergency suspension or restricting numbers of children, if a provider’s poor approach to equality, diversity and inclusion seriously affect children’s safety and welfare.
We reviewed a representative sample (August 2019 to January 2020) of published regulatory reports. We found examples across all provision types of inspection reports that identified strengths and weaknesses of practice across the sector.
Inspections of local authority children’s services
We implemented the inspecting local authority children’s services (ILACS) framework from January 2018. Inspections under this framework look at local authority services and arrangements to help and protect children and to find permanent homes for those who are looked after, including through adoption.
The inspections consider the experiences and progress of children in care, wherever they live, including those children who return home, and care leavers.
ILACS reports show that equality, diversity and inclusion are regularly considered during these inspections. Disability, religion, culture and diversity are themes that arise in several of the reports, both positively and negatively. In our ongoing evaluation of the ILACS framework and its delivery, we have not found any concerns about inspection practice in relation to equality, diversity and inclusion.
Update on objective 1 action: Provide training to inspectors on equality, diversity and inclusion, and how to assess these on inspection
We required all staff to carry out ‘Understanding equalities and unconscious bias’ training and safeguarding training. These online training packages included modules aimed specifically at inspectors. All inspectors had to complete these by summer 2019. We are now using the modules as a refresher training package and within induction programmes. We will review these training packages to ensure that we continue to be in line with the wider Civil Service approach to equalities and inclusivity training and development.
Education
Inspectors were fully trained on the equalities expectations embedded in the EIF. In addition to training ahead of the implementation of the EIF, there was also:
- an early years inspection workforce spring 2020 conference, with a session on ‘ensuring a high-quality curriculum for all’, which included case studies relating to those with different protected characteristics
- a school inspection spring 2020 conference, which had 2 sessions on exploring behaviour, with clear links to curriculum and equalities themes
- a further education and skills Her Majesty’s Inspector (HMI) and Ofsted Inspector (OI) spring 2020 conference, which included material on raising awareness of lesbian, gay, bisexual and transgender (LGBT) issues in the further education and skills sector
Training plans for education inspectors had to change as a result of COVID-19 (coronavirus) restrictions, but the virtual summer 2020 training and development programme, which is optional development for all employed inspectors, included:
- a podcast on the changing nature of LGBT terminology
- a series of live webinars on understanding SEND
- a podcast on modern slavery
- a course on understanding autism
- modules on inspecting faith schools
As part of the September 2020 training, all schools HMI were expected to attend a webinar on updates to inspecting relationships, health and sex education and were also provided with a further update on separation by sex ahead of published guidance.
Social care
In addition to the corporate equality, diversity and inclusion training for inspectors, over the last year there has been a series of targeted training events and learning opportunities for all social care HMIs, social care regulatory inspectors and managers, including sessions on:
- positive environments where children can flourish
- understanding the health needs of children in care
- educational needs of children in care
A full programme of disability awareness training has also continued, with sessions held bi-monthly. We include new staff in this training as part of their induction as well as existing staff (social care regulatory inspectors and HMIs) who require refresher training.
As a result of COVID-19, the social care inspector conference planned for March 2020 was postponed and is now being arranged for 2021. The conference next year will involve keynote speakers talking about issues including:
- the importance of creating a sense of identity, belonging and self-worth for children in care
- understanding and providing the ‘right’ approach to autism when encountered on inspection
- responding to human trafficking and modern slavery
- the role of social care professionals in responding to each of these
Update on objective 1 action: Ensure that we consider those with protected characteristics when setting and carrying out our research and analysis programmes
In our research and evaluation work over the last year, we:
- published a report on school funding, which included a finding that local authority spending cuts and recent reductions in school budgets may have a negative impact on pupils with SEND in particular
- researched what good practice looks like in schools in relation to education about sex and sexual orientation; the research included looking at the possible tensions with other protected characteristics, such as religion
- carried out a project looking at the lived experiences of a sample of pupils with SEND in 2 local authorities; as well as the children and young people themselves, we also interviewed parents/carers, local authority staff and school staff
- published a commentary on behaviour management in schools, in which we pointed to the need for schools to make reasonable adjustments for pupils with SEND
- reported on moving to home education in secondary schools, which included a finding that pupils with SEND could be at more risk of being moved into home education at the behest of the school
- reported on the ITE curriculum, which included a finding that trainees feel that they are not always well prepared to work with pupils with SEND
- began a range of reviews of the national curriculum subjects across phases; inclusion of pupils with SEND in the curriculum will be a part of these reviews, as will curriculum access by sex and other protected characteristics, should concerns emerge
- reported on child sexual abuse in the family environment, including the extent to which ‘disabled children at risk of or subject to sexual abuse in the family environment are identified and protected’
- carried out joint targeted area inspections of children’s mental health services, which involved considering whether the protected characteristics of children and young people were taken into account when responding to their needs
In addition, our statistical work programme and analysis over the last year included:
- analysis of children looked after and child incident notification data, through which we have been looking at the differences in incident notification rates between boys and girls; we have also been working with the Office for National Statistics to consider aggregate patterns against the broader population
- analysis of pupil exclusions and schools with high levels of pupil movement, which included the difference between sexes and other protected characteristics
- research into why children enter children’s homes, which included a focus on ethnicity
- an initial review of the evidence on the impact of COVID-19 on different groups, including black and minority ethnic children; we also started to track the number of vulnerable children (those with SEND and children in need) attending school during the period of school closures
- analysis of attainment and progress data for single-sex schools and a consideration of the implications for inspection
Update against objective 1 success criterion: Inspectors report non-compliance with the Equality Act 2010 when encountered
Inspection reports are not exhaustive descriptions of all that happens on an inspection. Inspectors may discuss compliance with the Equality Act 2010, for example, but it may not feature in the final report because there were neither concerns raised nor particularly notable practice.
We have continued to refer to compliance with the Equality Act in state-funded schools reports over the last year, including both examples of good compliance and failure to comply. Maintained schools are required to comply with the PSED, which places greater obligations on public bodies than private entities.
Examples of recent reports raising issues related to the Equality Act are set out below. By ‘recent reports’, we mean those covering inspections during the 2019–20 inspection year or identified within this year and having been published since we compiled the last equalities objectives progress report.
In a school in the East of England, there were concerns pre-inspection that a twin-track curriculum was excluding those with certain protected characteristics. The outcome of the inspection was positive, including noting the work that was being done in respect of the school’s diverse intake.
In a report on a school in the North East, Yorkshire and Humber region, we reported that there was regular and widespread use of homophobic and racist language around the school, which was not always challenged by staff. Pupils were reported to have become ‘hardened’ to the language and did not report this behaviour because they did not expect staff to act. Pupils and parents expressed concerns that the school was not safe and unacceptable behaviour was not dealt with effectively. The school was judged inadequate for behaviour and attitudes, as well as for its overall effectiveness.
In an independent school in London, we raised concerns about unsuitable reading material in the school library. These texts raised concerns about the promotion of discriminatory views of women and certain faiths. The report did not find that the presence of the books had resulted in pupils’ development being undermined and the school was found compliant with schedule 10 of the Equality Act 2010.
In an early years setting in the South West, we reported that the provider met the needs of children with SEND well, working closely with parents and other professionals. However, we found that she had not considered well enough how to help children challenge negative attitudes about disabled people.
In 2 children’s home reports, we noted how one had made the home more LGBT-friendly and how the other had supported children to explore their ethnic heritage.
In an inspection of a local authority in the North West, we found that issues relating to children’s ethnicity are often not explored well.
In 2 inspections of voluntary adoption agencies, we found that the agencies were inclusive. One had increased its same-sex couple recruitment to 45% of all recruited families. We noted that this agency was aware of its need to increase its recruitment of black and minority ethnic families and that it had plans to target these families in a new recruitment campaign.
Objective 2
Ofsted will promote equal opportunities for its entire workforce, including both staff and directly contracted Ofsted Inspectors, tackling bullying and discrimination whenever it occurs
This objective is broken down into 3 parts. The numbering relates to that within our 2017–20 equality objectives.
2.1. Ofsted will continue to increase the diversity of its workforce.
2.2. Ofsted will continue to increase the diversity within its Senior Civil Service.
2.3. Ofsted will tackle unfair treatment and inappropriate behaviour to reduce the proportion of its staff, particularly those with protected characteristics, experiencing discrimination, bullying and harassment.
Equalities data helps us to identify the diversity of our workforce. This includes data on the protected characteristics as set out in the Equality Act 2010. We ask all staff to declare information about their ethnicity, disability status, sexual orientation and religion or belief. We also ask our contracted Ofsted Inspectors (OIs) to declare their diversity information. We are reporting on this information for the first time in this report.
Although Ofsted encourages staff to supply equalities data, this is not mandatory and reporting rates vary by characteristic. Those who do not wish to record their diversity data can record a ‘Prefer not to say’ response.
We have tracked our equalities data over a number of years. This report shows our progress against our published 2017–20 equality objectives for the reporting period 2019–20.
In this reporting period, we have made significant progress towards creating a truly inclusive environment. This is demonstrated through having achieved Disability Confident Leader status and a marked improvement in our Workplace Equality Index score. We also have taken steps to create more inclusive internal policies through our ‘Gender identity policy and procedure’ and our ‘Grievance policy and procedure’. The work of our employee networks continues to support an inclusive culture. The networks have increased the work they do together during this year.
While we remain committed to continuing to increase the diversity or our workforce, our disability and minority ethnic proportions have been generally static for last 3 reporting periods. We use blind recruitment practice and we have continued to promote inspection shadowing programmes for black and minority ethnic school leaders.
Improving the diversity of our workforce and senior civil servants
The information contained in this section of the report was taken as at 31 March 2019 and at 31 March 2020, unless otherwise stated. All employee numbers throughout the report are shown as a headcount, unless otherwise stated. We define employees as those on a permanent or fixed-term contract, and those who are seconded in or on loan to us on a full-time basis.
Note that percentages in all following sections have been rounded and may not add up to 100.
During 2019–20, we aligned our demographic reporting to report ‘Undeclared/Unknown’, rather than ‘Not known/declared’. Undeclared refers to an active non-declaration while unknown refers to individuals who have not entered the information.
Unless otherwise stated, all wider Civil Service comparisons are from the Cabinet Office Annual Civil Service Employment Survey, 31 March 2020. General population comparisons are provided from the 2011 census.
Ethnicity
Figure 1: Ethnicity breakdown by administrative, technical and professional (APT) grade
Download a zip file with the underlying data in csv format.
Figure 2: Ethnicity breakdown by Senior Civil Service (SCS) grade
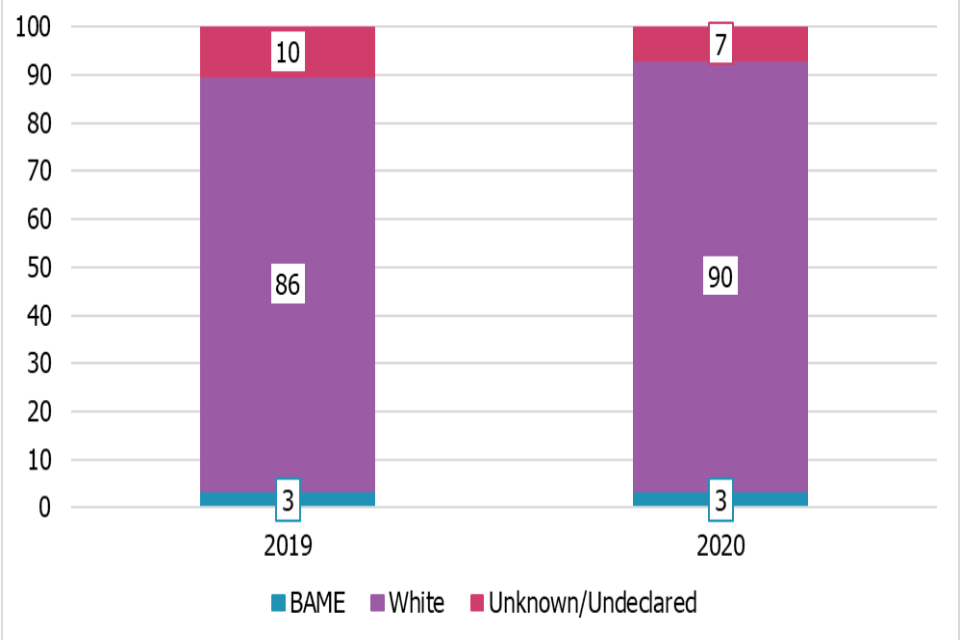
BAME includes ‘Black’, ‘Asian’, ‘Mixed’ and ‘Other ethnic backgrounds’. White includes ‘White’ and ‘Other White’.
Download a zip file with the underlying data in csv format.
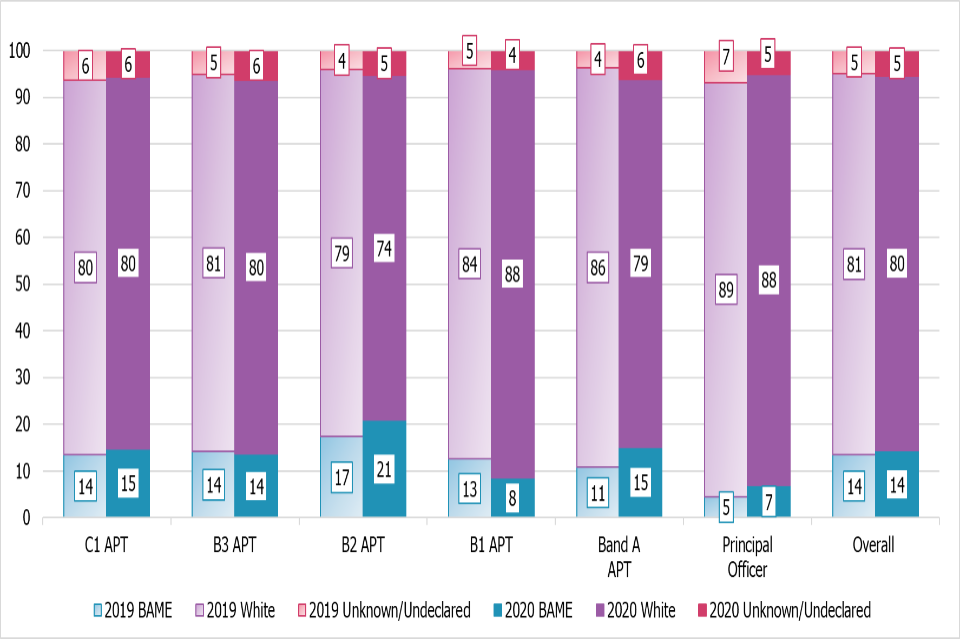
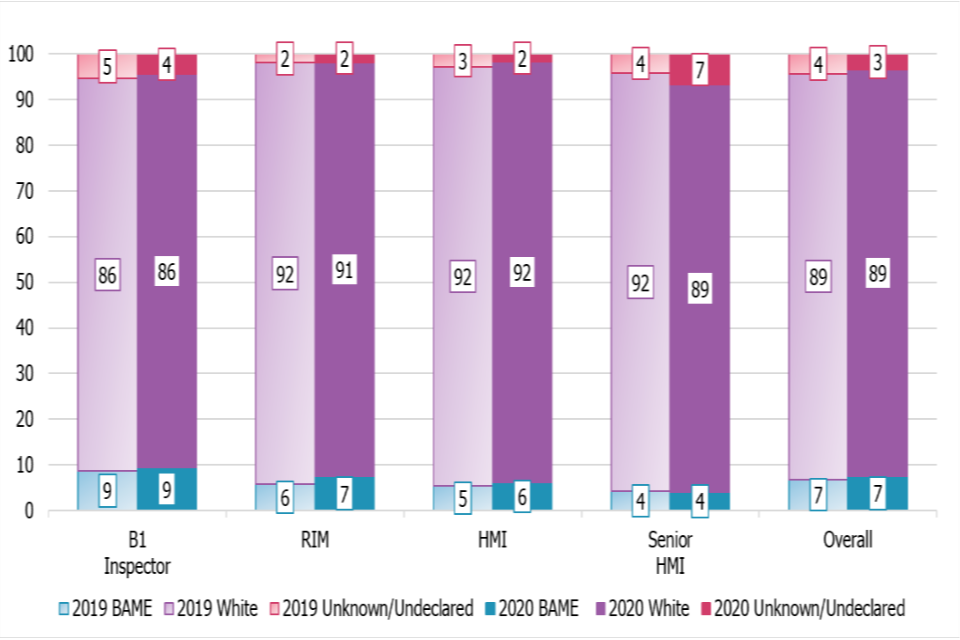
Figure 3: Ethnicity breakdown by inspector grade
Download a zip file with the underlying data in csv format.
Figure 4: Ofsted compared with Civil Service – BAME percentage by grade (if declared)
| Ofsted | Civil Service | |
|---|---|---|
| 31 March 2020 | ||
| C1 APT | 16 | 13 |
| B3 APT | 15 | 15 |
| B2/B1 APT | 16 | 12 |
| B1 Inspector | 10 | Specialist grade, no relevant comparator data available from the wider Civil Service |
| Band A APT/Principal Officer | 12 | 10 |
| Regulatory Inspection Manager (RIM) | 8 | Specialist grade, no relevant comparator data available from the wider Civil Service |
| HMI | 6 | Specialist grade, no relevant comparator data available from the wider Civil Service |
| Senior HMI | 4 | Specialist grade, no relevant comparator data available from the wider Civil Service |
| SCS | 4 | 8 |
| 31 March 2019 | ||
| C1 APT | 14 | 12 |
| B3 APT | 15 | 14 |
| B2/B1 APT | 16 | 11 |
| B1 Inspector | 9 | Specialist grade, no relevant comparator data available from the wider Civil Service |
| Band A APT/Principal Officer | 9 | 9 |
| RIM | 6 | Specialist grade, no relevant comparator data available from the wider Civil Service |
| HMI | 6 | Specialist grade, no relevant comparator data available from the wider Civil Service |
| Senior HMI | 4 | Specialist grade, no relevant comparator data available from the wider Civil Service |
| SCS | 4 | 8 |
All employee numbers only include active declarations and do not include ‘Unknown/Undeclared’. Where grades are combined, this is to ensure that the data is comparable to the Civil Service data set.
The overall percentage of BAME APT staff, including SCS employees, has remained at 14% for a third year (see figure 1). This aligns with the proportion of BAME people in England and Wales according to the 2011 census figure (14%) and is above the Civil Service proportion of 13%. While the overall proportion has not changed, we can see increases to the majority of APT grades excluding B1 APT, which has seen a decrease of 5 percentage points.
There is a 4 percentage point disparity between the proportion of SCS in Ofsted who have declared that they are BAME and the wider Civil Service. In terms of human beings, this means one fewer BAME person than we might expect, given the size of our group. We have taken steps to increase our minority ethnic representation in senior grades and these are outlined further in this section.
The percentage of employees who have declared their ethnicity as BAME within our inspector grades has also remained at 7% since 2019 (see figure 3). There have been minor fluctuations within the grade demographics, and an increase in ‘Unknown/Undeclared’ for senior HMI.
We will work with our senior HMI, B1 APT staff group and the Ethnic Equalities network to better understand the reasons for this and to agree targeted actions.
Improving our understanding of the diversity of our contracted workforce has also been one of our core areas of focus. Ofsted directly contracts with OIs to carry out inspections of early years, schools and further education and skills providers. In our last progress report, we outlined changes we were making to our inspector self-service portal and we made the commitment to share diversity data about our OIs in this year’s report. While we are able to honour this commitment for the majority of the groups discussed in this report, we are currently unable to provide the ethnic breakdown of our OIs. This is because the work to update the self-service portal, including updated ethnic categories that OIs can use to self-declare, has not been fully completed. As a result, there is currently a disparity in data because OIs have used outdated categories. We intend to have reliable data available for the 2020–21 report.
Our main activities to improve the diversity within our inspector workforce have continued to be our HMI shadowing programmes. In March 2019, the London region advertised the opportunity for middle leaders from minority ethnic backgrounds to participate in a year-long shadowing programme. This programme included a welcome day, an opportunity to feed back on the EIF and opportunities for shadowing experiences. This cohort was issued with a workbook so that their experiences could be collected and analysed. The shadowing experiences ran between December 2019 and March 2020. However, due to COVID-19, not all of the experiences were completed. This has delayed our evaluation of the programme, which we will now assess in 2020–21. We are committed to continuing this work with a further 3 cohorts.
The West Midlands region ran an HMI shadowing programme aimed at senior school leaders from minority ethnic backgrounds. This directly led to 4 participants applying to become OIs. A further success of this programme was that it helped the region to establish links with individuals who see Ofsted as a future career path. The West Midlands region intends to continue with this programme.
We are also continuing to take steps to improve the diversity of our most senior grades. A Civil Service expectation of SCS recruitment is that all SCS recruitment panels must have a member from a minority ethnic background and/or with a disability. Most SCS recruitment panels last year had diverse representation. One vacancy that did not follow this approach was an internal temporary promotion, where applications were received through an expression of interest.
Ofsted participates in the Civil Service Future Leaders and Senior Leader Scheme (FLS and SLS) and its associated positive action programme Minority Ethnic Talent Association (META), aimed at grade 6 and 7 civil servants. Unfortunately, in this reporting period, none of the 10 applicants won a place on the programme. We will support candidates to review their feedback and consider any further support that we need to provide next year.
The diversity of our senior grades stems, in part, from the lack of diversity in the sectors from which we recruit. This is especially true for inspector recruitment because this draws on the upper age ranges within the working population, where minority representation is lower than in the population as a whole. We continue to advertise all SCS posts externally by default. We continue to use social media, such as LinkedIn and Twitter, as a recruitment channel. This provides us with a greater opportunity to broaden our reach and connect with a diverse range of candidates who want to work for Ofsted. We continually review recruitment data, such as by monitoring the recruitment stages reached by protected characteristics, in order to identify trends and areas of further improvement.
Our overall 2019 People Survey engagement index was 71%. The engagement indexes for the minority ethnic group was 70% (‘Black/Black British’ 65%, ‘Asian/Asian British’ 74%, ‘Mixed’ 68%) compared with ‘White British’ at 73%.
Internally, our Ethnic Equalities network has continued to support colleagues as they look to progress in their careers. This includes members of the network sharing blogs on Ofsted’s intranet talking about their career journeys.
The network also took part in Black History Month, with colleagues sharing their reflections on the achievements of black Britons or black academics.
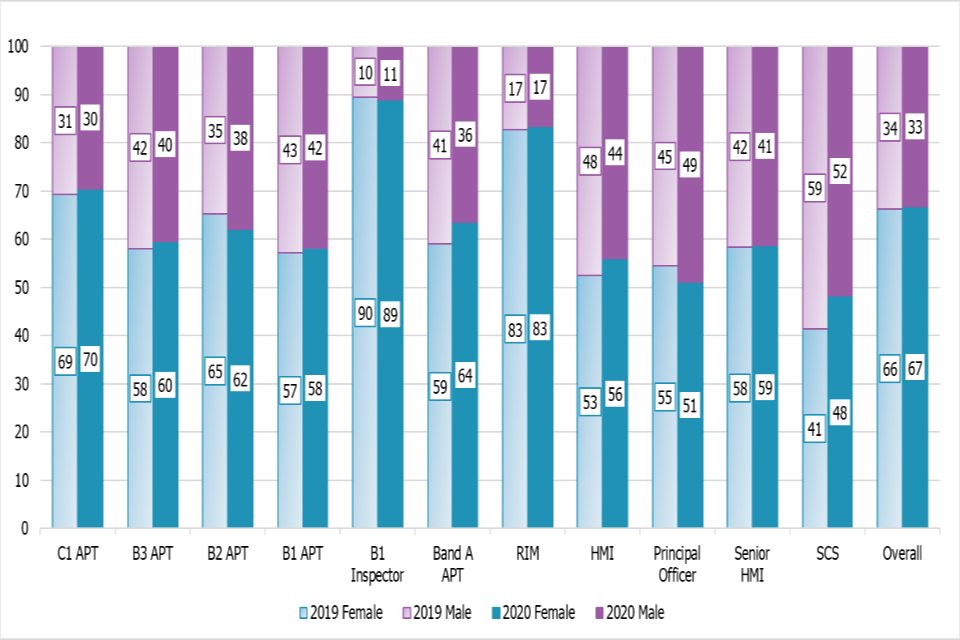
Gender
Figure 5: Gender breakdown by grade
Download a zip file with the underlying data in csv format.
Figure 6: OI gender breakdown
Download a zip file with the underlying data in csv format.
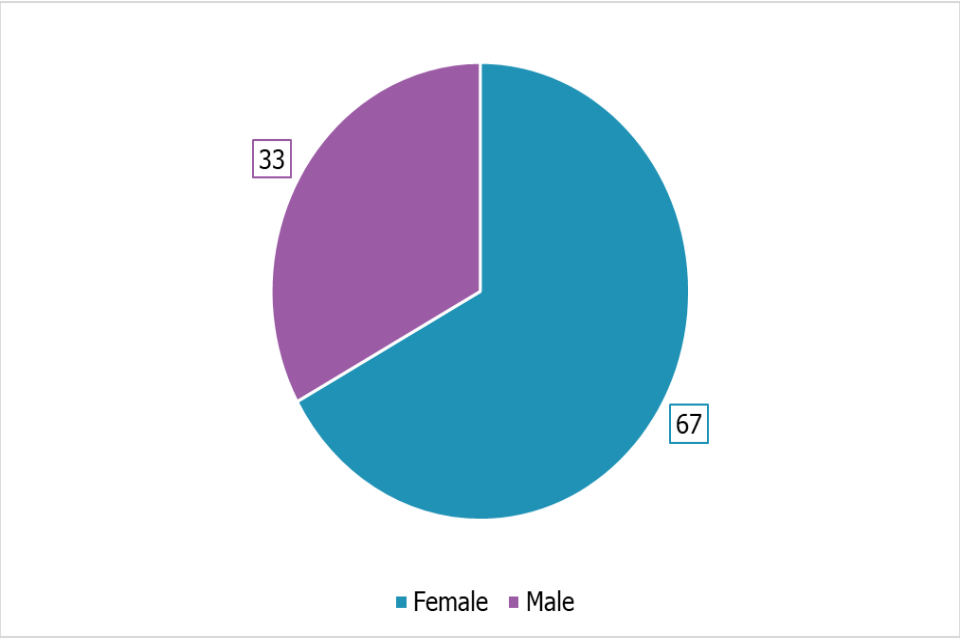
Our overall female gender profile has remained stable, with a small increase from 66% to 67%. This is higher than the wider Civil Service, which has a 54% female population. B1 inspectors continue to have the highest female demographic of all the grades, followed by regulatory inspection managers (RIMs). We continue to attribute this to the sectors from which we recruit B1 inspectors and the impact of the early years insourcing in 2018. While most grade populations have remained stable, we can see that the female band A population has increased by 5 percentage points and the Principal Officer male population has increased by 4 percentage points. Our SCS group has also seen a fluctuation of 7 percentage points, leading to a greater gender balance in these grades.
For the first time, we are able to report on our OIs’ gender breakdown. The OI breakdown is reflective of the wider gender breakdown of our inspection grades and the fact that our workforce is predominantly female.
In line with gender pay gap reporting legislation, Ofsted published its third gender pay gap report on 23 January 2020. The gender pay gap shows the difference in the average earnings between all men and women in an organisation. Ofsted’s 2019 gender pay gap report shows that the median gender pay gap has fallen to 0%. The mean gender pay gap has decreased from 11.4% to 6.6% and the median bonus gender pay gap has also decreased by 25% to 7.7%. This means that, although men continue to be paid more than women, there has been a substantial narrowing of the gap between the sexes.
Ofsted operates a spot rate model, which means that salaries are set for each grade. This model removes the pay inequality that can arise from the ability to negotiate salaries or through having pay ranges linked to length of service. It therefore supports equal pay for equal work. We are committed to fair pay irrespective of gender and continue to promote equal opportunities for our entire workforce.
In the 2019 gender pay gap report, we committed to launching a new gender-based network. Ofsted’s Women’s Network launched on 27 January 2020. It aims to support women to develop and progress in their careers confidently. There was a marked interest across the organisation in this group; 109 individuals responded to a survey aimed at setting the direction of the group. The network celebrated International Women’s Day by organising a webinar for all staff that invited Her Majesty’s Chief Inspector to share her experiences as a female leader. One hundred and eighty-six staff members attended this event.
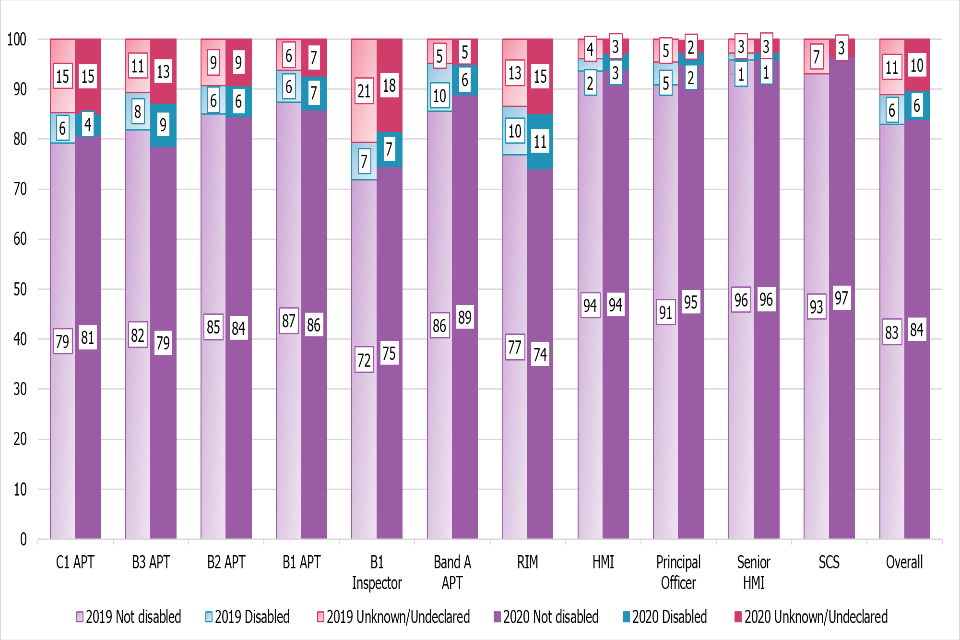
Disability
Figure 7: Disability breakdown by grade
Download a zip file with the underlying data in csv format.
Figure 8: OI disability breakdown

Download a zip file with the underlying data in csv format.
Our overall disability profile has remained at 6% for a third year, which is well below the Civil Service figure of 12%. Most grades have seen minor increases in the disabled population. However, there has been a decrease of 4 percentage points in the band A population and decreases in the principal officer and C1 populations. We continue to have higher levels of non-declaration for disability than for other characteristics.
This attitude towards declaration is also reflected in our OI data. Sixty-four per cent of OIs’ disability information is categorised as ‘Unknown/Undeclared’. As a result, it is difficult to analyse how comparable the OI data is with our employed inspector grades. However, it is evident that OIs’ disability declaration is marginally lower than for our HMI and senior HMI grades.
We have looked at improving the diversity of our senior grades by supporting targeted talent development. We advertised offers such as the Civil Service Reach mentoring programme, which is a disability mentoring programme for grade 6 and 7 civil servants, to our workforce. This is in addition to the FLS and access to the bespoke Disability Empowers Leadership Talent (DELTA) offer, which is available for individuals who gain a place on the FLS and have a disability or long-term health condition.
We have continued to make sure that our services meet the required accessibility standards. This year, this included developing a new web recruitment platform for inspector recruitment campaigns, which our Disability at Work network supported by reviewing the portal ahead of its launch. The APT recruitment platform is developed and maintained by the Government Recruitment Service, which centrally risk assesses for accessibility.
We are also reviewing the accessibility of our internal learning platform, LearnSpace. We are working towards ensuring that all new e-learning courses meet accessibility criteria. We will review existing content and structures in 2020–21.
On 8 April 2019, we achieved Disability Confident Leader status through an assessment by an external validator. We received favourable feedback on our self-assessment. This included positive feedback on the transparency of our recruitment practice and procedure and the support we offer to those with a long-term health condition or disability. To maintain this status, we encourage all of those in our supply chain to take part in the Disability Confident programme. We will be submitting an updated self-assessment in January 2022.
We have increased our disability and mental health learning offer through the launch of the ‘Managing cancer in the workplace’ and ‘Mental health awareness’ e-learning packages. Since their launch, 77 people have completed ‘Managing cancer in the workplace’ and 21 people have completed the ‘Mental health awareness’ e-learning.
Our mental health first aiders (MHFAs) scheme is now well established. We have 60 fully trained MHFAs, who are a point of contact for anyone who is experiencing a mental health issue or emotional distress. There is a requirement that MHFAs complete refresher training every 3 years and, to meet this requirement, we have an internal mental health trainer.
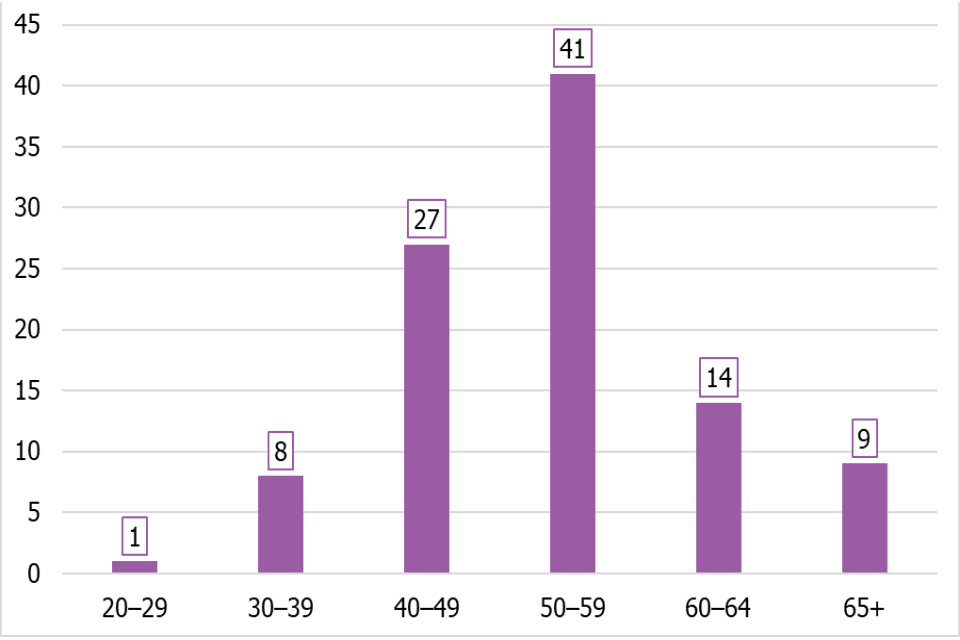
Age
Download a zip file with the underlying data in csv format.
Figure 9 shows that there has been little fluctuation in our employees’ ages. We continue to have a higher proportion of staff over 40 than the Civil Service overall. This is likely due to the specific and extensive sector knowledge required for our inspection posts (Annex B). Our C1 APT, B3 APT and B2 APT staff have the widest diversity in terms of age, with representation in each of the age groups.
Figure 10 shows the age demographic for our OIs. This broadly aligns with our knowledge of the employed inspector age demographic, although there is limited representation in the 25 to 29 category. As with our employed inspection workforce, this is due to the specific experience required for the role.
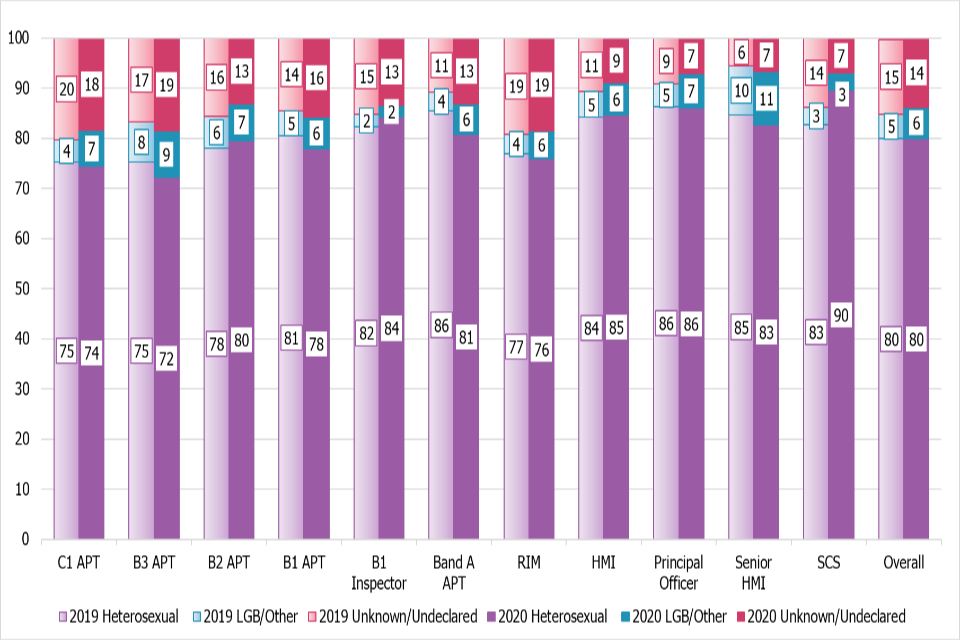
Sexual orientation and gender identity
Figure 11: Sexual orientation breakdown by grade
Download a zip file with the underlying data in csv format.
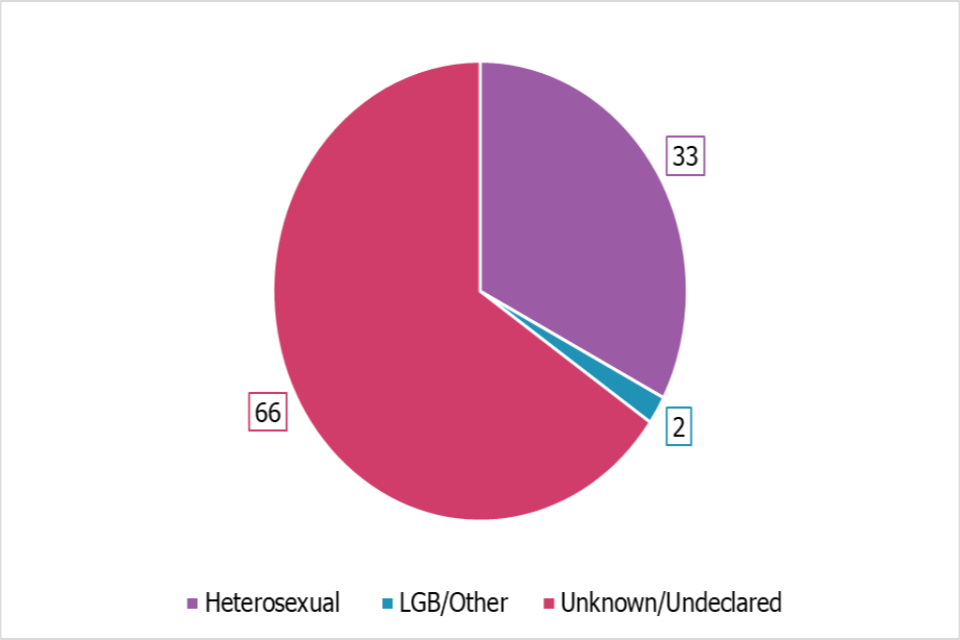
Figure 12: OI sexual orientation breakdown
Download a zip file with the underlying data in csv format.
Our sexual orientation declaration is high compared with the wider Civil Service, at 86% compared with 58%. However, the percentage declaring ‘LGB/Other’ is broadly aligned with the wider Civil Service figure, at 6% compared with 5%. Compared with the other protected characteristic groups, sexual orientation continues to have higher levels of non-declaration, at 14% overall. We are committed to the wider Civil Service action of better monitoring of sexual orientation and gender identity. We will align our systems with centralised Civil Service question sets and encourage our staff to declare this characteristic.
Figure 12 shows the sexual orientation breakdown of our OIs. As with our disability data for this group, most respondents were in the ‘Undeclared/Unknown’ category and, as a result, the data is not a reliable representation of this demographic.
Our People Survey 2019 engagement results indicate that bisexual respondents are the most engaged group, at 78%, followed by heterosexual respondents at 73%, then gay and lesbian respondents at 71% (in line with the Ofsted average).
Ofsted’s ‘Rainbow Alliance’ staff network supported work to respond to Stonewall’s Workplace Equalities Index. The scope of this included Ofsted systems, policies and processes. We saw significant improvement between the 2019 and 2020 index results.
The network celebrated LGBT History Month by hosting drop-in sessions with network members where colleagues could physically or virtually talk to members of the network about their LGBT+ experience in Ofsted. Additionally, the network hosted a poetry competition to more broadly fit within the LGBT History Month theme of Poetry, Plays and Reconciliation.
The network is supported by network ambassadors, who are leaders within the group and visible points of contact for the organisation.
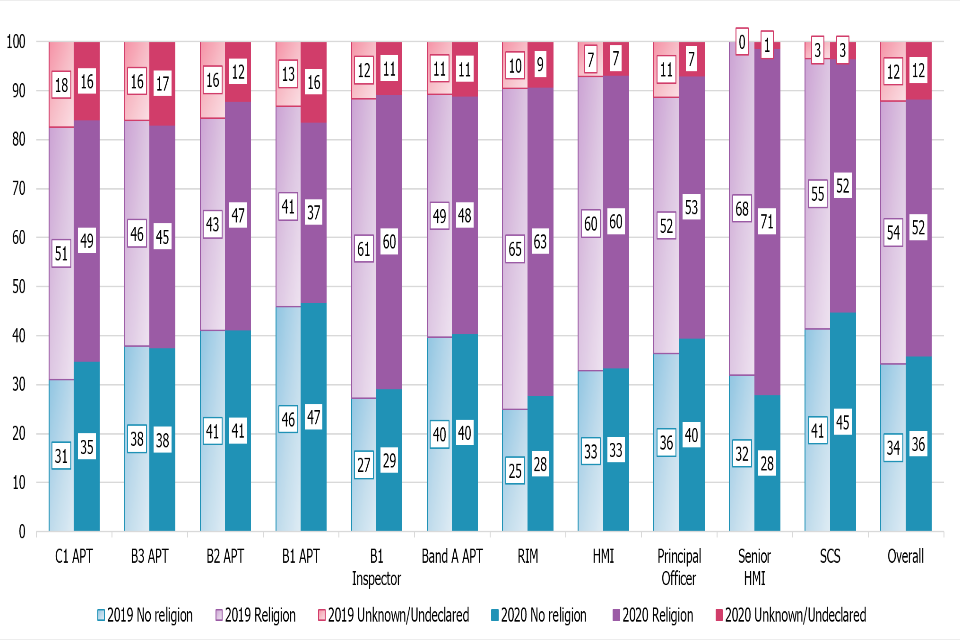
Religion and belief
Figure 13: Religious breakdown by grade
Download a zip file with the underlying data in csv format.
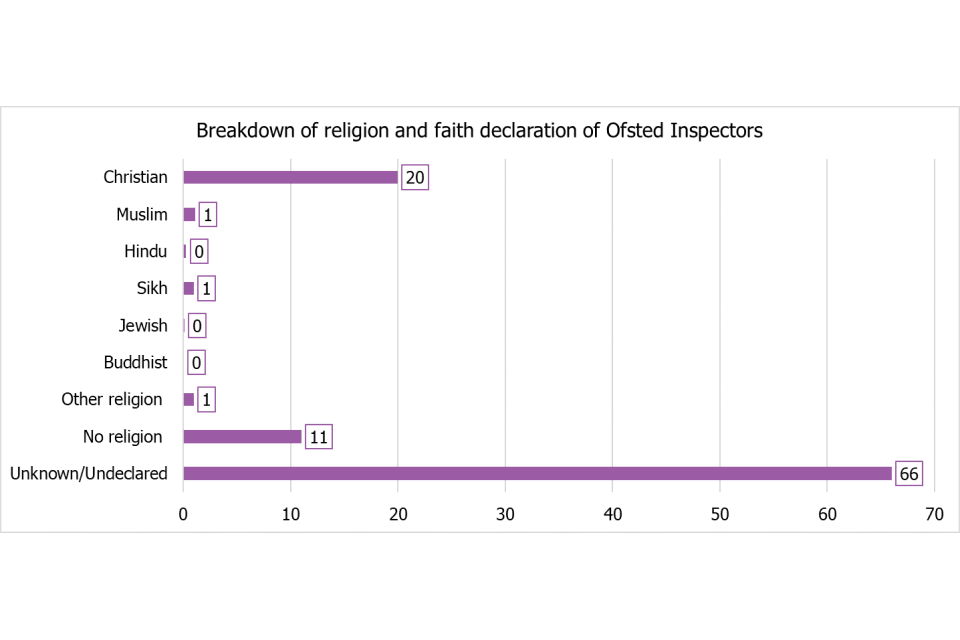
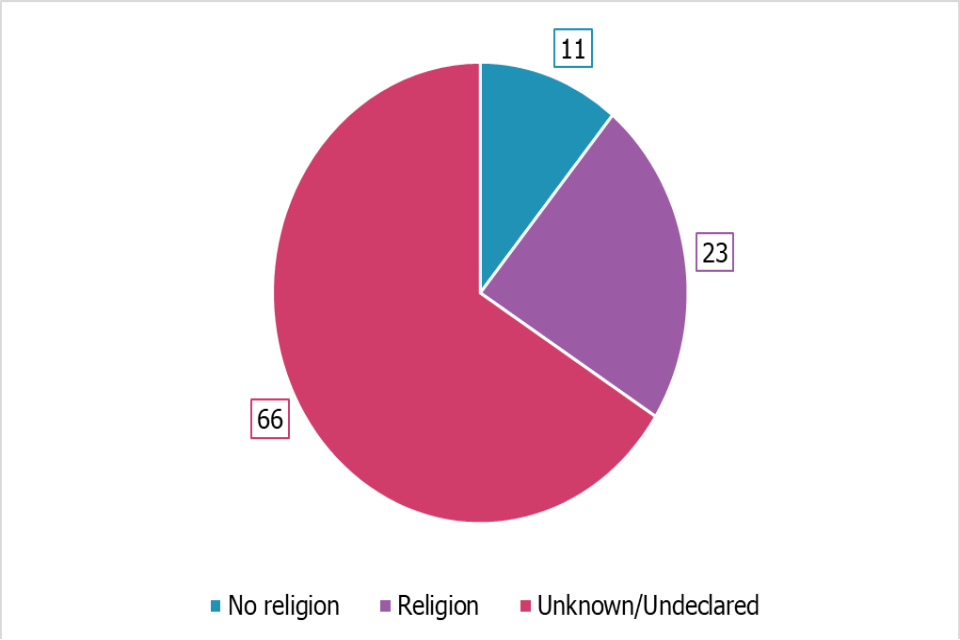
Figure 14: Ofsted inspector religious breakdown
Download a zip file with the underlying data in csv format.
Our organisational profile shows that ‘Christian’ remains the most declared faith group, at 45% compared with 52% in the wider Civil Service, followed by ‘No religion’ at 36%. (Annex C shows our faith-specific grade breakdown). Our ‘No religion’ category is broadly aligned to the wider Civil Service, with 38% of civil servants declaring in this way.
While there is a greater ‘Muslim’ representation in the wider Civil Service by one percentage point, we align with the ‘Any other religion’, ‘Hindu’ and ‘Sikh’ categories. Like the wider Civil Service, we have less than 1% representation for ‘Judaism’ and ‘Buddhism’.
As with sexual orientation and disability, the faith demographic for our OIs is largely made up of the ‘Unknown/Undeclared’ category. The specific faith breakdown of OIs can be found in Annex C.
The People Survey engagement scores across the different religions within Ofsted are: ‘Christianity’ 74%, ‘Hindu’ 78%, ‘Muslim’ 69%, ‘Any other religion’ 73% and ‘No religion’ 71%.
Our Religion and Faith network’s core aim is to increase understanding and religious literacy across the organisation. To meet this aim, the network has focused on communications throughout the year, including promoting the Civil Service Faith and Belief Toolkit, and building a calendar of religious dates across the faiths, which is hosted on its intranet page.
The network has also started to use Yammer to communicate more informally with colleagues on these topics.
Recruitment and development throughout 2019–20
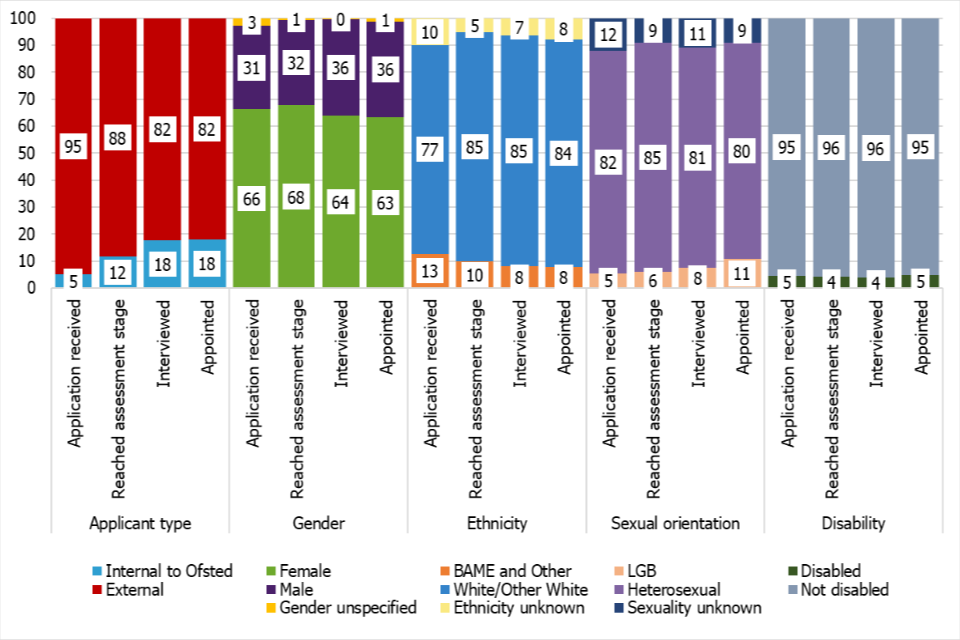
Figure 15: Recruitment stages reached by applicant type for SCS and inspection posts
Download a zip file with the underlying data in csv format.
Internal candidates continue to be more likely to progress at each stage of the selection process for SCS and inspection posts. However, the proportion of external candidates applying has risen by 14 percentage points compared with in 2018–19.
The majority (82%) of appointments have been external candidates. This is a significant increase compared with 48% of appointments in 2018–19. We employed a range of strategies in 2019–20 to attract greater interest from external candidates. These included the introduction of interactive online candidate packs, representation at conferences and events, and increased promotion on popular platforms such as LinkedIn and Twitter.
The proportions of male and female candidates remain steady. The percentage of female candidates applying and progressing has been similar to 2018–19. The majority (63%) of appointments are female candidates, although this is a decrease of 7 percentage points compared with 70% of appointments in 2018–19.
The proportion of applications received from BAME candidates has decreased by 3 percentage points compared with in 2018–19. However, there has been an increase of 3 percentage points in applications received from candidates choosing not to disclose their ethnicity. The percentage of BAME candidates appointed has risen from 7% in 2018–19 to 8%. We continue to anonymise applications in the early stages of the selection process.
The proportion of lesbian, gay and bisexual (LGB) candidates applying and progressing to interview continues to be high. There is an upward trend in the likelihood of success for LGB candidates, who now account for 5% of applications and 11% of appointments.
The percentage of candidates with a declared disability remains constant, mirroring 2018–19 at each stage of the selection process. There has been a 1 percentage point increase in the appointment of candidates with declared disabilities.
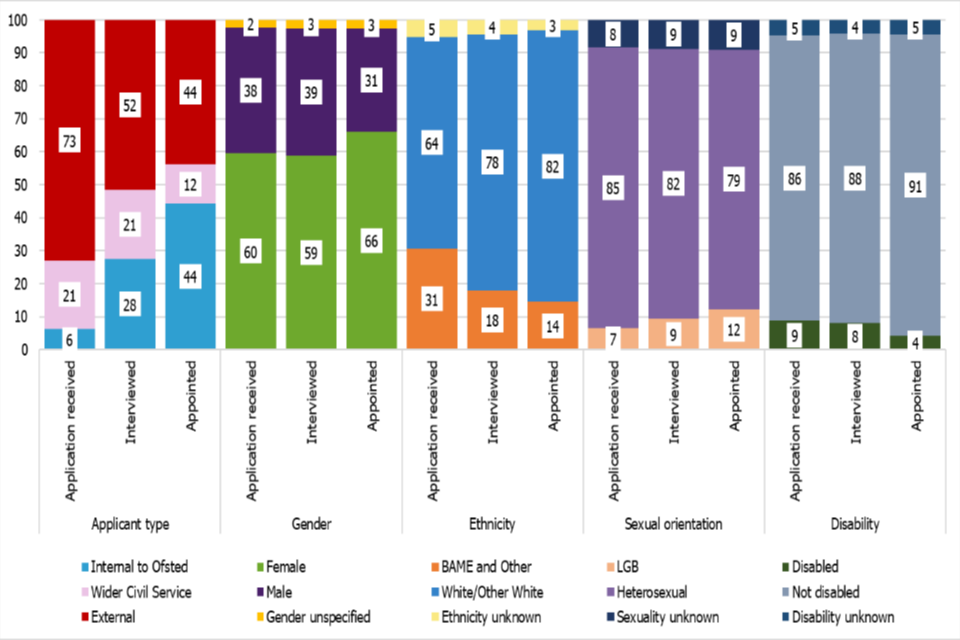
Figure 16: Recruitment stages reached by applicant type for APT posts
Download a zip file with the underlying data in csv format.
Internal candidates continue to be more likely to progress at each stage of the selection process for APT roles. The proportions of external candidates and candidates applying from the wider Civil Service remain similar to 2018–19. There has been a marginal rise of 3 percentage points in appointments of external candidates compared with the proportions in 2018–19.
The proportions of male and female candidates remain steady. The percentage of female candidates applying and progressing has been similar to 2018–19. The majority (66%) of appointments continue to be female candidates.
The proportion of BAME candidates applying decreased by 6 percentage points compared with the proportion in 2018–19. However, the proportion of BAME candidates appointed remains steady at 14%. White candidates continue to be disproportionately more likely to succeed at each stage of the selection process in spite of the introduction of anonymised applications to reduce unconscious bias.
The proportion of LGB candidates applying and progressing mirrors the proportion in 2018–19, with the exception of a 2 percentage point rise in the appointment of LGB candidates. There is a positive trend in the likelihood of success for LGB candidates applying for inspection/SCS roles. LGB candidates account for 7% of applications, but 12% of appointments. The percentage of LGB candidates appointed has risen 2 percentage points, from 10% in 2018–19.
The proportion of candidates with a declared disability applying and progressing to interview remains steady compared with the proportion in 2018–19. However, the proportion of appointments of candidates with declared disabilities has fallen by 3 percentage points.
Eliminating discrimination, bullying and harassment
Ofsted’s anti-bullying, harassment and discrimination working group continues to work to address this issue. The group has publicised the ‘Sue Owen Review of Arrangements for Tackling Bullying, Harassment and Misconduct in the Civil Service’ and determined what it could do to support the implementation of the recommendations internally. This includes directly engaging with senior managers and staff on bullying, harassment and discrimination scores reported through the 2018 People Survey and working more closely with senior leaders to align the organisational approach to this issue.
The group has worked with HR to develop a new grievance policy and procedure, including associated guidance on how to tackle bullying, discrimination and harassment. This was launched in September 2019.
The group has publicised a range of resources on bullying, harassment and discrimination to further raise awareness and understanding of this issue. This includes launching an intranet page to house these resources and promoting Stand Up to Bullying day and the cross-government ‘Speak Up’ campaign.
The percentage of staff reporting discrimination, bullying and harassment remains below Civil Service averages. Results from the 2019 People Survey indicated that reports of discrimination have decreased by 1 percentage point to 7% (the Civil Service average is 13%). However, reports of bullying and harassment have increased by 2 percentage points to 8% (the Civil Service average is 12%). We have set up a joint working group with the trade union side and staff networks to better understand the experience of protected groups and make recommendations for further actions to our Executive Board.
Annex A – Ofsted grade structure
Ofsted’s current grade structure broadly compares with the wider Civil Service grades.
APT job family:
- Senior Civil Service
- Principal Officer (Civil Service equivalent – Grade 6)
- Band A APT (Civil Service equivalent – Grade 7)
- B1 APT (Civil Service equivalent – Senior Executive Officer)
- B2 APT (Civil Service equivalent – Higher Executive Officer)
- B3 APT (Civil Service equivalent – Executive Officer)
- C1 APT (Civil Service equivalent – Administrative Officer)
Inspector job family:
- Senior Civil Service
- Senior HMI (Civil Service equivalent – Grade 6)
- HMI (Civil Service equivalent – Grade 7)
- RIM (Civil Service equivalent – Grade 7)
- B1 Inspector (Civil Service equivalent – Senior Executive Officer)
- B2 Inspector (Civil Service equivalent – Higher Executive Officer)
Annex B – Age declaration by grade from 31 March 2019 and 31 March 2020
31 March 2019 – Percentage of employees in age categories
| Total number of employees | 16-19 | 20-29 | 30-39 | 40-49 | 50-59 | 60-64 | 65+ | Unknown/ undeclared | |
|---|---|---|---|---|---|---|---|---|---|
| March 31 2020 | |||||||||
| Overall | 1,774 | 0 | 9 | 23 | 28 | 31 | 7 | 2 | - |
| C1 APT | 250 | 3 | 23 | 22 | 20 | 22 | 7 | 2 | - |
| B3 APT | 205 | - | 22 | 31 | 26 | 15 | 4 | - | - |
| B2 APT | 206 | - | 19 | 44 | 19 | 14 | 4 | - | - |
| B1 APT | 177 | - | 8 | 41 | 30 | 18 | - | - | - |
| B1 Inspector | 342 | - | - | 13 | 31 | 43 | 11 | - | - |
| Band A APT | 99 | - | - | 40 | 38 | 19 | - | - | - |
| RIM | 54 | - | - | - | 43 | 48 | - | - | - |
| HMI | 293 | - | - | 6 | 26 | 51 | 9 | 4 | - |
| Principal Officer | 43 | - | - | 42 | 31 | 26 | - | - | - |
| Senior HMI | 75 | - | - | - | 28 | 53 | 17 | - | - |
| SCS | 29 | - | - | - | 28 | 55 | - | - | - |
| March 31 2019 | |||||||||
| Overall | 1,685 | 1 | 7 | 24 | 27 | 32 | 7 | 2 | - |
| C1 APT | 251 | 5 | 18 | 27 | 18 | 23 | 6 | 2 | - |
| B3 APT | 198 | - | 19 | 37 | 26 | 13 | 4 | 2 | - |
| B2 APT | 173 | - | 14 | 47 | 20 | 13 | 4 | - | - |
| B1 APT | 159 | - | 7 | 42 | 31 | 16 | - | - | - |
| B1 Inspector | 334 | - | - | 12 | 32 | 44 | 11 | - | - |
| Band A APT | 83 | - | - | 40 | 40 | 18 | - | - | - |
| RIM | 52 | - | - | - | 42 | 52 | - | - | - |
| HMI | 280 | - | - | 4 | 27 | 54 | 11 | 5 | - |
| Principal Officer | 44 | - | - | 34 | 30 | 30 | - | - | - |
| Senior HMI | 72 | - | - | - | 26 | 26 | 15 | - | - |
| SCS | 29 | - | - | - | 31 | 31 | - | - | - |
1. Percentages are rounded and may not add to 100.
2. Percentages that round down to zero or are calculated with fewer than 5 individuals are not shown in this table and are instead represented by a dash.
3. Percentages that are less than 1% but represent 5 or more individuals are represented by <1.
Annex C – Breakdown of religion and faith declaration by grade from 31 March 2019 and 31 March 2020
| Total number of employees | % Unknown/ undeclared | % No religion | % Other religion | % Buddhist | % Jewish | % Sikh | % Hindu | % Muslim | % Christian | |
|---|---|---|---|---|---|---|---|---|---|---|
| March 31 2020 | ||||||||||
| Overall | 1,774 | 12 | 36 | 2 | - | <1 | 1 | 2 | 3 | 45 |
| C1 APT | 250 | 16 | 35 | 3 | - | - | - | 3 | 4 | 37 |
| B3 APT | 205 | 17 | 38 | 3 | - | - | - | - | 4 | 36 |
| B2 APT | 206 | 12 | 41 | 3 | - | - | - | 4 | 4 | 32 |
| B1 APT | 177 | 16 | 47 | - | - | - | - | - | - | 32 |
| B1 Inspector | 342 | 11 | 29 | 1 | - | - | - | - | 1 | 54 |
| Band A APT | 99 | 11 | 40 | - | - | - | - | 5 | - | 38 |
| RIM | 54 | 9 | 28 | - | - | - | - | - | - | 57 |
| HMI | 293 | 7 | 33 | - | - | - | - | - | 2 | 56 |
| Principal Officer | 43 | - | 40 | - | - | - | - | - | - | 47 |
| Senior HMI | 75 | - | 28 | - | - | - | - | - | - | 71 |
| SCS | 29 | - | 45 | - | - | - | - | - | - | 52 |
| March 31 2019 | ||||||||||
| Overall | 1,685 | 12 | 34 | 2 | <1 | - | 1 | 2 | 2 | 46 |
| C1 APT | 251 | 18 | 31 | 3 | - | - | - | 3 | 4 | 40 |
| B3 APT | 198 | 16 | 38 | 5 | - | - | - | 3 | 5 | 34 |
| B2 APT | 173 | 16 | 41 | 3 | - | - | - | 3 | 3 | 32 |
| B1 APT | 159 | 13 | 46 | - | - | - | - | - | - | 24 |
| B1 Inspector | 334 | 12 | 27 | 1 | - | - | - | - | - | 57 |
| Band A APT | 83 | 11 | 40 | - | - | - | - | - | - | 41 |
| RIM | 52 | 10 | 25 | - | - | - | - | - | - | 60 |
| HMI | 280 | 7 | 33 | - | - | - | - | - | 2 | 56 |
| Principal Officer | 44 | 11 | 36 | - | - | - | - | - | - | 48 |
| Senior HMI | 72 | - | 32 | - | - | - | - | - | - | 68 |
| SCS | 29 | - | 41 | - | - | - | - | - | - | 55 |
1. Percentages are rounded and may not add to 100.
2. Percentages that round down to zero or are calculated with fewer than 5 individuals are not shown in this table and are instead represented by a dash.
3. Percentages that are less than 1% but represent 5 or more individuals are represented by <1.