Ofsted: gender pay gap report and data 2023
Published 30 November 2023
Applies to England

© Crown copyright 2023
This publication is licensed under the terms of the Open Government Licence v3.0 except where otherwise stated. To view this licence, visit nationalarchives.gov.uk/doc/open-government-licence/version/3 or write to the Information Policy Team, The National Archives, Kew, London TW9 4DU, or email: psi@nationalarchives.gov.uk.
Where we have identified any third party copyright information you will need to obtain permission from the copyright holders concerned.
This publication is available at https://www.gov.uk/government/publications/ofsted-gender-pay-gap-report-and-data-2023/ofsted-gender-pay-gap-report-and-data-2023
Foreword
Ofsted aims to improve lives by raising standards in education and children’s social care. Our work contributes to building a highly educated, productive and safe society in which children and young people can succeed, whatever their background.
As an organisation that holds others to account, it is important that we too are accountable, and are open to challenge and scrutiny. Reporting on the gender pay gap shows how well we achieve equality in our pay structure.
This report provides information on the gender pay gap for the year 2022–23, with data to 31 March 2023 and comparable information for the previous 3 years. The overall picture is of a fair balance of reward between men and women.
We are confident that our policies and initiatives promote equal opportunities for all our workforce and ensure that both sexes can progress in their careers.
I confirm that the data reported here is accurate and has been calculated according to the requirements of the Equality Act 2010.
Amanda Spielman
His Majesty’s Chief Inspector
Introduction
The gender pay gap is the difference in the average earnings between all men and women in an organisation. It is different to equal pay, which is about the difference in actual earnings of men and women doing equal work (or work of equal value).
Since April 2017, employers with 250 or more employees have been required to publish information on their gender pay gap. The pay gap must be reported on in 6 different ways:
- the mean gender pay gap
- the median gender pay gap
- the mean bonus gender pay gap
- the median bonus gender pay gap
- the proportion of men and women who received bonuses
- the proportion of men and women according to quartile pay bands
The mean gender pay gap is the difference between the mean hourly rate of pay of male full-pay relevant employees and that of female full-pay relevant employees.
The median gender pay gap is the difference between the median hourly rate of pay of male full-pay relevant employees and that of female full-pay relevant employees.
Ofsted’s gender profile
The percentage of female staff in Ofsted has increased slightly to 69% (from 68% in 2021–22). This continues to be higher than the Civil Service average of 55%, and the UK average of 51%.
Our spot-rate pay model, where a single salary is set for each grade, supports equal pay for equal work. By not having pay ranges, we avoid the pay inequality that can arise from the ability to negotiate salaries or from linking pay to length of service (see Annex A) for our grading structure.
Ofsted’s gender pay gap
| 2023 | 2022 | 2021 | 2020 | |
|---|---|---|---|---|
| Mean gender pay gap | 5.0% in favour of men | 3.6% in favour of men | 3.6% in favour of men | 4.8% in favour of men |
| Median gender pay gap | 0% favouring neither men nor women | 1.1% in favour of women | 8.0% in favour of women | 6.2% in favour of women |
| Proportion receiving bonus | Men 74% Women 74% |
Men 97% Women 98% |
Men 93% Women 91% |
Men 78% Women 80% |
| Mean bonus gender pay gap | 7.5% in favour of men (an average of £16.30) | 7.5% in favour of men (an average of £47) | 2.1% in favour of men (an average of £13.50) | 14.2% in favour of men (an average of £128) |
| Median bonus gender pay gap | 0% favouring neither men nor women | 9.3% in favour of men (an average of £50) | 0% favouring neither men nor women | 14.3% in favour of men (an average of £100) |
Chart of proportions of men and women in each pay quartile 2020–23, as at 31 March 2023
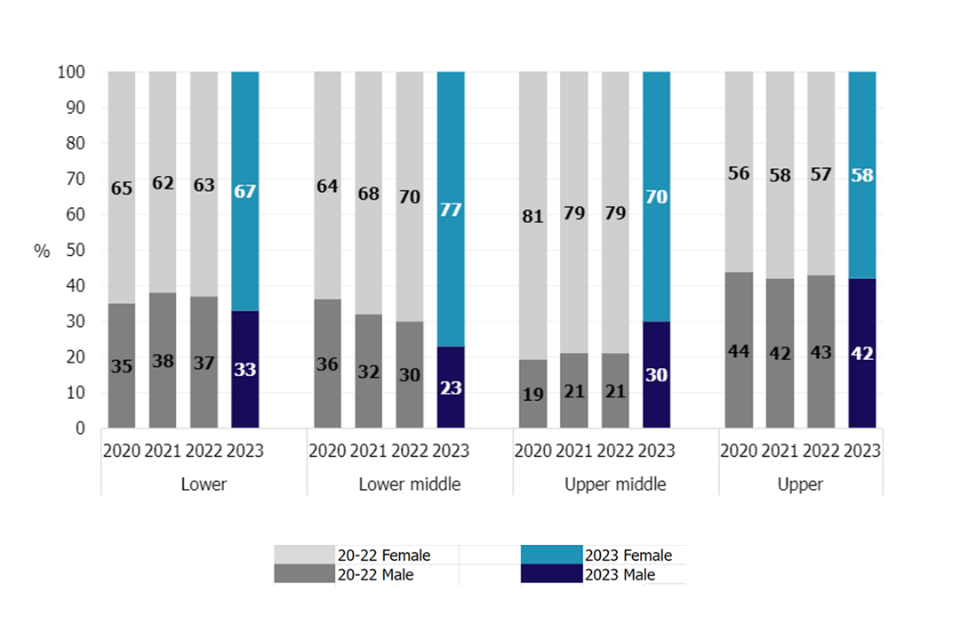
View the data in an accessible table format.
Analysis of gender pay gap data
This year, Ofsted’s mean gender pay gap has increased to 5.0% favouring men whereas our median pay gap has moved to 0% favouring neither men nor women. The mean gender pay gap across the Civil Service in 2023 was 8.1% and the median pay gap was 9.6%.
Both our mean and median gender pay gap is lower than the wider Civil Service. The majority of actual pay differences between men and women at different grades is less than £1 per hour. From our analysis, we believe that the difference is due to the mean bonus gap, which shows that men received slightly increased reward compared with women in March (when gender pay gap figures are drawn). This variation in reward has had an impact on our overall mean gender pay gap, which is otherwise low due to our spot-rate salary model.
Our median gender pay gap is currently 0%. This is because in 2023 both the middle points of our male and female populations were B1 inspectors, and as we operate a spot-rate salary model they are paid the same salary. This figure is affected by our B1 inspector population and tends to vary year on year depending on any changes to this group.
Our mean bonus gender pay gap has remained the same at 7.5%. We have no median bonus gender pay gap. Although proportionately the same percentage of men and women receive awards, the mean indicates that on average, men receive £16.30 more. This has led to the mean bonus gap. On further investigation, we found that men were marginally more likely to receive a bonus through our in-year reward schemes. However, when broken down by grade, women were more likely to receive bonuses than men in 7 out of the 11 non-Senior Civil Service (SCS) grades. This is likely to be driving the median bonus findings. As found in our previous report, there was a wide variation in how reward is used across our different business areas.
Actions to address the gender pay gap – 2022–23
Last year, we took the following actions to address our gender pay gap:
- seeking staff views when developing HR policy documents; this has helped improve the format and usability of policy documents for different groups of colleagues
- ensuring that our recruitment advertising material uses diverse images, including by gender
-
continuing to use blind sifting for our recruitment campaigns and encouraging interview panels to have a gender mix
- monitoring and analysing the use of our in-year reward schemes and sharing transparency dashboards as appropriate
- taking data around the gender pay gap into account in developing proposals for the 2022 pay award; this includes using gender pay analysis in our pay negotiations and committees
Actions to address the gender pay gap – 2023–24
We are committed to taking the following actions in 2023–24:
- continuing to monitor and analyse the use of in-year reward schemes and discuss these at executive board; any agreed actions will be taken forward with business areas
- continuing to take account of data around the gender pay gap in future pay negotiations and awards
Annex A: Ofsted’s grading structures
Administrative, professional and technical (APT) grading structure
| Senior Civil Service (SCS) grade equivalent | Grade |
|---|---|
| SCS | SCS |
| Civil Service grade equivalent | Grade |
|---|---|
| Grade 6 | Principal Officer |
| Grade 7 | Band A |
| Senior Executive Officer (SEO) | B1 |
| Higher Executive Officer (HEO) | B2 |
| Executive Officer (EO) | B3 |
| Administrative Officer (AO) | C1 |
Inspector grading structure
| Civil Service grade equivalent | Grade |
|---|---|
| Grade 6 | Senior His Majesty’s Inspector (HMI) |
| Grade 6 | Specialist Adviser |
| Grade 7 | HMI |
| Grade 7 | Regulatory Inspection Manager |
| SEO | B1 Inspector |
Annex B: data table for the charts
| Pay quartile lower – male | Pay quartile lower – female | |
|---|---|---|
| 2020 | 35 | 65 |
| 2021 | 38 | 62 |
| 2022 | 37 | 63 |
| 2023 | 33 | 67 |
| Pay quartile lower middle – male | Pay quartile lower middle – female | |
|---|---|---|
| 2020 | 36 | 64 |
| 2021 | 32 | 68 |
| 2022 | 30 | 70 |
| 2023 | 23 | 77 |
| Pay quartile upper middle – male | Pay quartile upper middle – female | |
|---|---|---|
| 2020 | 19 | 81 |
| 2021 | 21 | 79 |
| 2022 | 21 | 79 |
| 2023 | 30 | 70 |
| Pay quartile upper – male | Pay quartile upper – female | |
|---|---|---|
| 2020 | 44 | 56 |
| 2021 | 42 | 58 |
| 2022 | 43 | 57 |
| 2023 | 42 | 58 |
See the chart.