Main findings: non-association independent schools inspections and outcomes in England
Updated 28 January 2021
Applies to England

© Crown copyright 2021
This publication is licensed under the terms of the Open Government Licence v3.0 except where otherwise stated. To view this licence, visit nationalarchives.gov.uk/doc/open-government-licence/version/3 or write to the Information Policy Team, The National Archives, Kew, London TW9 4DU, or email: psi@nationalarchives.gov.uk.
Where we have identified any third party copyright information you will need to obtain permission from the copyright holders concerned.
This publication is available at https://www.gov.uk/government/statistics/non-association-independent-schools-inspections-and-outcomes-in-england-august-2020/main-findings-non-association-independent-schools-inspections-and-outcomes-in-england
This is the main findings report for the Non-association independent schools inspections and outcomes in England as at 31 August 2020 release. The following are also available:
- underlying data and tables
- methodology
- pre-release access list
Summary
This release contains:
- the most recent inspections and outcomes as at 31 August 2020
- provisional data for inspections completed between 1 September 2019 and 31 August 2020
- revised data for inspections completed between 1 September 2018 and 31 August 2019
Ofsted carried out inspections from 1 September 2019 under the education inspection framework (EIF). This replaced the common inspection framework, which was in effect from 1 September 2015 to 31 August 2019. This is the first official statistics release relating to inspections of non-association independent schools under the EIF.
Impact of COVID-19 (coronavirus) on this release
All routine inspections and the publication of inspection reports were suspended in March 2020 due to COVID-19. As a result, there have been fewer independent school standard inspections in this academic year (254) compared with the last 3 years when there were, on average, 460 inspections.
The inspection outcomes of independent schools have improved slightly, with 77% of inspected schools judged good or outstanding at 31 August 2020 compared with 75% at the same point in 2019.
We carried out 97 progress monitoring inspections in 2019/20, at which 57% failed to meet all the standards checked.
The most recent inspection outcomes for non-association independent faith schools continue to have weaker outcomes compared with non-faith schools.
Since EIF inspections were introduced in September 2019, we have inspected just under a quarter of open non-association independent schools, of which 63% have been judged good or outstanding.
Introduction
There are around 2,350 independent schools in England. Of these, Ofsted inspects the non-association schools and the Independent Schools Inspectorate (ISI) inspects the schools that are members of an association.
Nearly 1,100 non-association schools are inspected by us, which fall into 2 categories: independent special schools (47%) and other independent schools (53%).
Inspection outcomes profile as at 31 August 2020
77%
of inspected non-association independent schools are good or outstanding
By 31 August 2020, 1,022 non-association independent schools had received a standard inspection. The remaining schools have either recently opened or have moved from another inspectorate to Ofsted and are awaiting their first standard inspection.
The outcomes for non-association independent schools have improved slightly, with 77% judged good or outstanding at their most recent standard inspection compared with 75% as at 31 August 2019. Thirteen per cent of schools are judged requires improvement and 10% inadequate.
Independent special schools
Independent special schools continue to have stronger inspection outcomes than other independent schools (see figure 1). We judged 83% of independent special schools good or outstanding compared with 71% of other independent schools. However, the gap between other independent schools and special schools has narrowed since 31 August 2019, when 83% of independent special schools and 67% of other independent schools were judged good or outstanding. The gap has continued to narrow since it was at its widest on 31 August 2017 (18 percentage point difference).
Figure 1: Overall effectiveness of non-association independent schools at their most recent inspection, as at 31 August 2020
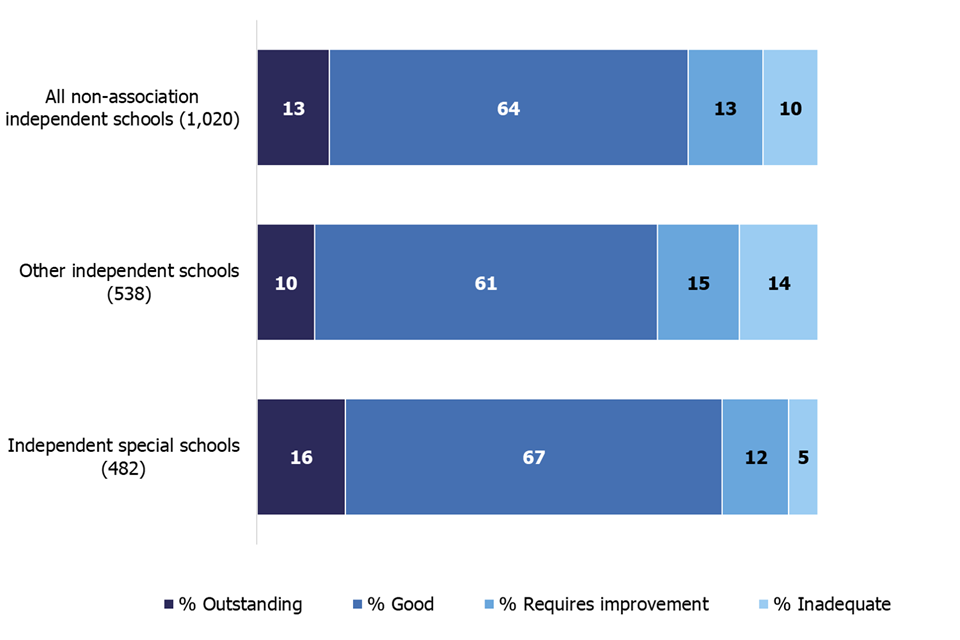
1. Percentages are rounded and may not add to 100.
2. Total number of schools with an overall effectiveness outcome is shown in brackets.
3. There are 2 schools that had a standard inspection and did not receive an overall effectiveness judgement.
Download a zip file with the underlying data in csv format.
Regions
Across the 9 regions, the number of non-association independent schools varies greatly. This ranges from 248 schools in London to 32 in the North East.
Figure 2: Overall effectiveness of non-association independent schools at their most recent inspection by region, as at 31 August 2020
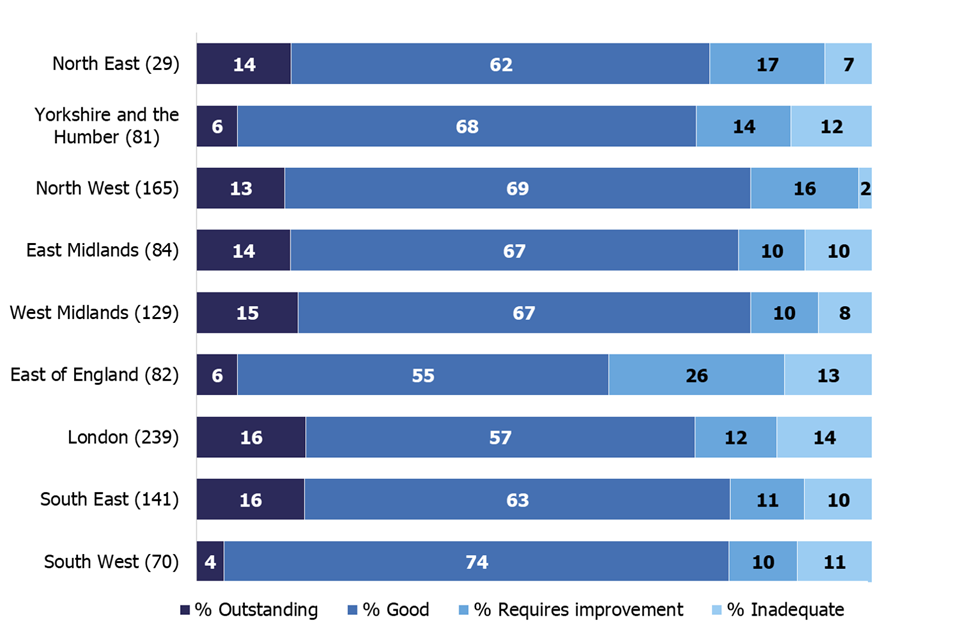
1. Percentages are rounded and may not add to 100.
2. Total number of schools with an overall effectiveness outcome is shown in brackets.
3. There are 2 schools in the South East that had a standard inspection and did not receive an overall effectiveness judgement.
4. Some percentages are based on small numbers and should be treated with caution.
Download a zip file with the underlying data in csv format.
The regions with the highest proportion of schools judged good or outstanding were the North West and West Midlands (82%). The East of England had the lowest at 61%, this is a drop of 5 percentage points from 31 August 2019.
London and the East of England have the highest proportions of inadequate schools, 14% and 13% respectively. However, the regional results are quite variable from year to year. For example, in August 2019, the West Midlands had one of the highest proportions of inadequate schools (14%), but, in August 2020, this had fallen to 8%.
Independent faith schools
As at 31 August 2020, we have inspected 289 independent faith schools[footnote 1] and 733 independent non-faith schools.
Muslim schools account for 46% of faith schools in this remit, followed by Christian schools (30%) and Jewish schools (23%). The number of pupils taught in Jewish schools though tends to be larger than in other faith schools. This means that the number of pupils attending Jewish schools (16,600) is approximately 3 times those attending Christian schools (5,370).
The inspection outcomes for non-association independent faith schools are weaker than the outcomes for non-faith schools. At their most recent standard inspection at 31 August 2020, the percentage of faith schools judged good or outstanding was 65% compared with 81% for non-faith schools (see figure 3).
Also, 18% of non-association independent faith schools are judged inadequate compared to just 6% of non-faith schools.
Inspection outcomes vary across faith groups. Christian schools have better outcomes – 82% are judged good or outstanding compared to 67% of Muslim schools and only 38% of Jewish schools. This is the same trend that we have seen in previous years.
Figure 3: Overall effectiveness of non-association independent schools at their most recent inspection by faith, as at 31 August 2020
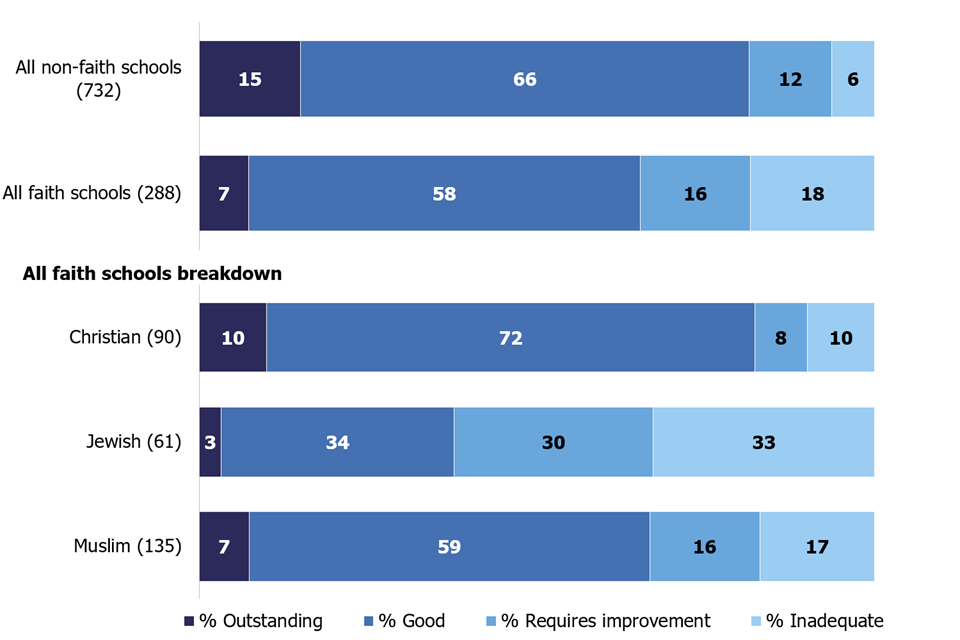
1. Percentages are rounded and may not add to 100.
2. Total number of schools with an overall effectiveness outcome is shown in brackets.
3. There are 2 schools that had a standard inspection and did not receive an overall effectiveness judgement.
4. There are 2 schools classed as ‘Other faith’. They are not shown on the breakdown but are included in the ‘All faith schools’ total.
5. Some percentages are based on small numbers and should be treated with caution.
Download a zip file with the underlying data in csv format.
Safeguarding
Effective safeguarding is critical for a school’s overall effectiveness judgement. The proportion of schools with effective safeguarding is now at its highest since it was introduced with the common inspection framework in September 2015. At 31 August 2020, 93% of schools had effective safeguarding at their most recent standard inspection compared with 92% on 31 August 2019 and 86% on 31 August 2016.
A higher proportion of independent special schools have effective safeguarding (96%) compared with other independent schools (91%). Faith schools fare particularly poorly compared with non-faith schools, with 12% of faith schools judged to have ineffective safeguarding compared with 5% of non-faith schools. All schools with ineffective safeguarding were judged as inadequate overall.
Independent school standards

Non-association independent schools are expected to comply with the 8 parts of the government’s independent school standards (ISS). At their most recent inspection, at 31 August 2020, 17% of schools did not meet all the ISS, compared with 18% at the same point in the previous year.
If a school fails to meet any of the ISS, it cannot meet standards relating to the quality of leadership in and management of schools. As a result, those standards relating to quality of leadership in and management of schools have a high level of non-compliance (17%). The standards relating to the quality of education provided have the next highest level of non-compliance (13%) followed by the welfare, health and safety of pupils (10%).
We continue to monitor schools that did not meet all standards at their most recent inspection. These additional inspections are called progress monitoring inspections. We carried out 97 progress monitoring inspections in 2019/20, at which 57% failed to meet all the standards checked. This is a similar proportion to previous years.
EIF inspection outcomes (1 September 2019 to 31 August 2020)
Since the introduction of the EIF on 1 September 2019, there have been 254 standard inspections of non-association independent schools carried out (just under a quarter of open independent schools). All routine inspections were suspended in March 2020 due to the COVID-19 pandemic. Of the schools inspected in 2019/20, 9% of schools were judged outstanding, 54% good, 21% requires improvement and 17% inadequate. The proportion of schools judged good or outstanding (63%) is slightly lower than in the previous 2 academic years (65% in both 2017/18 and 2018/19).
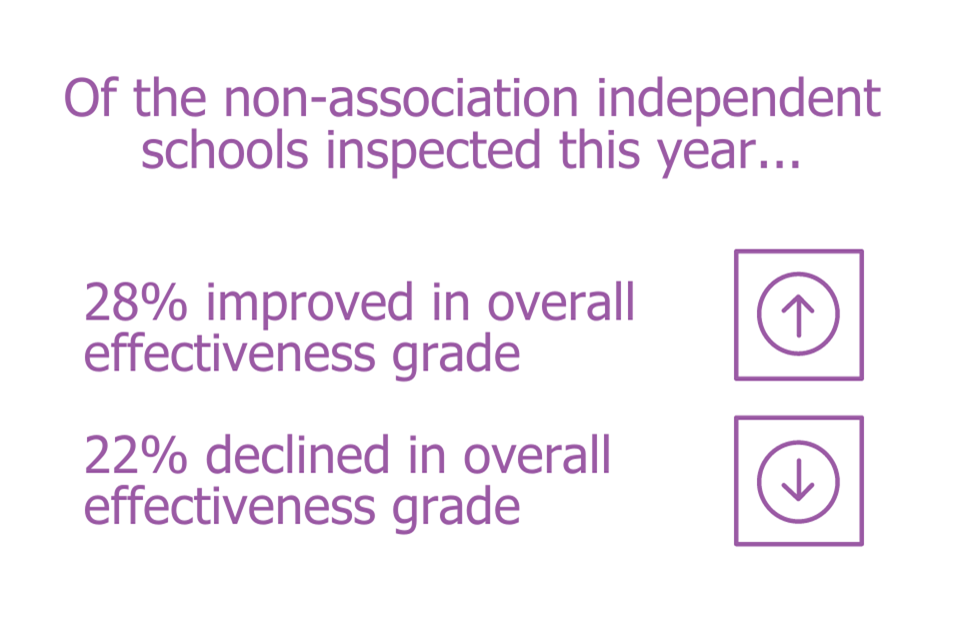
Of the schools inspected this year, 201 had a previous overall effectiveness judgement. Of these 201, almost half retained their overall effectiveness judgement, while 28% improved their overall effectiveness grade from their previous inspection and 22% declined.
Over half of the schools that were previously judged requires improvement or inadequate improved to good or outstanding under the EIF. In contrast, a quarter of schools previously judged good or outstanding declined to less than good.
It is important to note that independent schools are inspected on a 3-year cycle. Weaker schools tend to be inspected earlier because we normally inspect schools that are judged requires improvement or inadequate within 2 years. The group of schools for which we are responsible for inspecting has also changed year to year. This means that inspection outcomes in any given year may not be representative of all non-association independent schools.
The effectiveness of leadership and management had the same proportion of schools judged good or outstanding as overall effectiveness (63%). In 2018/19, under the previous framework, effectiveness of leadership and management was slightly stronger with 66% of schools judged good or outstanding. Of the new judgements, behaviour and attitudes and personal development had the highest proportion of schools judged good or outstanding, 86% and 81% respectively. This is compared with 78% in personal development, behaviour and welfare in 2018/19. Quality of education was slightly higher than overall effectiveness with 66% of schools judged good or outstanding.
We judged 42 of the 254 inspections as inadequate. In addition, a majority (69%) of these also had ineffective safeguarding.
Figure 4: Overall effectiveness of non-association independent schools inspected in each academic year, since 1 September 2015

Total number of inspections is shown in brackets.
Download a zip file with the underlying data in csv format.
Revisions
Provisional data indicated that, between 1 September 2018 and 31 August 2019, 452 standard inspections were carried out. This data includes inspection reports that were published by 30 September 2019. Based on published reports by 30 September 2020, there was an additional inspection, bringing the total number of standard inspections carried out to 453.
The addition of this extra inspection did not change the profile of overall effectiveness for schools inspected in the last academic year.
Revisions have been published to data in this publication in line with Ofsted’s revisions policy for official statistics.
Notes
Data in this report is from inspections as at 31 August 2020, if the report was published by 30 September 2020. If the inspection report was not published by 30 September 2020, then the report on the previous inspection, if available, is used as the school’s most recent inspection. Any data, charts and tables referring to in-year outcomes are based on inspections from 1 September 2019 to 31 August 2020 and published by 30 September 2020.
From September 2015, data in this official statistics release reflects judgements made on inspections carried out under sections 99, and 109(1) and 109(2) of the Education and Skills Act 2008. The regulations set out the standards on which inspectors report on. This includes the extent to which the school meets the requirements of the Education (Independent School Standards) Regulations 2014 (referred to as the independent school standards).
The accompanying methodology and quality report for this release sets out the main uses of this data, further contextual information and arrangements for quality assurance. It also provides information about strengths and limitations of the statistics.
Glossary
Definitions of terms are in our glossary.
Further information
Contact for comments or feedback
If you have any comments or feedback on this publication, please contact Anita Patel on 03000 130 914 or Anita.Patel@ofsted.gov.uk.
Annual report
We will publish findings from our forthcoming Annual Report on 1 December 2020.
Acknowledgements
Thanks to the following for their contribution to this statistical release: Alison Bateman, Tim Milstead, Helen Woodley, Richard Smith and Jay Kerai.
-
A school is defined as a faith school based on whether they have declared either a religious character, a religious ethos, or both. The school updates this information directly on Get Information About Schools (GIAS). ↩