Main findings: non-association independent schools inspections and outcomes in England
Updated 20 November 2020
Applies to England

© Crown copyright 2020
This publication is licensed under the terms of the Open Government Licence v3.0 except where otherwise stated. To view this licence, visit nationalarchives.gov.uk/doc/open-government-licence/version/3 or write to the Information Policy Team, The National Archives, Kew, London TW9 4DU, or email: psi@nationalarchives.gov.uk.
Where we have identified any third party copyright information you will need to obtain permission from the copyright holders concerned.
This publication is available at https://www.gov.uk/government/statistics/non-association-independent-schools-inspections-and-outcomes-in-england-august-2019/non-association-independent-schools-inspections-and-outcomes-in-england-main-findings
The Non-association independent schools inspections and outcomes in England release also includes:
- data tables
- methodology
- pre-release access list
Summary
This release contains:
- the most recent inspections and outcomes as at 31 August 2019
- provisional data for inspections completed between 1 September 2018 and 31 August 2019
- revised data for inspections completed between 1 September 2017 and 31 August 2018
Non-association independent school inspection outcomes have improved.
At the end of August 2019, 75% of schools inspected were judged good or outstanding in their overall effectiveness at their most recent inspection. This is 6 percentage points higher than last year.
Slightly more schools are meeting the independent school standards.
Although the proportion of schools meeting the independent school standards has increased by 5 percentage points, nearly a fifth of schools are still failing to meet them.
The proportion of schools judged inadequate has fallen slightly.
Since August 2017, the proportion of schools judged inadequate has fallen from 14% to 10%.
Inspection outcomes vary across faith and non-faith schools.
The percentage of faith schools judged less than good is almost twice that of non-faith schools. This is similar to last year.
Introduction
There are around 2,350 independent schools in England. Of these, Ofsted inspects the non-association schools and the Independent Schools Inspectorate (ISI) inspects the schools that are members of an association.
There are over 1,100 non-association schools inspected by us, which fall into two categories: independent special schools (45%) and other independent schools (55%).
Inspection outcomes profile as at 31 August 2019

This infographic shows that 75% of non-association independent schools were judged good or outstanding at their most recent inspection.
By the 31 August 2019, 1,037 non-association independent schools had received a standard inspection. The large majority of these schools (75%) were judged either good or outstanding in their overall effectiveness at their most recent standard inspection. This is an increase of 6 percentage points since 31 August 2018. However, there is still room for improvement, with 15% of schools judged as requires improvement and 10% judged as inadequate.
The remaining schools that we have not inspected are new or are those that have moved inspectorate and have yet to receive their first inspection.
Independent special schools

This infographic shows that more independent special schools were judged good or outstanding at their most recent inspection, compared with other types of independent school.
A higher proportion of independent special schools were judged good or outstanding at their most recent inspection compared with other independent schools (83% and 67% respectively). Compared with last year, this is a 5 percentage point and a 6 percentage point increase respectively (Figure 1).
Figure 1: Overall effectiveness of non-association independent schools at their most recent inspection, as at 31 August 2019.

The bar chart shows the overall effectiveness of independent schools at their most recent standard inspection, by school type. Independent special schools have a higher proportion of schools judged outstanding compared with other independent schools.
The proportion of independent schools that were judged to have ineffective safeguarding has reduced by 2 percentage points to 8% since 31 August 2018. Independent special schools are less likely to have ineffective safeguarding than other independent schools (4% and 10% respectively). All schools with ineffective safeguarding were judged as inadequate overall.
Regions
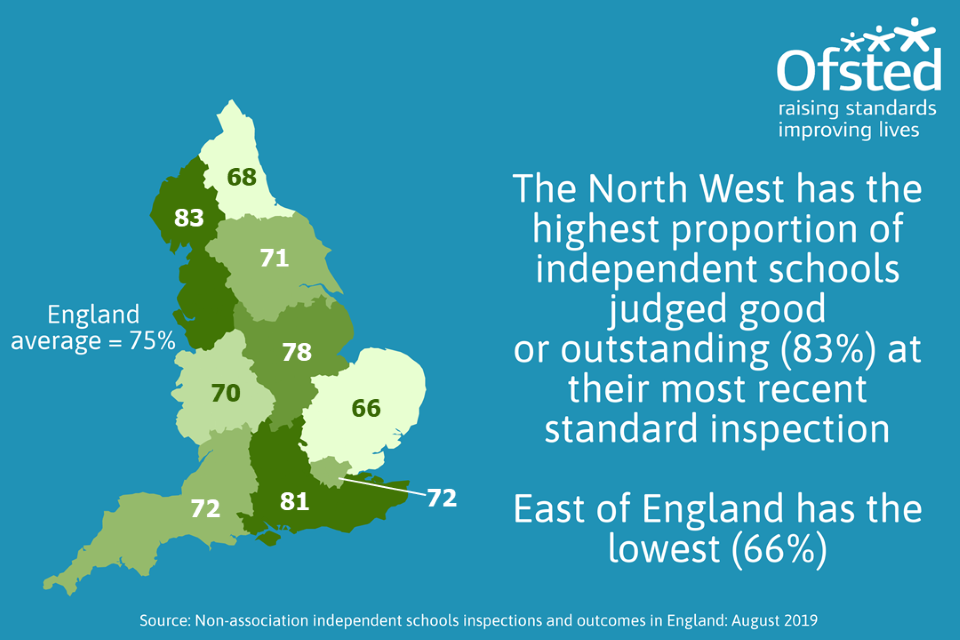
This map shows the proportion of independent schools judged good or outstanding at their most recent inspection, by region. The North West has the highest proportion (83%) and the East of England has the lowest (66%).
Across the 9 regions, the number of non-association independent schools varies greatly. This ranges from 257 schools in London to 31 in the North East.
Of those inspected by 31 August 2019, the region with the highest proportion of schools judged good or outstanding was the North West (83%). The East of England still has the lowest proportion of good or outstanding schools (66%), however, this is 12 percentage points higher than last year (54%).
The West Midlands and Yorkshire and the Humber have the highest proportions of inadequate schools (both 14%). London and the South West had the highest proportion of schools judged inadequate last year (19% and 20% respectively). By the end of August 2019, both regions saw this proportion reduce to 13%.
Independent faith schools
As of 31 August 2019, we have inspected 291 independent faith schools and 746 independent non-faith schools.
Muslim schools account for the highest number of faith schools, followed by Christian schools and then Jewish schools. The number of pupils taught in Jewish schools tends to be larger than in other faith schools. This means that the number of pupils attending Jewish schools (15,400) is over double those attending Christian schools (6,610) but still lower than those attending Muslim schools (19,000).
Unlike in state schools, the inspection outcomes for non-association independent faith schools are weaker than the outcomes for non-faith schools. At their most recent standard inspection, the percentage of faith schools judged less than good fell by 7 percentage points compared with 46% last year. However, this still remains almost twice that of non-faith schools (20%). The difference between faith and non-faith schools is almost 3 times when comparing only inadequate outcomes (20% and 7%, respectively).
A school is defined as a faith school based on whether they have declared either a religious character, a religious ethos, or both. The school updates this information directly on Get Information About Schools (GIAS).
Inspection outcomes vary across faith groups. Christian schools perform more strongly than the other faith groups (Figure 2).
Figure 2: Most recent overall effectiveness of non-association independent schools, by faith, as at 31 August 2019
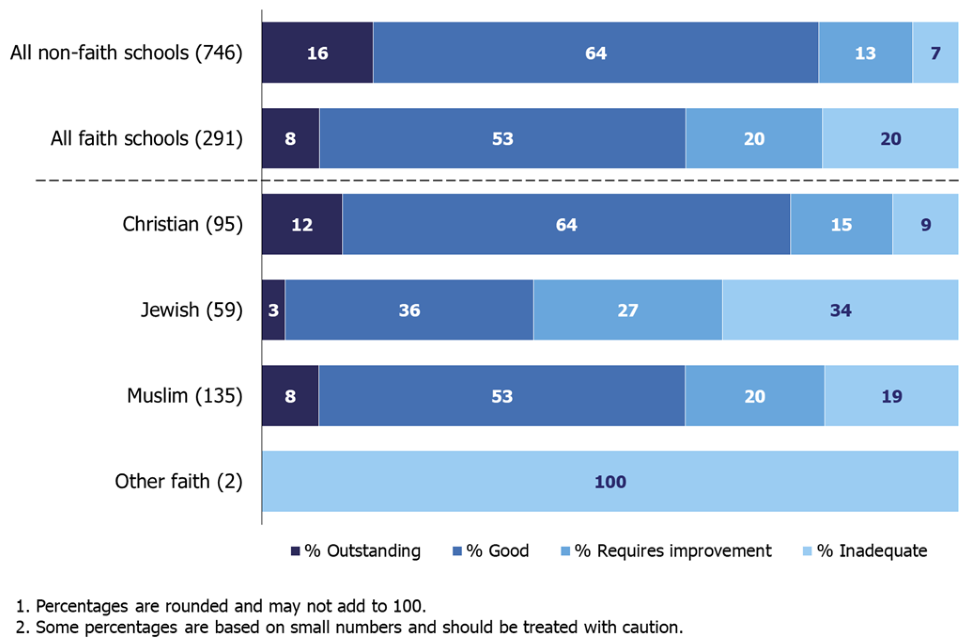
This horizontal bar chart shows the overall effectiveness judgements of non-association independent schools at their most recent standard inspection, by faith group. Faith schools were twice as likely as non-faith schools to be judged less than good.
Inspections for 2018 to 2019
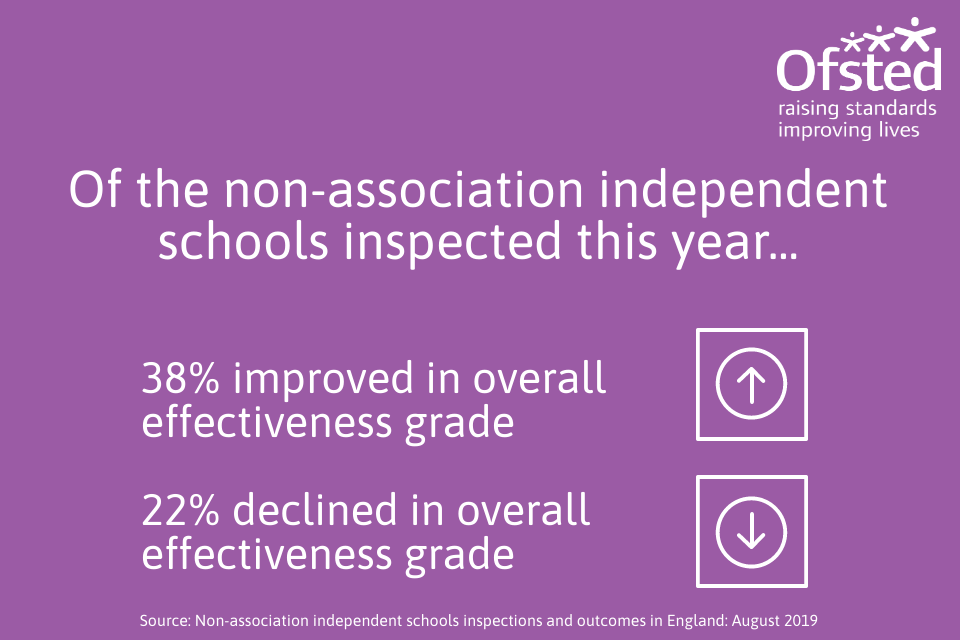
This infographic shows that of the non-association independent schools inspected this year, 22% improved in their overall effectiveness grade and 38% declined in their overall effectiveness grade.
Between 1 September 2018 and 31 August 2019, we inspected 452 schools and 352 of these had a previous overall effectiveness judgement (we have excluded schools that closed or changed inspectorate in the 2018 to 2019 academic year). Of the 352, 38% had improved from the overall effectiveness grade that they had received at their previous standard inspection, 22% declined and 40% remained at the same grade.
We judged 73 of these 452 schools as inadequate (Figure 3). In addition, a large majority of these also had ineffective safeguarding.
It is important to note that we inspect independent schools on a 3-year cycle. We tend to inspect weaker schools earlier than stronger schools. We inspect schools that are judged as requires improvement or inadequate again within 2 years. The group of schools for which we are responsible for inspecting has also changed year to year. This means that inspection outcomes in any given year may not be representative of all non-association independent schools.
Figure 3: Overall effectiveness of non-association independent schools inspected in each academic year, since 1 September 2012
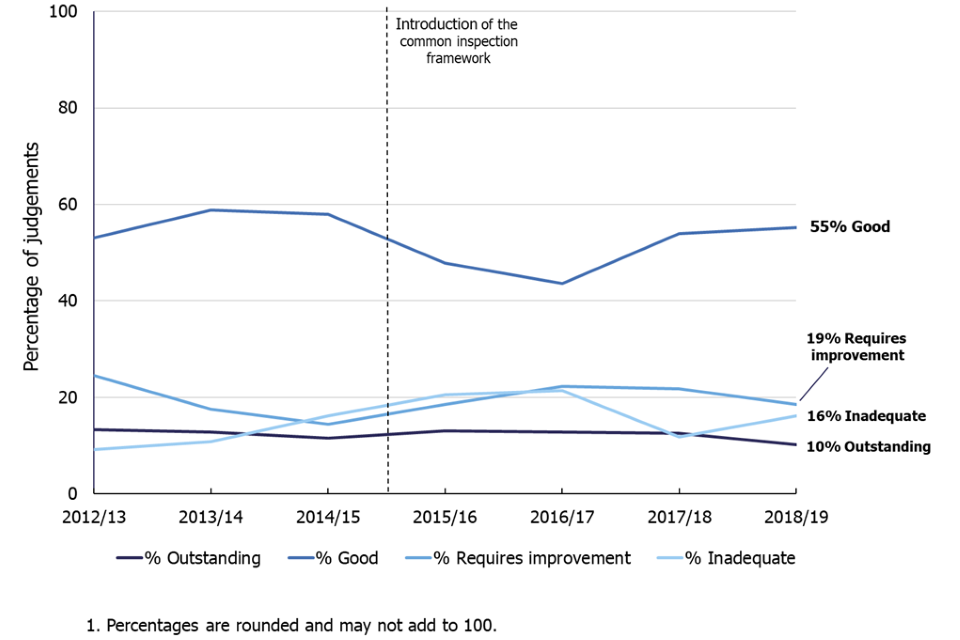
This line chart shows the proportion of non-association independent schools judged outstanding, good, requires improvement and inadequate in each academic year, since 1 September 2012. The common inspection Framework was introduced in September 2015.
Compliance with independent school standards

This infographic shows that nearly a fifth of non-association independent schools failed to comply with all of the independent school standards at their most recent standard inspection.
In addition to being judged on their overall effectiveness at inspection, we expect non-association independent schools to comply with the 8 parts of the independent school standards. Based on their most recent standard inspection, 82% of schools met all the standards.
We continue to monitor schools that did not meet all standards at their most recent inspection. We call these additional inspections ‘progress monitoring inspections’. This academic year, we carried out 137 progress monitoring inspections. Of those inspected, only 61 schools (45%) met the standards. This is similar to last year.
Revisions
Provisional data indicated that between 1 September 2017 and 31 August 2018, we carried out 553 standard inspections (this data includes inspection reports that we published by 30 September 2018). Revised data, if we published the report by 30 September 2019, shows that there were an additional 17 inspections, bringing the total number of standard inspections carried out to 570. Of the 17 additional inspections, 1 was judged as good, 3 were judged as requires improvement and 13 were judged as inadequate.
The addition of these inspections changed the profile of overall effectiveness for schools inspected in the last academic year. The proportion of schools judged outstanding fell from 13% to 12% and the proportion of schools judged good fell from 54% to 52%. However, the proportion of schools judged inadequate increased from 12% to 14%. You can find further details in the revised tables in the charts and tables file accompanying this release.
We have published revisions to data in this publication in line with Ofsted’s revisions policy for official statistics.
Notes
Data in this release is from inspections carried out between 1 September 2018 and 31 August 2019 and most recent inspections of open schools at 31 August 2019, if we published the inspection report by 30 September 2019. If we did not publish an inspection report by 30 September 2019 then we will report on the previous inspection, if available, as the school’s most recent inspection.
From September 2015, data in this official statistics release reflects judgements made on inspections carried out under sections 99, and 109(1) and (2) of the Education and Skills Act 2008. The regulations set out the standards on which inspectors report, including the extent to which a school meets the requirements of the Education (Independent School Standards) Regulations 2014 (referred to as the independent school standards).
The accompanying methodology and quality report for this release sets out the main uses of this data, further contextual information and arrangements for quality assurance. It also provides information about strengths and limitations of the statistics.
In 2016, the National Statistician published guidance covering management information and official statistics.
Further information
Contact for comments or feedback
If you have any comments or feedback on this publication, please contact Anita Patel on 03000 130 914 or Anita.Patel@ofsted.gov.uk.
Annual report
Findings from our forthcoming Annual Report will be published on 21 January 2020.
Acknowledgements
Thanks to the following for their contribution to this statistical release: Katherine Worley, Kyle Shackleton, Vanessa Fearn, Talan George and James Jordan.