Non-association independent schools inspection and outcomes as at 31 August 2016
Updated 18 December 2019

© Crown copyright 2019
This publication is licensed under the terms of the Open Government Licence v3.0 except where otherwise stated. To view this licence, visit nationalarchives.gov.uk/doc/open-government-licence/version/3 or write to the Information Policy Team, The National Archives, Kew, London TW9 4DU, or email: psi@nationalarchives.gov.uk.
Where we have identified any third party copyright information you will need to obtain permission from the copyright holders concerned.
This publication is available at https://www.gov.uk/government/statistics/non-association-independent-schools-inspection-outcomes-official-statistics-as-at-31-august-2016/non-association-independent-schools-inspection-and-outcomes-as-at-31-august-2016
This release contains:
- provisional data for inspections completed between 1 September 2015 and 31 August 2016
- most recent inspection outcomes as at 31 August 2016
- revised data for inspections completed between 1 September 2014 and 31 August 2015
Non-association independent schools’ inspection outcomes have declined
At the end of August 2016, 72% of schools inspected by Ofsted were judged good or outstanding at their most recent inspection. This is three percentage points lower than the proportion judged good or outstanding as at 31 August 2015.
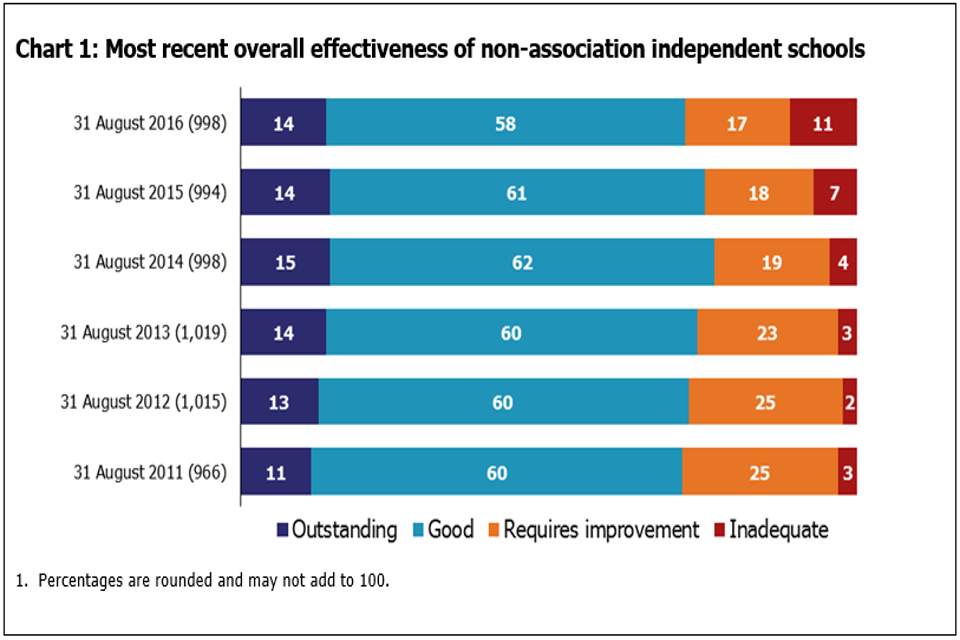
chart 1
The number of schools judged inadequate has continued to increase
At the end of August 2016, 108 schools (11%) were judged inadequate at their most recent inspection. This is four percentage points higher than the number reported in the previous year. Over one in five schools inspected this year were judged inadequate.
North East, Yorkshire and the Humber has the highest proportion of good and outstanding schools. West Midlands has the lowest
North East, Yorkshire and the Humber has 79% of schools judged good or outstanding at their most recent inspection. The West Midlands has the lowest proportion of schools judged good or outstanding at 63%.
1. Schools at their most recent inspection
As at 31 August 2016 there were 1,070 open non-association independent schools, 998 of which had been inspected.[footnote 1] Of these, 72% were judged good or outstanding, 17% required improvement and 11% were inadequate at their most recent inspection. The proportion judged good or outstanding is four percentage points lower than as at 31 August 2015.
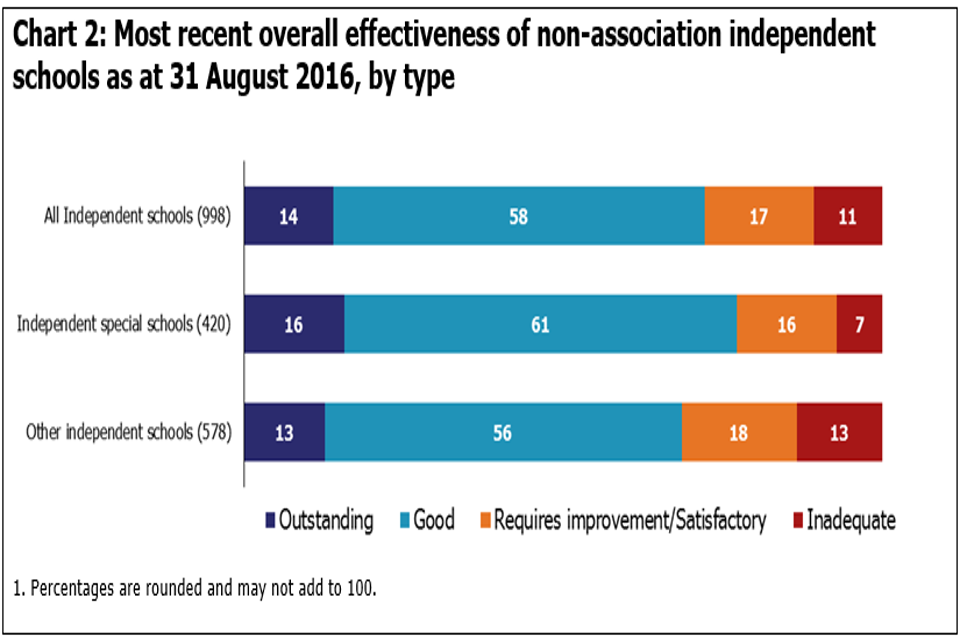
chart 2
At the end of August 2016, 108 schools (11%) were judged to be inadequate at their most recent inspection. This continues the decline in inspection outcomes since 2014, where 43 schools (4%) were inadequate. This reflects higher expectations of the new independent school standards, introduced by the Department for Education in September 2014 and supplemented in January 2015.
Independent special schools are performing more strongly than their other independent school counterparts, with 77% judged good or outstanding. Other independent schools have a higher proportion found inadequate (13%) compared to independent special schools (7%).
2. Regional outcomes from inspection
The number of independent schools varies considerably between regions, from London (286), which has the highest number, to the South West (76) which has the lowest. A large proportion are in London and the South East (41%).
Chart 3 shows that, of those inspected, the North East, Yorkshire and the Humber has the highest proportion of schools judged good or outstanding (79%). London and the North West have the highest proportion of schools with an outstanding overall effectiveness judgement (18%).
The West Midlands had the lowest proportion of schools judged good or outstanding (63%).
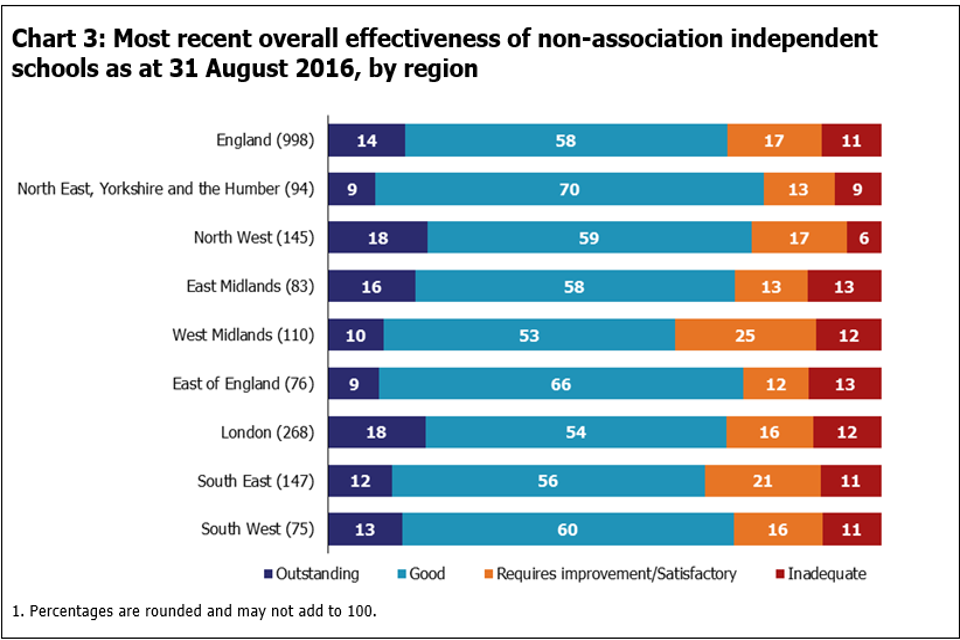
chart 3
3. Inspections between 1 September 2015 and 31 August 2016
From September 2015, independent schools are now inspected under the common inspection framework, which holds them to account in similar ways to maintained schools and academies for the quality of their work.
Between 1 September 2015 and 31 August 2016, Ofsted carried out 248 standard inspections. Twenty-one per cent of these were judged to be inadequate (see chart 4).
During 2015/16, 107 progress monitoring inspections were conducted, of schools previously judged not to have met all of the independent school standards. Of these, only half have now improved to meet the standards checked on these inspections.
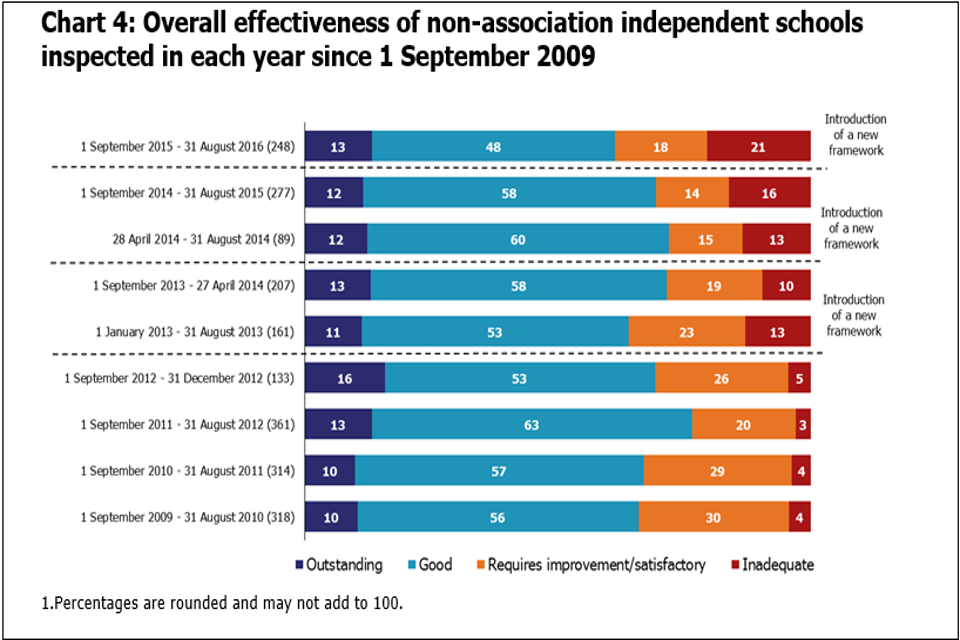
chart 4
4. Compliance with independent school standards
Compliance with regulatory standards is not reported in this release.
In 2015 Ofsted introduced a new administrative system to manage and store inspection data. There were issues with the quality of data recorded on this new system, meaning data for compliance with regulatory standards is not always consistent with the published inspection report. Therefore, compliance outcomes data for this period are not included in this release.
However, compliance with regulatory standards recorded in published inspection reports remains accurate. Users can consult inspection reports should they wish to obtain these outcomes.
5. Revisions to previous release
Provisional data indicated that there were 280 inspections between 1 September 2014 and 31 August 2015, published by 30 September 2015. Revised data shows that an additional inspection took place in this period, which resulted in a good judgement.
The addition of this inspection outcome has not changed the overall grade profile for overall effectiveness in 2014/15. Further details can be found in the revised tables in the charts and tables file.
6. Notes
Data in this release is from inspections undertaken between 1 September 2015 and 31 August 2016 and most recent inspections of open schools at 31 August 2016, where the inspection report was published by 30 September 2016. If an inspection report is not published by 30 September 2016 then the previous inspection, where available, will be reported as a school’s most recent inspection.
From September 2015, data in this official statistics release reflects judgements made on inspection conducted under sections 99, and 109(1) and (2) of the Education and Skills Act 2008.[footnote 2] The regulations set out the standards on which inspectors report. This includes the extent to which the school meets the requirements of the Education (Independent School Standards) Regulations 2014 (referred to as the independent school standards). An explanation of the key uses of this data and further contextual information and the arrangements for quality assurance is provided in the accompanying methodology and quality report.
The methodology and quality report for these official statistics can be found at the following webpage: https://www.gov.uk/government/collections/independent-schools-inspections-and-outcomes under the heading ‘documents’. This report also provides information about strengths and limitations of the statistics.
In 2016, the National Statistician published new guidance covering management information and official statistics. This guidance can be accessed here: www.statisticsauthority.gov.uk/wp-content/uploads/2016/06/National-Statisticians-Guidance-Management-Information-and-Official-Statistics.pdf
If you have any comments or feedback on this publication, please contact Louise Butler on 03000 131 457 or Louise.Butler@ofsted.gov.uk
-
Not all open schools have received a standard inspection. Once registered, new schools receive their first standard inspection in their first year of operation, at the request of the Department for Education (DfE). ↩
-
Education and Skills Act 2008; www.legislation.gov.uk/ukpga/2008/25/contents ↩