3. How much additional water we need: National Framework for Water Resources 2025
Updated 15 April 2026
Applies to England and Wales

© Crown copyright 2026
This publication is licensed under the terms of the Open Government Licence v3.0 except where otherwise stated. To view this licence, visit nationalarchives.gov.uk/doc/open-government-licence/version/3 or write to the Information Policy Team, The National Archives, Kew, London TW9 4DU, or email: psi@nationalarchives.gov.uk.
Where we have identified any third party copyright information you will need to obtain permission from the copyright holders concerned.
This publication is available at https://www.gov.uk/government/publications/national-framework-for-water-resources-2025-water-for-growth-nature-and-a-resilient-future/3-how-much-additional-water-we-need-national-framework-for-water-resources-2025
The modelling of scenarios of population growth, climate change and environmental sustainability reductions demonstrates that without action, there could be a public water supply (PWS) deficit of up to 5,000 Ml/d by 2055. Additional pressure will result from other sectors of use, particularly from the energy, food and data centre sectors. Non-PWS sectors alone will account for an additional demand of 1,200 Ml/d by the 2050s.
The National Framework provides a picture of water needs across the country by 2055. Figure 4 shows the forecast water needs for each regional group in England. The estimated additional public water needs are based on the Do Nothing modelled scenario. The Do Nothing scenario assumptions are explained in section 2.2. The forecasts for future non-public water needs are presented as the estimated total demand for 2055, including current demands and are based on an upper estimate scenario that considers recent actual abstraction adjusted for consumptiveness, with relevant sector-based growth factors applied. The forecasts exclude coastal, tidal and estuarine abstractions as well as abstraction related to navigation. The forecasts do not include new or emerging non-PWS demands such as low carbon energy or data centres. The non-PWS forecast approach is explained in further detail in section 3.2.
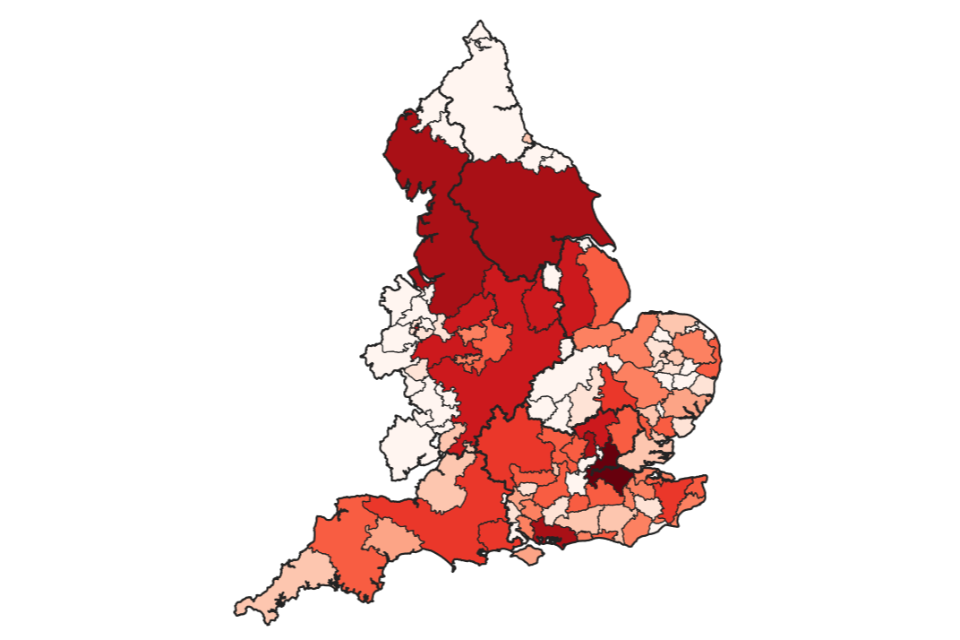
Figure 4: Understanding England’s future water needs by 2055

For PWS, the estimated additional water need between 2030 and 2055 includes the key drivers:
- increasing resilience to a 1 in 500-year drought
- high population growth
- high environmental improvement through delivery of the most ambitious reductions identified in current water company plans
- individual water company analysis of climate change impacts
There are also other factors influencing the water supply by 2055, not captured above, which will result in both increases and decreases in total water availability across each region.
We also show the upper estimate forecast of the proportion of consumptive water used by the different sectors in each region. We have shortened million litres per day to Ml/d.
Water Resources West (WRW)
The map shows the full area of WRW including parts of Wales. The values also include Welsh zones within the boundary, but the headline figures in the Framework do not.
Additional PWS needs between 2030 and 2055 are 1,073 Ml/d including:
- drought resilience: 62 Ml/d
- population change: 232 Ml/d
- environmental improvement: 572 Ml/d
- climate change: 84 Ml/d
Estimated total demand from other users is 429 Ml/d:
- 49% industry (food and drink, metal production, chemicals)
- 27% agriculture (spray irrigation)
- 17% power generation
Water Resources North (WReN)
Additional PWS needs between 2030 and 2055 are 345 Ml/d including:
- drought resilience: 70 Ml/d
- population change: 99 Ml/d
- environmental improvement: 109 Ml/d
- climate change: 60 Ml/d
Estimated total demand from other users is 261 Ml/d:
- 22% industry (food and drink, chemicals, mineral products)
- 17% agriculture (spray irrigation)
- 59% power generation
Water Resources East (WRE)
Additional PWS needs between 2030 and 2055 are 679 Ml/d including:
- drought resilience: 114 Ml/d
- population change: 165 Ml/d
- environmental improvement: 415 Ml/d
- climate change: 26 Ml/d
Estimated total demand from other users is 564 Ml/d:
- 11% industry (food and drink, chemicals, mineral products)
- 47% agriculture (spray irrigation)
- 34% power generation
West Country Water and Environment (WCWE)
Additional PWS needs between 2030 and 2055 are 260 Ml/d including:
- drought resilience: 5 Ml/d
- population change: 85 Ml/d
- environmental improvement: 182 Ml/d
- climate change: 20 Ml/d
Estimated total demand from other users is 216 Ml/d:
- 60% industry (food and drink, chemicals, mineral products)
- 26% agriculture (spray irrigation)
- 1% power generation
Water Resources South East (WRSE)
Additional PWS needs between 2030 and 2055 are 2,034 Ml/d including:
- drought resilience: 377 Ml/d
- population change: 424 Ml/d
- environmental improvement: 1,350 Ml/d
- climate change: 161 Ml/d
Estimated total demand from other users is 150 Ml/d:
- 23% industry (food and drink, chemicals, mineral products)
- 35% agriculture (spray irrigation)
- 31% power generation
3.1 Environmental needs
The quantification of changes to current and future abstraction needed to meet environmental requirements is known as the Environmental Destination for water resources.
The Environmental Destination for water resources identifies where, and by how much, water abstraction needs to change to achieve and maintain a healthy water environment, both now and in the future.
The Environmental Destination defines the long-term environmental outcomes to ensure abstraction from rivers, groundwater, lakes, wetlands and estuaries is environmentally sustainable, both to address current unsustainable abstraction and future pressures. It identifies where and by how much abstraction may need to reduce to meet current and future environmental requirements for nature. It considers both legal requirements and government commitments. It includes known challenges and assessments of the future potential impact of climate change and considers growth.
The detailed technical approach to assessing environmental needs is contained in Appendix C: Environmental Destination technical report. This includes how we use this includes how we use environmental flow targets to identify where changes to abstraction may be required.
The figures presented here are a high-level indication of need. They have been adjusted downwards to reflect the actions already included in the 2024 round of water company water resources management plans. They are based on national data sets and analysis and do not include where there may be additional local environmental requirements. They have not been adjusted to reflect any ‘overriding public interest’ decisions which may be made in the future. The figures may also need to be refined as the growth agenda is reflected in Regional Water Resources Plans.
They allow for better evidence to be used to refine the assessments locally and are the starting point for regional water resources groups to take the national figures and to refine them as they develop regional plans. We will provide supplementary technical guidance to advise regional groups on how to include Environmental Destination needs within their plans. Where water companies have sources within or affecting Wales (to supply England), Natural Resources Wales provides guidance on how to meet Welsh legislation Environmental Destination requirements.
Figure 5: Environmental requirements at a water body level
These maps show river waterbodies where abstraction may need to be reduced to meet environment needs at a Q95 low flow. Three maps show the potential abstraction reduction that may be needed now and by the 2050s.
Map 1: Current situation: potential abstraction reduction by waterbody in today’s climate

Map 1 shows potential abstraction reductions against today’s baseline environmental requirements. The baseline shows that there is a potential need to reduce fully licensed abstraction by up to 3,200 Ml/d to address current unsustainable abstraction. Of the total estimated abstraction reductions required to meet environmental requirements, approximately 60% is to address current unsustainable abstraction, and of this, water company abstraction accounts for approximately 90% of the reductions needed.
Map 2: Situation with climate change and full environmental expectations: potential abstraction reduction by waterbody in 2050

Map 2 shows how this may change by the 2050s with inclusion of full environmental expectations and with climate change (dry scenario). For this scenario, by the 2050s, this total need could rise to 5,400 Ml/d (full expectations).
Map 3: Situation with climate change, full environmental expectations and after WRMP24 actions delivered: potential abstraction reduction by waterbody in 2050

Map 3 shows the remaining potential abstraction reductions following delivery WRMP24 actions (dry scenario). If we take account of plans identified in the 2024 round of water company water resources management plans the environmental requirements could reduce to 2,700 Ml/d (full expectations).
The data behind these maps is available from the Environment Agency’s Water Hub and is presented at a water body scale.
For an explanation of the development and history of the Environmental Destination figures, please see our technical report. This explains how the figures have evolved and how our understanding of the scale of the challenge has improved.
The Environmental Destination will result in a pressure on some, but not all, abstraction licences in those water bodies identified in the analysis. For public water supplies, this is likely to drive a need for additional options to ensure that water remains in the environment.
Environmental Destination quantifies the potential reductions that could potentially be required to abstraction to meet these environmental requirements. By presenting this analysis, it could be interpreted that there will be a need to require abstraction reductions across all licences in a catchment as the solution. This is not the case. Many abstractions will already be environmentally sustainable because they include conditions to protect flows and levels; for example, some licences will authorise abstraction to fill storage reservoirs at high flows only, avoiding pressures on low flows. The licences most at risk of change will be permanent licences in areas of greatest water stress which do not adequately protect protected site objectives, low flows or groundwater levels.
Addressing unsustainable abstractions will affect supply/demand balances across all sectors of use and will drive the need for additional demand management activity and resource development (in sustainable sources). We set out our approach for action in Section 5.
We will continue to refine our assessment of environmental need. In determining future environmental requirements, we will recognise that as climate change impacts are felt by the environment, natural flows will change, and the environmental needs of the future will reflect this changed environment. We will look at how abstraction licensing should accommodate these changing needs and how protection should be provided for important water dependent nature conservation sites within this evolving landscape, whilst providing a framework for water users to effectively plan water resources for the future.
3.2 PWS needs
By 2055, the nation will need up to an additional 5 billion litres of water per day for PWS under a Do Nothing scenario. This is enough to fill Wembley Stadium almost 4.5 times every day.
The previous National Framework for Water Resources (2020) identified that up to 3,435 Ml/d would be needed from PWS between 2020 and 2050 without continued action.
This was revised upwards to 4,800 Ml/d by 2050 in 2024 following water company assessments in water resources management plans. The increase was due to updated demand forecasts, additional reductions associated with protecting and improving the environment, and better representation of the baseline supply position without drought measures included.
The modelling for the 2025 National Framework for Water Resources shows that the headline deficit is 4,940 Ml/d by 2055.
Our modelling work uses a baseline of 2030 and takes account of the ambitious delivery of actions outlined from 2025 to 2030 in water company water resource management plans. If delivered fully, these actions reduce the deficit to 4,370 Ml/d by 2055. This figure is used in our detailed modelling analysis.
Nationally, as highlighted in Figure 6, PWS accounts for 87% of current water consumption based on fully licensed abstractions. Of PWS, water use from households (HH) currently accounts for 58% of water put into supply. This is followed by non-households (NHH), such as businesses and industry with use at around 20%. Leakage still makes up a large percentage of current PWS use, at 19%.
Figure 6: current water supply use
Fully licenced (not adjusted for consumptiveness), including PWS
| Category | Power | Water supply | Agriculture | Amenity/environment | Industry | Other | Total |
|---|---|---|---|---|---|---|---|
| Percentage | 54 | 29 | 7 | 1 | 4 | 5 | 100 |
Fully licenced (adjusted for consumptiveness), including PWS
| Category | Power | Water supply | Agriculture | Amenity/environment | Industry | Other | Total |
|---|---|---|---|---|---|---|---|
| Percentage | 3 | 87 | 4 | 0 | 5 | 1 | 100 |
Current PWS
| Category | Household consumption | Non-household consumption | Leakage | Other | Total |
|---|---|---|---|---|---|
| Percentage | 58 | 20 | 19 | 3 | 100 |
Current PWS availability is already under pressure. Figure 7 highlights that in 2025, there are already water resource zones without a surplus. Nationally, the average availability in 2025 across water resource zones is approximately 7 Ml/d. In some parts of England, water companies are not currently accepting requests for new water for some new non-domestic supplies. This could affect economic growth.
Figure 7: WRMP24 final plan supply demand balances in 2025 taken from the latest available water resource management plans
Note: some water resource zones observe a surplus of only 0 Ml/d, this is an artefact of modelling within water company plans.

| Water resource zone | Water company | Supply Demand Balance (SDB) from WRMP (Ml/d) |
|---|---|---|
| Misbourne | Affinity Water | 0.01 |
| Colne | Affinity Water | 0.01 |
| Lee | Affinity Water | 0.01 |
| Pinn | Affinity Water | 0.01 |
| Stort | Affinity Water | 0.01 |
| Wey | Affinity Water | 15.87 |
| Dour | Affinity Water | 0.34 |
| Brett | Affinity Water | 3.76 |
| Alwen/Dee | Dŵr Cymru Welsh Water | 7.04 |
| Hereford CU System | Dŵr Cymru Welsh Water | 1.75 |
| Pilleth | Dŵr Cymru Welsh Water | 0.7 |
| Ross-on-Wye | Dŵr Cymru Welsh Water | 2.53 |
| SE Wales CU System | Dŵr Cymru Welsh Water | 4.06 |
| Vowchurch | Dŵr Cymru Welsh Water | 0.35 |
| Whitbourne | Dŵr Cymru Welsh Water | 1.05 |
| Berwick-Fowberry | Northumbrian Water | 2.34 |
| Kielder | Northumbrian Water | 44.18 |
| SES Water | SES Water | 24.08 |
| Ashford | South East Water | 3.13 |
| Bracknell | South East Water | 30.43 |
| Cranbrook | South East Water | 0 |
| Eastbourne | South East Water | 13.87 |
| Farnham | South East Water | 14.29 |
| Haywards Heath | South East Water | 0 |
| Maidstone | South East Water | 24.57 |
| Tunbridge Wells | South East Water | 7.27 |
| South Staffordshire | South Staffordshire Water | 2.03 |
| Llandinam and Llanwrin | Hafren Dyfrdwy | 3.84 |
| Llanfyllin | Hafren Dyfrdwy | 1.47 |
| Saltney | Hafren Dyfrdwy | 1.41 |
| Wrexham | Hafren Dyfrdwy | 5.88 |
| Guildford | Thames Water | 19.4 |
| Henley | Thames Water | 7.42 |
| Kennet Valley | Thames Water | 35.76 |
| London | Thames Water | 62.58 |
| Slough Wycombe Aylesbury | Thames Water | 22.79 |
| Swindon and Oxfordshire | Thames Water | 14.29 |
| Wessex | Wessex Water | 36.95 |
| East surface water zone | Yorkshire Water | 4.88 |
| Grid surface water zone | Yorkshire Water | 29.69 |
| Essex Central | Anglian Water | 0.01 |
| Essex South | Anglian Water | 0 |
| Fenland | Anglian Water | 0 |
| Hartlepool | Anglian Water | 7.98 |
| Lincolnshire Bourne | Anglian Water | 0 |
| Lincolnshire Central | Anglian Water | 0 |
| Lincolnshire East | Anglian Water | 1.39 |
| Lincolnshire Retford and Gainsborough | Anglian Water | 1.99 |
| Norfolk Aylsham | Anglian Water | 0.12 |
| Norfolk Bradenham | Anglian Water | 0.01 |
| Norfolk East Dereham | Anglian Water | 0.93 |
| Norfolk East Harling | Anglian Water | 0.12 |
| Norfolk Happisburgh | Anglian Water | 0 |
| Norfolk Harleston | Anglian Water | 0 |
| Norfolk North Coast | Anglian Water | 0.21 |
| Norfolk Norwich and the Broads | Anglian Water | 0.04 |
| Norfolk Wymondham | Anglian Water | 0.01 |
| Ruthamford Central | Anglian Water | 0 |
| Ruthamford North | Anglian Water | 12.18 |
| Ruthamford South | Anglian Water | 0 |
| Ruthamford West | Anglian Water | 0 |
| Suffolk East | Anglian Water | 0 |
| Suffolk Ixworth | Anglian Water | 1.3 |
| Suffolk Sudbury | Anglian Water | 2.3 |
| Suffolk Thetford | Anglian Water | 0.46 |
| Suffolk West and Cambs | Anglian Water | 0 |
| Bristol | Bristol Water | 20.59 |
| Cambridge | Cambridge Water | 3.48 |
| Blyth | Essex and Suffolk Water | 2.37 |
| Essex | Essex and Suffolk Water | 3.46 |
| Hartismere | Essex and Suffolk Water | 0.27 |
| Northern Central | Essex and Suffolk Water | 9.37 |
| Portsmouth | Portsmouth Water | 0.59 |
| Bournemouth | South West Water | 12.24 |
| Colliford | South West Water | 4.45 |
| Roadford | South West Water | 2.64 |
| Wimbleball | South West Water | 0.16 |
| Isles of Scilly | South West Water | 0.67 |
| Hamps Andover | Southern Water | 5.75 |
| Hamps Kingsclere | Southern Water | 3.83 |
| Hamps Rural | Southern Water | 0 |
| Hamps Winchester | Southern Water | 3.32 |
| Isle of Wight | Southern Water | 0 |
| Kent Medway East | Southern Water | 0 |
| Kent Medway West | Southern Water | 3.76 |
| Kent Thannet | Southern Water | 0 |
| Southampton East | Southern Water | 15.4 |
| Southampton West | Southern Water | 4.6 |
| Sussex Brighton | Southern Water | 0 |
| Sussex Hastings | Southern Water | 0 |
| Sussex North | Southern Water | 8.44 |
| Sussex Worthing | Southern Water | 0 |
| Bishops Castle | Severn Trent Water | 1.22 |
| Chester | Severn Trent Water | 2.52 |
| Forest and Stroud | Severn Trent Water | 7.12 |
| Kinsall | Severn Trent Water | 0.64 |
| Mardy | Severn Trent Water | 1.47 |
| Newark | Severn Trent Water | 3.46 |
| North Staffs | Severn Trent Water | 10.4 |
| Rutland | Severn Trent Water | 2.86 |
| Ruyton | Severn Trent Water | 0.28 |
| Shelton | Severn Trent Water | 13.84 |
| Stafford | Severn Trent Water | 5.35 |
| Nottinghamshire | Severn Trent Water | 21.83 |
| Strategic Grid | Severn Trent Water | 30.76 |
| Whitchurch and Wem | Severn Trent Water | 3.99 |
| Wolverhampton | Severn Trent Water | 6.77 |
| Carlisle | United Utilities | 4.57 |
| North Eden | United Utilities | 5.61 |
| UU-Strategic | United Utilities | 9.36 |
| Veolia Water P | Veolia Water Projects Limited | 0.09 |
Figure 8: Future PWS needs and components of the supply demand balance in Ml/d under the four modelled scenarios of Do Nothing, High, Central and Low at 2055.

| Do Nothing | High | Central | Low | |
|---|---|---|---|---|
| HH population and PCC impact on demand | -992.98 | -98.99 | 593.57 | 1,815.58 |
| NHH growth impact on demand | 0 | -209.88 | 376.60 | 515.53 |
| Leakage impact on demand | 0 | 232.57 | 543.83 | 855.08 |
| Resilience impact on supply | -627.35 | -627.35 | -627.35 | -627.35 |
| Climate change impact on supply | -344.12 | -772.68 | -210.47 | -162.24 |
| Environmental needs impact on supply | -2,624.47 | -3,083.44 | -3,024.12 | -2,652.02 |
| Resource options impact on supply | 0 | 1,511.51 | 1,511.51 | 1,511.51 |
| Drought measures impact on supply | 0 | 453.24 | 505.04 | 452.41 |
| Supply demand balance | -4,371.30 | -1,565.97 | 277.87 | 2,317.76 |
Figure 8 shows the range of national future PWS needs by 2055 under the modelled scenarios (referred to as supply demand balance). This could range from 0 Ml/d (where we see a surplus of almost 2,320 Ml/d under the Low water needs scenario) to an additional need (deficit) of up to 4,370 Ml/d under the Do Nothing scenario. This is a range of around 6,700 Ml/d. Even with the delivery of all the resource development in company plans and 60% of the demand management reductions currently planned (as presented in the High water needs scenario) there is still a deficit. It shows that delivery of the actions identified through water resources planning (under Central and Low scenarios) can achieve a surplus but strongly highlights the importance of delivering resource development and demand management actions in current plans to resolve those deficits.
The national pressures that contribute to the overall supply-demand-balance vary significantly across each of the modelled scenarios as highlighted in Figure 9.
Future water needs will vary at a regional, water company and water resource zone scales across the modelled scenarios. This is outlined in Figure 9. Whilst the nation may observe an overall surplus, there are still deficits observed at a water company resource zone scale. The full range of modelled outputs are described in detail at the regional scale in Appendix A.
Figure 9: Future PWS availability under the modelled scenarios (maps)
Key:
- darkest red: -700 Ml/d
- darkest blue: 700 Ml/d
Low

Central

High

Do Nothing

Under two of the modelled scenarios, England will observe a water supply deficit in 2055. The reduction in supply to meet environmental needs accounts for over half of the total deficit under both scenarios (around 57% under the Do Nothing scenario).
| Water resource zone | Water company | Low SDB at 2055 | Central SDB at 2055 | High SDB at 2055 | Do Nothing SDB at 2055 |
|---|---|---|---|---|---|
| Misbourne | Affinity Water | 6.44 | -11.22 | -17.83 | -22.37 |
| Colne | Affinity Water | 28.84 | -18.9 | -36.65 | -114.25 |
| Lee | Affinity Water | 32.43 | -15.39 | -29.48 | -140.78 |
| Pinn | Affinity Water | 28.1 | -20.21 | -43.88 | -59.7 |
| Stort | Affinity Water | 8.1 | -11.14 | -18.45 | -56.06 |
| Wey | Affinity Water | 37.18 | 9.11 | -2.84 | -21.56 |
| Dour | Affinity Water | 5.84 | -2.5 | -5.97 | -20.72 |
| Brett | Affinity Water | 6.93 | 2.89 | -0.04 | -1.14 |
| Alwen/Dee | Dŵr Cymru Welsh Water | 24.94 | 21.48 | 17.74 | 7.71 |
| Hereford CU System | Dŵr Cymru Welsh Water | 10.19 | 10.19 | 10.19 | 3.17 |
| Pilleth | Dŵr Cymru Welsh Water | 1.15 | 0.99 | 0.83 | 0.67 |
| Ross-on-Wye | Dŵr Cymru Welsh Water | 3.79 | 3.79 | 3.79 | 2.32 |
| SE Wales CU System | Dŵr Cymru Welsh Water | 110.29 | 85.13 | 52.81 | -3.69 |
| Vowchurch | Dŵr Cymru Welsh Water | 0.61 | 0.61 | 0.61 | 0.18 |
| Whitbourne | Dŵr Cymru Welsh Water | 1.21 | 1.21 | 1.21 | 0.25 |
| Berwick-Fowberry | Northumbrian Water | 0.21 | -2.35 | -2.91 | 1.08 |
| Kielder | Northumbrian Water | 218.68 | 132.88 | 38.95 | -25.93 |
| SES Water | SES Water | 21.89 | -27.5 | -42.14 | -38.01 |
| Ashford | South East Water | 0.65 | -34.7 | -45.45 | -74.36 |
| Bracknell | South East Water | 33.47 | -9.84 | -24.48 | -24.26 |
| Cranbrook | South East Water | 2.74 | -2.48 | -4.61 | -13.77 |
| Eastbourne | South East Water | 0.02 | -13.58 | -18.56 | -15.61 |
| Farnham | South East Water | 10.05 | 2.28 | -1.58 | 9.07 |
| Haywards Heath | South East Water | 5.83 | -4.13 | -9.25 | -19.27 |
| Maidstone | South East Water | 3.94 | -11.1 | -17.84 | -32.68 |
| Tunbridge Wells | South East Water | -0.56 | -10.85 | -13.99 | -16.69 |
| South Staffordshire | South Staffordshire Water | -26.32 | -52.32 | -108.66 | -136.29 |
| Llandinam and Llanwrin | Hafren Dyfrdwy | 9.73 | 8.59 | 7.59 | 4.42 |
| Llanfyllin | Hafren Dyfrdwy | 4.22 | 3.81 | 3.46 | 1.67 |
| Saltney | Hafren Dyfrdwy | 2.21 | 1.97 | 1.76 | 1.39 |
| Wrexham | Hafren Dyfrdwy | 13.95 | 10.94 | 8.29 | 4.97 |
| Guildford | Thames Water | -0.35 | -8.72 | -13.57 | -15.34 |
| Henley | Thames Water | 0.42 | -1.41 | -2.77 | -2.05 |
| Kennet Valley | Thames Water | 12.35 | -4.17 | -14.46 | -36.75 |
| London | Thames Water | 270.86 | -63.9 | -271.75 | -646.83 |
| Slough Wycombe Aylesbury | Thames Water | 14.16 | -6.75 | -21.25 | -41.32 |
| Swindon and Oxfordshire | Thames Water | 63.72 | 21.63 | -5.58 | -92.94 |
| Wessex | Wessex Water | 68.07 | 20.47 | -8.29 | -47.37 |
| East surface water zone | Yorkshire Water | 6.4 | 4.97 | 2.99 | 4.09 |
| Grid surface water zone | Yorkshire Water | 262.09 | 98.71 | -107.63 | -298.52 |
| Essex Central | Anglian Water | 1.39 | -1.69 | -3.49 | -8.01 |
| Essex South | Anglian Water | 10.27 | -6.07 | -11.62 | -35.15 |
| Fenland | Anglian Water | 8.08 | -4.34 | -11.55 | -22.47 |
| Hartlepool | Anglian Water | 8.76 | 4.2 | 1.65 | 1.77 |
| Lincolnshire Bourne | Anglian Water | 6.61 | -3.38 | -6.32 | -23.52 |
| Lincolnshire Central | Anglian Water | 19.24 | -14.76 | -29.98 | -94.13 |
| Lincolnshire East | Anglian Water | 14.48 | -6.3 | -17.44 | -34.6 |
| Lincolnshire Retford and Gainsborough | Anglian Water | 2.35 | -1.24 | -2.89 | -0.88 |
| Norfolk Aylsham | Anglian Water | 2.08 | 1.4 | 1.3 | -0.2 |
| Norfolk Bradenham | Anglian Water | 0.9 | -1.05 | -2.01 | -5.88 |
| Norfolk East Dereham | Anglian Water | 0.5 | -0.52 | -1 | 0.46 |
| Norfolk East Harling | Anglian Water | 0.43 | -0.86 | -1.38 | -2.5 |
| Norfolk Happisburgh | Anglian Water | 0.64 | 0.2 | -0.13 | 0.79 |
| Norfolk Harleston | Anglian Water | 0.55 | -0.29 | -1.02 | -1.81 |
| Norfolk North Coast | Anglian Water | 1.33 | -2.4 | -3.94 | -9.75 |
| Norfolk Norwich and the Broads | Anglian Water | 7.74 | -9.76 | -15.76 | -34.88 |
| Norfolk Wymondham | Anglian Water | 0.98 | -1.89 | -3.25 | -5.56 |
| Ruthamford Central | Anglian Water | 23.25 | -0.45 | -22 | 5.33 |
| Ruthamford North | Anglian Water | 28.22 | -3.31 | -49.73 | -63.96 |
| Ruthamford South | Anglian Water | 19.46 | -5.13 | -37.81 | -93.15 |
| Ruthamford West | Anglian Water | 1.26 | -0.08 | -1.55 | -0.26 |
| Suffolk East | Anglian Water | 9.31 | -3.76 | -8.72 | -20.03 |
| Suffolk Ixworth | Anglian Water | 0.75 | -0.61 | -0.99 | 0.64 |
| Suffolk Sudbury | Anglian Water | 0.78 | -0.72 | -1.24 | 0.25 |
| Suffolk Thetford | Anglian Water | 1.29 | -0.63 | -1.59 | -4.44 |
| Suffolk West and Cambs | Anglian Water | 10.03 | -5.43 | -10.42 | -34.65 |
| Bristol | Bristol Water | 71.49 | 45.87 | 23.8 | -7.61 |
| Cambridge | Cambridge Water | 25.3 | 0.53 | -16.14 | -67.67 |
| Blyth | Essex and Suffolk Water | -3.13 | -5.46 | -6.39 | -4.29 |
| Essex | Essex and Suffolk Water | 109.96 | 81.38 | -19.89 | -49.28 |
| Hartismere | Essex and Suffolk Water | 0.74 | -0.91 | -1.84 | -1.93 |
| Northern Central | Essex and Suffolk Water | -21.41 | -32.77 | -36.32 | -31.1 |
| Portsmouth | Portsmouth Water | -30.55 | -62.83 | -100.3 | -142.72 |
| Bournemouth | South West Water | 97.65 | 85.02 | 74.9 | -20.01 |
| Colliford | South West Water | 50.65 | 41.86 | 14.96 | -12.98 |
| Roadford | South West Water | 87.16 | 74.48 | 51.49 | -21.59 |
| Wimbleball | South West Water | 26.97 | 23.96 | 4.56 | -29.83 |
| Isles of Scilly | South West Water | 1 | 0.84 | 0.77 | 0.69 |
| Hamps Andover | Southern Water | 5.25 | 1.09 | -0.77 | -10.71 |
| Hamps Kingsclere | Southern Water | 1.73 | 0.29 | -0.26 | 0.49 |
| Hamps Rural | Southern Water | 1.26 | 0.24 | -0.35 | -4.05 |
| Hamps Winchester | Southern Water | 7.78 | 1.89 | -0.2 | -19.83 |
| Isle of Wight | Southern Water | 6.32 | 0.95 | -1.85 | -12.24 |
| Kent Medway East | Southern Water | 29.89 | 19.57 | 5.59 | -60.47 |
| Kent Medway West | Southern Water | 16.47 | 5.24 | 0.74 | -26.4 |
| Kent Thannet | Southern Water | 15.91 | 3.44 | -0.53 | -35.04 |
| Southampton East | Southern Water | 35.64 | 15.5 | -6.91 | -55.84 |
| Southampton West | Southern Water | 3.16 | -0.25 | -2.72 | -72.13 |
| Sussex Brighton | Southern Water | 19.75 | 2.66 | -2.59 | -48.08 |
| Sussex Hastings | Southern Water | 3.6 | 1.57 | -1.87 | -7.01 |
| Sussex North | Southern Water | 7.88 | 0.87 | -4.83 | -49.47 |
| Sussex Worthing | Southern Water | 15.36 | 7.47 | 3.77 | -25.18 |
| Bishops Castle | Severn Trent Water | 0.47 | -0.03 | -0.44 | -1.04 |
| Chester | Severn Trent Water | 6.74 | 4.9 | 0.4 | 0.72 |
| Forest and Stroud | Severn Trent Water | 10.94 | 6.7 | 2.5 | 1.19 |
| Kinsall | Severn Trent Water | 1.07 | 0.67 | 0.29 | 0.03 |
| Mardy | Severn Trent Water | 0.56 | 0.11 | -0.15 | -1.89 |
| Newark | Severn Trent Water | 3.13 | 2.02 | 0.98 | 0.58 |
| North Staffs | Severn Trent Water | -3.55 | -17.46 | -33.28 | -139.49 |
| Rutland | Severn Trent Water | 3.74 | 2.87 | 1.99 | 1.95 |
| Ruyton | Severn Trent Water | 0.69 | 0.19 | -0.25 | -1.06 |
| Shelton | Severn Trent Water | 13.54 | -0.5 | -10.06 | -67.39 |
| Stafford | Severn Trent Water | 15.1 | 12.31 | 10.43 | -12.23 |
| Nottinghamshire | Severn Trent Water | 22.93 | -2.52 | -22.65 | -98.48 |
| Strategic Grid | Severn Trent Water | 101.99 | -7.58 | -184.74 | -222.13 |
| Whitchurch and Wem | Severn Trent Water | 2.06 | 1.09 | 0.35 | -0.26 |
| Wolverhampton | Severn Trent Water | 6.91 | 0.77 | -4.32 | -14.05 |
| Carlisle | United Utilities | 13.3 | 8.29 | 5.81 | 2.36 |
| North Eden | United Utilities | 6.54 | 5.75 | 5.06 | 2.28 |
| UU-Strategic | United Utilities | 370.52 | 204.44 | -76.35 | -373.66 |
| Veolia Water P | Veolia Water Projects Limited | 2.42 | 1.1 | 0.74 | -0.83 |
Figure 10: The drivers of the national deficit by 2055 under the Do Nothing scenario (Ml/d)
| Driver | Ml/d |
|---|---|
| Demand from household growth | 990 |
| Resilience move to 0.2% annual chance of drought failure | 630 |
| Climate change impact to supply | 340 |
| Environmental needs impact on supply | 2,600 |
As shown in Figure 10, under the Do Nothing scenario, the water required to meet the needs of the environment is the biggest driver of future need at a national level, with 2,600 Ml/d forecast to be required by 2055 due to reductions in abstraction to meet current legal environmental requirements and government ambition (taken from WRMP24). Nationally, demand from household population growth is the second biggest driver of the deficit under Do Nothing with an increase of 990 Ml/d of additional need compared to current baseline. A major component of the last round of WRMPs was to ensure that there is increased water supply resilience for people and business where systems are expected to be resilient to a 0.2% annual chance of failure caused by a drought (meaning a 1:500 return period) by 2039. This increased resilience adds an additional 630 Ml/d to the Do Nothing deficit by 2055 under all scenarios at a national scale compared to the baseline. The changing climate puts additional pressure on water availability. Climate change as a driver for future demand is forecast to impact supply by 340 Ml/d. Please note that Figure 10 only shows the main drivers and does not represent all components of the supply demand balance. For more information, please refer to the water resources modelling technical report.
The individual and combined pressures on public water supplies can also be shown at a water company water resource zone scale. Figure 11 shows how climate change, environmental needs, population, drought resilience and in combination pressures drive a need for additional capacity between 2030 and 2055. The figure quantifies this pressure as Ml/d as a proportion of water supplied (distribution input) in each water company water resources zone, under the Do Nothing scenario.
Figure 11: The total estimated additional capacity required to meet each pressure individually and in combination by 2055 (as a proportion of the water supplied (distribution input)) under a Do Nothing scenario
Key for DI:
- darkest red: -200% of DI at 2030
- darkest blue: 200% of DI at 2030
Population impact on demand

Climate change impact on demand

Environmental needs impact on supply
Drought resilience impact on supply

Total
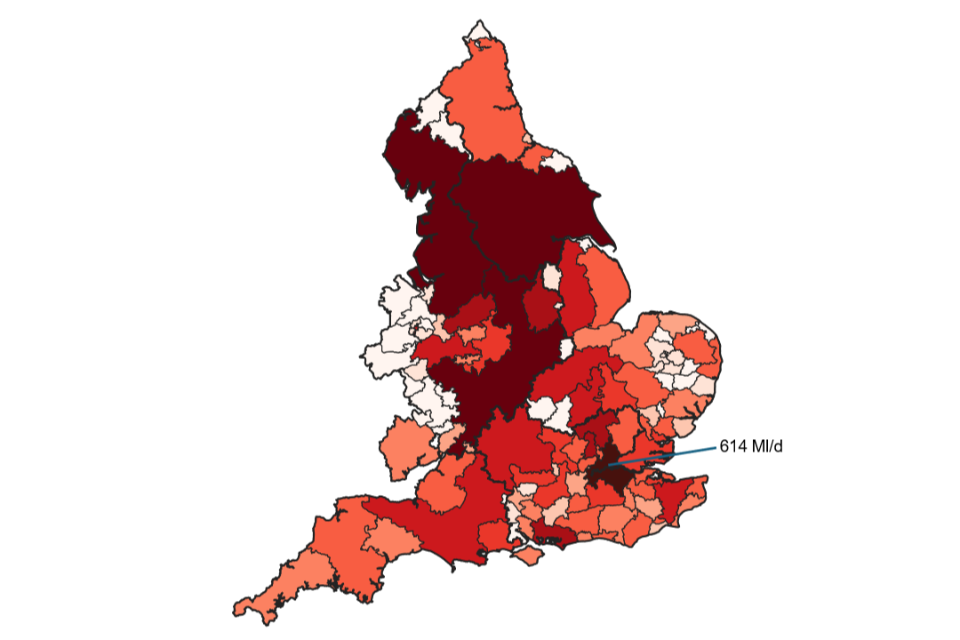
The map shows -614 Ml/d for Greater London.
| Water resource zone | Climate change | Environmental needs | Population | Drought resilience | Total SDB |
|---|---|---|---|---|---|
| Misbourne | -0.54 | -36.24 | 8.85 | -0.11 | -45.35 |
| Colne | -13.46 | -101.70 | 12.19 | 0.41 | -92.02 |
| Lee | -1.37 | -60.68 | 11.98 | -8.76 | -82.37 |
| Pinn | 0.00 | 0.00 | 10.40 | -0.19 | -12.74 |
| Stort | -1.22 | -53.26 | 11.74 | -0.08 | -66.09 |
| Wey | 0.00 | 0.00 | 10.87 | -0.26 | -10.44 |
| Dour | -1.26 | -40.17 | 9.54 | -1.94 | -53.23 |
| Brett | -1.61 | -15.61 | 7.76 | -2.88 | -28.16 |
| Alwen/Dee | -1.17 | 0.00 | 1.40 | 0.00 | 0.33 |
| Pilleth | 0.00 | 0.00 | 1.59 | 0.00 | -11.98 |
| SE Wales CU System | -0.39 | 0.00 | 3.03 | 0.00 | -4.88 |
| Berwick-Fowberry | 0.00 | 0.00 | 3.47 | 0.00 | -1.86 |
| Kielder | -2.54 | 0.00 | 3.99 | 0.00 | -5.73 |
| SES Water | -3.18 | -19.76 | 9.49 | -4.38 | -34.30 |
| Ashford | 0.03 | -84.36 | 10.32 | -0.02 | -118.64 |
| Bracknell | -0.25 | -22.25 | 8.45 | -0.81 | -38.14 |
| Cranbrook | 0.53 | -19.64 | 11.86 | -5.24 | -62.33 |
| Eastbourne | -1.16 | -49.60 | 8.51 | -0.92 | -63.07 |
| Farnham | 0.31 | -9.53 | 7.08 | -0.32 | -17.05 |
| Haywards Heath | -2.10 | -10.87 | 10.51 | -1.42 | -25.64 |
| Maidstone | 0.11 | -38.79 | 9.12 | -2.39 | -77.90 |
| Tunbridge Wells | 0.88 | -61.85 | 9.09 | -6.24 | -76.70 |
| South Staffordshire | -1.03 | -9.56 | 7.19 | 0.00 | -19.04 |
| Llandinam and Llanwrin | 0.00 | 0.00 | -0.86 | 0.00 | 2.37 |
| Llanfyllin | 0.00 | 0.00 | -0.63 | 0.00 | 1.49 |
| Saltney | 0.00 | 0.00 | 0.00 | 0.00 | -1.85 |
| Wrexham | -9.77 | 0.00 | -1.99 | 0.00 | -3.98 |
| Guildford | 0.00 | -62.11 | 5.45 | 0.00 | -67.09 |
| Henley | 0.00 | -66.01 | 7.74 | 0.00 | -73.68 |
| Kennet Valley | -1.98 | -27.43 | 6.30 | -30.21 | -64.40 |
| London | -4.63 | -16.82 | 9.09 | -12.94 | -33.73 |
| Slough Wycombe Aylesbury | -0.15 | -32.42 | 4.77 | 0.03 | -37.14 |
| Swindon and Oxfordshire | -2.58 | -22.03 | 8.16 | -8.45 | -34.45 |
| Wessex | -0.39 | -18.33 | 3.99 | -1.23 | -25.25 |
| East surface water zone | -7.38 | 0.00 | 6.06 | 0.00 | -10.18 |
| Grid surface water zone | -3.50 | -9.15 | 5.96 | -5.91 | -25.54 |
| Essex Central | 0.00 | -82.60 | 7.52 | 0.00 | -87.63 |
| Essex South | -0.66 | -44.50 | 11.16 | -7.88 | -57.94 |
| Fenland | -0.78 | -34.40 | 5.73 | -15.46 | -40.46 |
| Hartlepool | 0.00 | -26.62 | 1.40 | 0.00 | -24.83 |
| Lincolnshire Bourne | 0.00 | -48.64 | 6.39 | 0.00 | -54.19 |
| Lincolnshire Central | -0.47 | -61.74 | 5.15 | -3.40 | -73.30 |
| Lincolnshire East | 0.00 | -35.82 | 3.72 | 0.00 | -32.38 |
| Lincolnshire Retford and Gainsborough | 0.00 | -13.45 | 5.80 | 0.00 | -16.97 |
| Norfolk Aylsham | 0.00 | -2.75 | 11.04 | 0.00 | -9.52 |
| Norfolk Bradenham | 0.00 | -45.54 | 8.18 | 0.00 | -69.90 |
| Norfolk East Dereham | 0.00 | -36.80 | 7.35 | 0.00 | -14.20 |
| Norfolk East Harling | 0.00 | -83.29 | 5.81 | 0.00 | -86.45 |
| Norfolk Happisburgh | 0.00 | 0.00 | 5.57 | 0.00 | 19.72 |
| Norfolk Harleston | 0.00 | -12.93 | 6.32 | 0.00 | -20.48 |
| Norfolk North Coast | 0.00 | -60.54 | 7.56 | 0.00 | -66.99 |
| Norfolk Norwich and the Broads | 0.00 | -33.61 | 9.38 | 0.00 | -49.57 |
| Norfolk Wymondham | 0.00 | -84.99 | 7.51 | 0.00 | -52.48 |
| Ruthamford Central | 0.00 | 0.00 | 26.93 | 0.00 | 7.49 |
| Ruthamford North | -3.16 | 0.31 | 12.16 | -18.54 | -36.27 |
| Ruthamford South | -5.26 | -5.42 | 17.02 | -31.37 | -83.48 |
| Ruthamford West | 0.00 | 0.00 | 6.98 | 0.00 | -1.26 |
| Suffolk East | -0.12 | -20.88 | 6.69 | -2.77 | -29.35 |
| Suffolk Ixworth | 0.00 | -54.04 | 6.45 | 0.00 | -33.12 |
| Suffolk Sudbury | 0.00 | -39.35 | 7.72 | 0.00 | -31.04 |
| Suffolk Thetford | 0.00 | -42.59 | 6.15 | 0.00 | -53.16 |
| Suffolk West and Cambs | -0.03 | -36.15 | 7.81 | -0.51 | -56.55 |
| Bristol | -3.82 | -2.77 | 10.19 | 0.00 | -15.59 |
| Cambridge | 0.53 | -57.25 | 8.07 | -4.43 | -68.43 |
| Blyth | 0.00 | -34.73 | 4.31 | 0.00 | -37.95 |
| Essex | -3.08 | -1.79 | 10.43 | -4.15 | -13.44 |
| Hartismere | 0.00 | -6.94 | 5.20 | 0.00 | -16.62 |
| Northern Central | 0.00 | -87.33 | 4.82 | 0.00 | -77.30 |
| Portsmouth | -4.48 | -73.34 | 9.77 | -5.16 | -78.43 |
| Bournemouth | 0.00 | -43.36 | 3.86 | 0.00 | -45.14 |
| Colliford | -2.01 | -6.61 | 10.88 | 0.00 | -13.57 |
| Roadford | -0.33 | -12.75 | 5.33 | 0.00 | -12.03 |
| Wimbleball | -4.14 | -16.53 | 12.41 | -1.25 | -27.76 |
| Isles of Scilly | 0.00 | 0.00 | 5.59 | 0.00 | 0.49 |
| Hamps Andover | 0.00 | -79.80 | 6.54 | 0.00 | -84.59 |
| Hamps Kingsclere | 0.00 | -92.92 | 10.43 | 0.00 | -101.38 |
| Hamps Rural | 0.00 | -52.38 | 6.65 | 0.00 | -56.97 |
| Hamps Winchester | 0.00 | -125.46 | 5.81 | 0.00 | -127.30 |
| Isle of Wight | 0.21 | -45.81 | 5.89 | -5.73 | -56.76 |
| Kent Medway East | -14.28 | -67.91 | 10.71 | -1.09 | -82.98 |
| Kent Medway West | 0.00 | -49.68 | 12.37 | 0.00 | -60.01 |
| Kent Thannet | 0.00 | -65.65 | 13.41 | -3.59 | -76.08 |
| Southampton East | -26.74 | -23.46 | 7.51 | -17.73 | -28.50 |
| Southampton West | 0.00 | 0.00 | 7.74 | 0.00 | -1.26 |
| Sussex Brighton | 3.02 | -52.00 | 7.41 | -2.87 | -57.05 |
| Sussex Hastings | -10.57 | -6.78 | 8.42 | -4.89 | -28.81 |
| Sussex North | -6.23 | -14.23 | 8.79 | -47.06 | -62.35 |
| Sussex Worthing | 1.42 | -49.10 | 11.29 | 0.00 | -56.08 |
| Bishops Castle | -0.66 | -155.96 | 5.16 | 0.00 | -161.01 |
| Chester | -5.34 | -9.49 | 6.42 | 0.00 | -18.56 |
| Forest and Stroud | -0.24 | -19.85 | 6.35 | -5.91 | -30.02 |
| Kinsall | 0.00 | -63.53 | 7.00 | 0.00 | -69.43 |
| Mardy | 0.00 | -190.16 | 6.42 | 0.00 | -192.50 |
| Newark | 0.00 | -32.16 | 6.15 | -4.77 | -42.94 |
| North Staffs | -2.98 | -88.76 | 3.41 | -0.41 | -109.14 |
| Rutland | 0.00 | 0.00 | 6.24 | 0.00 | -7.80 |
| Ruyton | 0.00 | -67.33 | 5.59 | 0.00 | -73.52 |
| Shelton | 0.00 | -76.09 | 7.86 | 0.00 | -83.08 |
| Stafford | 0.00 | -87.41 | 7.26 | 0.00 | -93.53 |
| Nottinghamshire | 0.00 | -43.47 | 6.06 | -4.00 | -52.69 |
| Strategic Grid | -2.59 | -7.92 | 7.43 | -4.08 | -20.87 |
| Whitchurch and Wem | 0.00 | -72.83 | 7.64 | 0.00 | -78.12 |
| Wolverhampton | 0.00 | -35.88 | 6.89 | 0.00 | -41.35 |
| Carlisle | -0.28 | -0.22 | 7.19 | 0.00 | -10.91 |
| North Eden | 0.00 | 0.00 | 1.34 | 0.00 | -2.60 |
| UU-Strategic | -2.43 | -7.62 | 4.16 | 0.00 | -21.63 |
| Veolia Water P | -15.74 | 0.00 | 1.81 | 0.00 | -18.61 |
| Ross-on-Wye | 0.00 | 0.00 | 5.25 | 0.00 | -0.34 |
| Vowchurch | 0.00 | 0.00 | 5.86 | 0.00 | -3.04 |
| Whitbourne | 0.00 | 0.00 | 4.70 | 0.00 | -6.08 |
| Hereford CU System | 0.00 | 0.00 | 5.51 | 0.00 | -16.71 |
3.3 Direct abstraction: the needs of other sectors
Our future estimates of non-public water needs, show that the total additional consumptive water requirements for other sectors by the 2050s could be 1090 Ml/d. This includes an assessment of future water needs for carbon capture and storage and hydrogen production which estimates that 767 Ml/d will be needed by 2050 (see chapter 7).
Nationally, spray irrigation has a high projected increase in water consumption with a potential increase of 170 Ml/d. The food and drink, chemicals and paper and pulp sectors show a potential increase of 30, 20 and 5 Ml/d of water consumption respectively by the 2050s.
3.3.1 Baseline use
It is not just water companies that provide water for business and water using sectors. Water users who abstract directly from the water environment are currently licensed for 114,000 Ml/d and abstract 28,000 Ml/d of freshwater from rivers and groundwater. This demand is forecast to increase to 33,000 Ml/d by the 2050s (not adjusted for consumptiveness).
Figure 12: Proportion of licensed and actual non-public water abstraction by sector
Fully licensed (adjusted for consumptiveness), excluding PWS
| Category | Power | Water supply | Agriculture | Amenity/environment | Industry | Other | Total |
|---|---|---|---|---|---|---|---|
| Percentage | 20 | 4 | 33 | 1 | 34 | 8 | 100 |
Fully licensed (adjusted for consumptiveness), including PWS
| Category | Power | Water supply | Agriculture | Amenity/environment | Industry | Other | Total |
|---|---|---|---|---|---|---|---|
| Percentage | 3 | 87 | 5 | 0 | 5 | 1 | 100 |
Recent actual (adjusted for consumptiveness), excluding PWS
| Category | Power | Water supply | Agriculture | Amenity/environment | Industry | Other | Total |
|---|---|---|---|---|---|---|---|
| Percentage | 23 | 4 | 30 | 1 | 37 | 5 | 100 |
Recent actual (adjusted for consumptiveness), including PWS
| Category | Power | Water supply | Agriculture | Amenity/environment | Industry | Other | Total |
|---|---|---|---|---|---|---|---|
| Percentage | 2 | 91 | 3 | 0 | 4 | 0 | 100 |
Figure 12 shows current estimated proportion of abstraction from freshwater by purpose and adjusted for consumptiveness, excluding navigation. The charts show both excluding and including PWS . PWS is the largest water abstractor.
(Abstraction related to navigation has been excluded from this assessment. This is because not all abstractions and transfers to support navigation have been represented in the WRGIS abstraction datasets used in this assessment; some navigation transfers may have been accounted for elsewhere as complex activities in the WRGIS. For more information on abstracted related to navigation, please refer to the water resources modelling technical report.)
If PWS use is excluded, under recent actual abstraction rates (and adjusted for consumptiveness), the industry sector uses the most water nationally at 37%, followed by agriculture (30%) and then power (23%). Under fully licensed quantities (adjusted for consumptiveness) the split is very similar to recent actual, with the industry sector at 34%, agriculture at 33% and power generation reduced to 20%.
Figure 13: Recent actual consumptive non-public water abstraction by Regional Group in Ml/d
| Final primary sector | WCWE | WRE | WReN | WRSE | WRW |
|---|---|---|---|---|---|
| Agriculture | 54 | 159 | 30 | 38 | 76 |
| Industry | 129 | 47 | 44 | 31 | 185 |
| Other | 13 | 24 | 0 | 8 | 17 |
| Power | 1 | 116 | 93 | 28 | 43 |
| Water supply | 12 | 24 | 3 | 3 | 8 |
| Total | 211 | 370 | 171 | 114 | 334 |
Figure 13 shows the current recent actual consumptive water abstraction from freshwater outside the water industry, excluding navigation. The graphs show how this differs across the regional groups. In the WRW geography, industry is the biggest non-PWS water user at 56%, followed by agriculture at 23%. This is a similar pattern in the WCWE geography, with industry the biggest non-PWS user in the region at 62%, followed by agriculture at 26%. In WRE, agriculture is the largest non-PWS water user at 43%, followed by the power generation sector at 31%. For the WReN region, the largest non-PWS user is the power generation sector at 54%, followed by industry at 26%, and agriculture at 18%. In the WRSE region, agriculture use at 35% is the largest water user outside of PWS, closely followed by industry at 28%.
WRE and WRW have the highest current consumptive water abstraction across the regional groups with 370 Ml/d and 334 Ml/d respectively.
3.3.2 Forecast demands
The analysis in 3.3.1 is based on how water is currently used outside the water industry. This section explores how water use in other sectors may change in the future. This is based on work undertaken for the first National Framework (2020) by Defra and a team of sector experts. This work examined the drivers for, and uncertainties in, water demand outside of public-water supply and provided best and upper estimate growth factors for the following sectors:
- spray irrigation
- livestock
- protected edible crops
- food and drink manufacturing
- electricity production
- paper and pulp
- chemicals manufacturing
These sectors were selected as they cover a significant proportion of current water use (in total, more than 60% of consumptive freshwater direct abstraction arising from outside of the water industry).
Please refer to Appendix 5 of the 2020 National Framework for the detailed approach and results.
To forecast future non-PWS demands, a combination of estimated growth factors used in the first National Framework and refined growth factors for specific sectors and regional groups were applied to a baseline (actual average abstraction from 2016 to 2021). These provide a ‘best estimate’ and an ‘upper’ estimate to explore sensitivities. A limitation of this approach is that it does not represent new abstraction emerging in locations where it does not take place already.
Figure 14: Potential changes in water consumption up to the 2050s for different sectors across non-PWS

West Country
| Category | Spray irrigation | Power | Chemicals | Other agriculture | Paper and pulp | Food and drink | Other industry | Private water supply | Other non-PWS sectors | Total |
|---|---|---|---|---|---|---|---|---|---|---|
| Baseline | 3.25 | 1.19 | 0.00 | 50.95 | 0.96 | 2.83 | 124.73 | 11.55 | 15.56 | 211.02 |
| Best estimate | 4.69 | 1.45 | 0.00 | 50.99 | 1.08 | 3.53 | 124.73 | 11.57 | 15.55 | 213.59 |
| Upper estimate | 5.66 | 1.97 | 0.00 | 50.99 | 1.20 | 4.36 | 124.73 | 11.61 | 15.56 | 216.08 |
East
| Category | Spray irrigation | Power | Chemicals | Other agriculture | Paper and pulp | Food and drink | Other industry | Private water supply | Other non-PWS sectors | Total |
|---|---|---|---|---|---|---|---|---|---|---|
| Baseline | 143.00 | 115.80 | 6.48 | 15.80 | 0.00 | 15.77 | 25.13 | 23.50 | 24.84 | 370.33 |
| Best estimate | 205.93 | 141.28 | 7.91 | 15.81 | 0.00 | 19.72 | 25.13 | 23.50 | 24.84 | 464.10 |
| Upper estimate | 248.47 | 192.23 | 10.17 | 15.81 | 0.00 | 24.32 | 25.13 | 23.50 | 24.84 | 564.47 |
North
| Category | Spray irrigation | Power | Chemicals | Other agriculture | Paper and pulp | Food and drink | Other industry | Private water supply | Other non-PWS sectors | Total |
|---|---|---|---|---|---|---|---|---|---|---|
| Baseline | 19.58 | 92.54 | 10.48 | 10.32 | 5.36 | 12.60 | 15.84 | 3.20 | 0.67 | 170.60 |
| Best estimate | 28.19 | 112.90 | 12.79 | 11.07 | 6.01 | 15.75 | 15.84 | 3.22 | 0.67 | 206.43 |
| Upper estimate | 34.01 | 153.62 | 16.45 | 11.07 | 6.69 | 19.42 | 15.84 | 3.23 | 0.67 | 261.02 |
South East
| Category | Spray irrigation | Power | Chemicals | Other agriculture | Paper and pulp | Food and drink | Other industry | Private water supply | Other non-PWS sectors | Total |
|---|---|---|---|---|---|---|---|---|---|---|
| Baseline | 17.69 | 28.17 | 0.63 | 20.08 | 2.89 | 2.39 | 25.21 | 3.36 | 13.09 | 113.52 |
| Best estimate | 25.48 | 34.37 | 0.77 | 21.86 | 3.94 | 2.98 | 25.27 | 3.36 | 13.09 | 131.13 |
| Upper estimate | 30.74 | 46.77 | 0.99 | 21.86 | 4.15 | 3.68 | 25.27 | 3.36 | 13.09 | 149.93 |
West
| Category | Power | Spray agriculture | Other agriculture | Chemicals | Paper and pulp | Food and drink | Other industry | Private water supply | Other non-PWS sectors | Total |
|---|---|---|---|---|---|---|---|---|---|---|
| Baseline | 54.00 | 43.15 | 19.81 | 22.46 | 9.52 | 23.64 | 132.32 | 8.36 | 20.80 | 334.06 |
| Best estimate | 77.77 | 52.64 | 24.17 | 22.68 | 10.67 | 29.54 | 132.33 | 8.36 | 20.80 | 378.95 |
| Upper estimate | 93.83 | 71.63 | 31.09 | 22.68 | 11.88 | 36.43 | 132.34 | 8.36 | 20.80 | 429.04 |
Figure 14 shows 3 scenarios. ‘Baseline’ represents average abstraction from 2016 to 2021, accounted for consumption. ‘Best estimate’ represents our assessment of the most likely estimate based on the evidence available. ‘Upper’ illustrates a reasonable upper estimate of possible water consumption. It shows an increase in demand for water not supplied by water companies for all sectors. For the sectors we have not looked at in detail there is no ‘best’ or ‘upper’ estimate and are taken as current baseline.
Of the sectors we have explored in detail, nationally, spray irrigation has a high projected increase in water consumption from a baseline consumptive recent actual abstraction of 240 Ml/d to a reasonable upper estimate of 410 Ml/d in the 2050s; a potential increase of 170 Ml/d. This is closely followed by the power generation (electricity production) sector, demonstrating a potential upper estimate increase of 190 Ml/d of water consumption by the 2050s to 470 Ml/d from a baseline position of 280 Ml/d. Nationally, the food and drink, chemicals and paper and pulp sectors show a potential upper estimate increase of 30, 20 and 5 Ml/d of water consumption respectively; increasing to 90, 60 and 24 Ml/d respectively by the 2050s. In total across all sectors, nationally, this equates to an additional non-public water need of around 400 Ml/d (adjusted for consumptiveness) by the 2050s.
This analysis does not include other industry sectors, which currently account for the highest proportion of non-PWS use (37%) at 320 Ml/d recent actual water consumption. If these demands were to increase by 6% (based on national average projections of non-household water use supplied by water companies in their WRMPs), this would equate to 24 Ml/d of additional non-public water demands.
Regional water resources groups, where spray irrigation and power generation sectors are dominant, display the highest projected increase in water consumption by the 2050s as shown in Figure 14. This includes WRE (spray irrigation and power generation), WRW (spray irrigation and power generation) and WReN (power generation).
In all the sectors examined in detail, the potential increase in demand remains lower than the total volume currently licensed for abstraction nationally. However, abstractors should not assume they can always meet future growth by using volumes of water held on their existing licences that has been historically unused. It may be that in some catchments, an increased amount of abstraction could lead to further deterioration of environmental issues.
It is important that all sectors assess and plan for their future needs and understand how pressures on the water environment such as a changing climate may affect the future availability of water they rely on now.
Figure 15: Potential future changes (upper estimate) in water consumption for different sectors across non-PWS comparing to potential future water available under licences once environmental requirements are considered. Environmental requirements shown are the fully licenced (FL) abstractions, under the full Environmental Destination planning scenario under a drier range in the 2050s.

West Country
| Category | Spray irrigation | Power | Chemicals | Other agriculture | Paper and pulp | Food and drink | Other industry | Private water supply | Other non-PWS sectors | Total |
|---|---|---|---|---|---|---|---|---|---|---|
| Upper estimate | 5.66 | 1.97 | 0.00 | 50.99 | 1.20 | 4.36 | 124.73 | 11.608 | 15.56 | 216.08 |
| NF2 ED FL | 11.83 | 1.38 | 2.74 | 18.87 | 1.76 | 5.47 | 122.82 | 9.24 | 19.63 | 193.75 |
East
| Category | Spray irrigation | Power | Chemicals | Other agriculture | Paper and pulp | Food and drink | Other industry | Private water supply | Other non-PWS sectors | Total |
|---|---|---|---|---|---|---|---|---|---|---|
| Upper estimate | 248.47 | 192.23 | 10.17 | 15.81 | 0.00 | 24.32 | 25.13 | 23.503 | 24.84 | 564.47 |
| NF2 ED FL | 223.09 | 215.51 | 4.24 | 25.64 | 0.00 | 7.06 | 37.78 | 17.49 | 86.85 | 617.67 |
North
| Category | Spray irrigation | Power | Chemicals | Other agriculture | Paper and pulp | Food and drink | Other industry | Private water supply | Other non-PWS sectors | Total |
|---|---|---|---|---|---|---|---|---|---|---|
| Upper estimate | 34.01 | 153.62 | 16.45 | 11.07 | 6.69 | 19.42 | 15.84 | 3.233 | 0.67 | 261.02 |
| NF2 ED FL | 47.04 | 82.71 | 15.22 | 13.72 | 8.62 | 13.34 | 34.45 | 7.60 | 1.71 | 224.42 |
South East
| Category | Spray irrigation | Power | Chemicals | Other agriculture | Paper and pulp | Food and drink | Other industry | Private water supply | Other non-PWS sectors | Total |
|---|---|---|---|---|---|---|---|---|---|---|
| Upper estimate | 30.74 | 46.77 | 0.99 | 21.86 | 4.15 | 3.68 | 25.27 | 3.36 | 13.09 | 149.93 |
| NF2 ED FL | 38.88 | 18.62 | 0.71 | 19.52 | 3.12 | 2.88 | 44.05 | 13.06 | 11.44 | 152.28 |
West
| Category | Spray irrigation | Power | Chemicals | Other agriculture | Paper and pulp | Food and drink | Other industry | Private water supply | Other non-PWS sectors | Total |
|---|---|---|---|---|---|---|---|---|---|---|
| Upper estimate | 93.83 | 71.63 | 31.09 | 22.68 | 11.88 | 36.43 | 132.34 | 8.36 | 20.80 | 429.04 |
| NF2 ED FL | 128.93 | 107.00 | 43.64 | 22.50 | 22.41 | 46.70 | 211.04 | 11.26 | 43.62 | 637.10 |
Figure 15 considers the upper estimate of potential future water consumption across non-PWS and compares this to the amount of water existing licence holders can use once environmental requirements have been considered under the Full Environmental Destination planning scenario (under a drier range climate scenario in the 2050s). At a high level, all regional groups except for WCWE have enough water within the total volume of future licences, once environmental needs are considered, to accommodate future growth as estimated here. For some regions (WRSE and WReN), this comparison is very close, with less than 6 Ml/d spare in total volume of licences when compared to the upper estimate of demand increases. For WCWE upper estimates of future growth exceed the total volume of future licences when environmental requirements are accounted for. This varies significantly on a sector and licence basis, where for every sector in almost every region, a select number of abstractions would be limited by their annual licensed limit once environmental needs are accounted for, under the upper range of demand increases.
This comparison of future estimates of non-public water needs and potential future licensed volumes, taking account of potential climate impacts and environmental requirements, highlights the importance of promoting water rights trading amongst non-PWS users. Water rights trading within and across sectors, as well as within regions (and even across regions in some geographies), has the potential to help ensure water is available when it is needed for non-public water users in the future.
We will continue to work with regional groups and water using sectors to help them prioritise work to better forecast water needs. This is particularly relevant where there are emerging new demands that are not reflected in this analysis; those sectors need to work with regional groups as far as possible to try and plan for this. As an example, the work undertaken and described in detail in Section 7 on future energy needs, predict a national additional consumptive need of 767 Ml/d by the 2050s for hydrogen and carbon capture storage (CCS) alone. When combined with our future estimates of non-public water needs, the total additional consumptive water requirements for other sectors by the 2050s are estimated to be 1,090 Ml/d.
Next: 4. Water availability