Evaluation of National Citizen Service 2023 to 2025: report annex
Published 13 February 2026
Applies to England

© Crown copyright 2026
This publication is licensed under the terms of the Open Government Licence v3.0 except where otherwise stated. To view this licence, visit nationalarchives.gov.uk/doc/open-government-licence/version/3 or write to the Information Policy Team, The National Archives, Kew, London TW9 4DU, or email: psi@nationalarchives.gov.uk.
Where we have identified any third party copyright information you will need to obtain permission from the copyright holders concerned.
This publication is available at https://www.gov.uk/government/publications/national-citizen-service-evaluation-2023-to-2025/evaluation-of-national-citizen-service-2023-to-2025-report-annex
Annex A: Process evaluation
A1. Qualitative research
Research questions for the process evaluation included:
-
Are new service lines being implemented as intended, and how well has implementation gone?
-
How well is the relationship between NCS Trust as a grant funder/contractor and the partners delivering the programme working?
-
What has been the programme’s reach and level of engagement across different service lines and activities?
-
What do young people think about the various experiences on offer?
Qualitative methods and sampling changed from Year 1 to Year 2, based on Year 1 learnings. The approach for each year was as follows.
Year 1
The Social Agency (known as Basis Social at the time the evaluation was commissioned) conducted 17 in-depth online interviews with NCS delivery partner staff responsible for both the design and implementation of NCS experiences and for managing relationships with NCST (referred to hereafter as strategic leads). This included:
-
Four interviews with residential strategic leads
-
Six interviews with community open-to-all strategic leads
-
Six interviews with community targeted strategic leads
-
One interview with a digital strategic lead
Delivery partners were selected in consultation with NCST. For in-person (residential and community) service lines, the sampling approach aimed to ensure a spread by geographic region, size of organisation, types of activities delivered to young people and, for the residential service line, content theme (‘Boss it’, ‘Live it’, ‘Change it’). The digital strategic lead was not a purposively sampled organisation; rather they were interviewed as they were one of the most advanced in their programme design/delivery. Delays to the roll out of other digital experiences meant most digital strategic lead interviews did not take place until Year 2.
Additionally in year 1, The Social Agency conducted 8 half-day site visits to a mix of residential (n2) and community open to all (n6) experiences. These experiences were organised with a subset of delivery partners involved in the online interviews. Sampling was again designed to reflect a spread by region, delivery organisation size, activity types and (for residential site visits) content themes. The sample was weighted towards community open to all experiences as this was a new, and consequently less well understood, service line.
During the site visits, researchers observed programme activities and spoke to delivery staff and young people. In the interests of not impacting programme delivery on the day, this was either done through informal conversations during breaks, or more formally via small focus group discussions (young people) and interviews (staff) depending on the programme activity in question.
Year 2
In Year 2, The Social Agency conducted:
-
Twenty online interviews with strategic leads working on behalf of organisations delivering the NCS residential (n5), community open to all (n9) and community targeted (n6) service lines, all of which began their second year of delivery in April 2024. This included a mix of leads recontacted from Year 1 (to understand progress since this time) and ‘fresh’ leads for Year 2.
-
Two half-day site visits to community open-to-all experiences, during which researchers spoke to staff and young people about their experiences and observed programme activities. As in Year 1, the community service line was prioritised because it was new to the programme, and therefore warranted further research compared to the more familiar residential service line.
-
Five online interviews with strategic leads working on behalf of organisations delivering NCS digital experiences. These interviews were staggered across the year, reflecting the fact that digital experiences were procured and delivered at different points during the programme. Two of these interviews were added on to the original sample and took place after the NCS programme had technically closed. Reasons for this are presented below.
-
Twelve online interviews with young people who had taken part in a residential experience, to understand more about programme experiences from the participants’ perspectives. These interviews were conducted in two waves, first in late August 2024, for young people taking part in summer residentials, and second in November 2024, for young people taking part in October half term residentials.
The sampling approach was designed to achieve a good spread according to a range of criteria. For residential and community open to all and targeted service lines, these criteria included:
-
a mix of content themes (for the residential service line) and experiences aimed at different NCS objectives involving a spread of activities (for the community service line); and,
-
ensuring representation of all three service lines in specific NCS regions, to enable examination of how different service lines worked together in specific locations.
For site visits, sampling aimed for a spread of different types of experience, focussed on different NCS objectives (e.g. one focussed more on work-readiness, another more geared towards social action). For interviews with young people taking part in residential, sampling criteria included:
-
an even spread of the three content themes
-
each young person took part in an experience in a different region, delivered by a different delivery partner
-
a mix of experiences provided by larger and smaller delivery partners, as measured by the total number of places they were providing as part of NCS.
For the digital service line, the interview in Year 1 and the first three interviews in Year 2 (n4) were with delivery partners whose experiences were also covered by the impact evaluation. The final two interviews (which both took place in Year 2) were conducted after the NCS programme had officially closed, taking place in May 2025. These interviews were included to ensure that the research covered experiences implemented later in the programme, by which point NCST had been able to embed learnings from earlier experiences. This meant these experiences tended to encounter fewer barriers and were overall seen as more successful than earlier ones.
Analysis
The qualitative analysis employed ‘framework analysis’ as the primary method across strategic lead and young person interviews and site visits. This method is designed for organising and interpreting data systematically. It uses a matrix-based approach, where data is categorised into themes or frameworks to facilitate comparison and in-depth exploration.
With consent, researchers captured detailed notes during each interview and during site visits. Also with consent, all online interviews were recorded and reviewed to capture any additional notes. Following each interview and site visit, researchers added these notes to an analysis matrix created in Microsoft Excel. Once fieldwork was complete, researchers reviewed the analysis matrix to compare and identify key themes from across the interviews and site visits.
Separate analysis matrices were created for Year 1 and Year 2. During the evaluation, The Social Agency produced two internal interim reports for the Department for Culture, Media and Sport (DCMS) and NCST, one after Year 1 fieldwork was complete, and one at the end of Year 2 fieldwork. The final report collated and synthesised findings across both interim reports.
A note on interpretation and limitations
Qualitative research is illustrative, detailed and exploratory. It offers insights into the perceptions, feelings and behaviours of people (in this case NCS participants, staff and delivery partners) rather than quantifiable conclusions from a statistically representative sample. It is designed to support the wider quantitative findings delivered through the impact evaluation.
The new NCS programme model featured a much broader variety of activity, delivered by a wider range of delivery partners and providers, than previous iterations. The qualitative research conducted as part of the process evaluation was necessarily purposive and pragmatic in nature - i.e. targeted at those programmes where it was both practical and timely (in terms of enough programme activity having taken place) to visit and/or engage with relevant strategic leads. Whilst efforts were made to ensure a mix of programme activity was captured through the sampling approach, together with other criteria (e.g. ensuring we engaged with different sized delivery partners, across different content themes and had regional coverage), it has not been possible to capture the full range of programme activity that was delivered.
Only the residential service line collected sufficient participant data to recruit young people to take part in an interview post-experience. For community open to all service lines, it was only possible to engage with young people during their experience, during site visits. The process evaluation did not involve any primary research with young people taking part in community targeted and digital service lines. These service lines presented additional barriers to engaging young people, for example, due to the additional safeguarding needs of targeted cohorts, and logistical difficulties identifying and recruiting young people taking part in an online experience. Given these barriers, the decision was made to focus resources on engaging with young people in the residential and community open-to-all service lines.
Site visits provided an opportunity to conduct research with young people about their participation in NCS. While a useful source of learning for the evaluation, it was important young people’s experiences of NCS were not compromised as a result (for example, by taking them away from activities). Consequently, researchers had to be very flexible in how and when they engaged with young people during site visits, meaning data collection methods varied from visit to visit. For example, while in some cases it was possible to conduct short focus groups with young people, in others it was only possible to conduct short interviews while young people engaged in activities.
A2. Quantitative analysis
This section outlines key results from the follow-up survey of NCS residential and community open to all participants. This survey was primarily conducted for the purpose of the impact evaluation and as such, the fuller methodology for the survey is outlined in Annex B.
Process evaluation – survey tables
Table A.1 Attitudes towards NCS Experience (worthwhile)
| On a scale of 0 to 10, where 0 is not at all worthwhile and 10 is completely worthwhile, how worthwhile did you find your NCS experience overall? | Base: all treatment follow-up Residential respondents (n=2984) | Base: all treatment follow-up COTA respondents (n=300) |
|---|---|---|
| 0 to not at all worthwhile | 1% | 1.2% |
| 1 | 0.8% | 0.2% |
| 2 | 1.4% | 2.2% |
| 3 | 2% | 1.4% |
| 4 | 2% | 1.8% |
| 5 | 4.5% | 7.3% |
| 6 | 7.2% | 10.3% |
| 7 | 14.7% | 16.8% |
| 8 | 18.4% | 13.6% |
| 9 | 11.8% | 11.8% |
| 10 to completely worthwhile | 35.7% | 26% |
| Don’t know/prefer not to say | 0.6% | 7.5% |
| Net: 0 to 6 | 18.8% | 24.4% |
| Net: 7 to 9 | 44.9% | 42.2% |
| Net: 7 to 10 | 80.6% | 68.1% |
Table A.2 Attitudes towards NCS Experience (enjoyable)
| On a scale of 0 to 10, where 0 is not at all enjoyable and 10 is completely enjoyable, how enjoyable did you find your NCS experience overall? | Base: all treatment follow-up Residential respondents (n=2,984) | Base: all treatment follow-up COTA respondents (n=300) |
|---|---|---|
| 0 to not at all enjoyable | 0.7% | 1.2% |
| 1 | 0.7% | 0% |
| 2 | 1.2% | 1% |
| 3 | 1.2% | 1.3% |
| 4 | 1.4% | 2.7% |
| 5 | 3.8% | 3.1% |
| 6 | 7.2% | 8% |
| 7 | 13.4% | 20.2% |
| 8 | 19.1% | 17.7% |
| 9 | 16.1% | 11.9% |
| 10 to completely enjoyable | 34.5% | 24.1% |
| Don’t know/prefer not to say | 0.7% | 8.9% |
| Net: 0 to 6 | 16.2% | 17.2% |
| Net: 7 to 9 | 48.6% | 49.7% |
| Net: 7 to 10 | 83.1% | 73.9% |
Table A.3 Agreement with statements on NCS
To what extent do you agree or disagree with the following statements about your NCS experience?
| “I now feel more confident meeting new people” | Base: all treatment follow-up respondents completing RESI experience (n=2,984) | Base: all treatment follow-up respondents completing COTA experience (n=300) |
|---|---|---|
| Strongly agree | 26% | 27.3% |
| Agree | 47.4% | 36.8% |
| Neither agree nor disagree | 18.6% | 20.7% |
| Disagree | 4.8% | 5.4% |
| Strongly disagree | 1.8% | 2.9% |
| Don’t know/prefer not to say | 1.2% | 6.9% |
| Net: Agree | 73.7% | 64.1% |
| Net: Disagree | 6.5% | 8.3% |
| “I now feel more positive towards people with different backgrounds to myself” | Base: all treatment follow-up respondents completing RESI experience (n=2,984) | Base: all treatment follow-up respondents completing COTA experience (n=300) |
|---|---|---|
| Strongly agree | 27.4% | 28.9% |
| Agree | 38.4% | 38.1% |
| Neither agree nor disagree | 26.3% | 19.1% |
| Disagree | 3.9% | 4% |
| Strongly disagree | 1.8% | 2% |
| Don’t know/prefer not to say | 2.1% | 7.9% |
| Net: Agree | 65.8% | 67% |
| Net: Disagree | 5.7% | 6% |
| “I now feel more able to cope with whatever life throws at me” | Base: all treatment follow-up respondents completing RESI experience (n=2,984) | Base: all treatment follow-up respondents completing COTA experience (n=300) |
|---|---|---|
| Strongly agree | 17.6% | 20.4% |
| Agree | 38.8% | 39.8% |
| Neither agree nor disagree | 30.4% | 23.3% |
| Disagree | 8% | 6.6% |
| Strongly disagree | 3% | 2.7% |
| Don’t know/prefer not to say | 2.2% | 7.3% |
| Net: Agree | 56.5% | 60.2% |
| Net: Disagree | 11% | 9.2% |
| “I saw that there were more opportunities available to me than I had realised” | Base: all treatment follow-up respondents completing RESI experience (n=2,984) | Base: all treatment follow-up respondents completing COTA experience (n=300) |
|---|---|---|
| Strongly agree | 21.1% | 25.5% |
| Agree | 38.1% | 43.9% |
| Neither agree nor disagree | 27.5% | 17.6% |
| Disagree | 8.5% | 4.8% |
| Strongly disagree | 3.1% | 1.2% |
| Don’t know/prefer not to say | 1.6% | 7% |
| Net: Agree | 59.3% | 69.4% |
| Net: Disagree | 11.6% | 6% |
| “I now feel capable of more than I had realised” | Base: all treatment follow-up respondents completing RESI experience (n=2,984) | Base: all treatment follow-up respondents completing COTA experience (n=300) |
|---|---|---|
| Strongly agree | 20.2% | 18.1% |
| Agree | 42.8% | 47.5% |
| Neither agree nor disagree | 26.4% | 22.2% |
| Disagree | 6.2% | 4% |
| Strongly disagree | 2.8% | 1.2% |
| Don’t know/prefer not to say | 1.5% | 7% |
| Net: Agree | 63% | 65.6% |
| Net: Disagree | 9.1% | 5.2% |
| “I now feel more confident about getting a job in the future” | Base: all treatment follow-up respondents completing RESI experience (n=2,984) | Base: all treatment follow-up respondents completing COTA experience (n=300) |
|---|---|---|
| Strongly agree | 16.4% | 19.8% |
| Agree | 33% | 36.6% |
| Neither agree nor disagree | 36.3% | 29.6% |
| Disagree | 9.4% | 5.9% |
| Strongly disagree | 3.3% | 1.2% |
| Don’t know/prefer not to say | 1.6% | 6.9% |
| Net: Agree | 49.4% | 56.4% |
| Net: Disagree | 12.7% | 7.1% |
| “Participating in NCS has made me more likely to take part in volunteering and social action projects in the future” | Base: all treatment follow-up respondents completing RESI experience (n=2,984) | Base: all treatment follow-up respondents completing COTA experience (n=300) |
|---|---|---|
| Strongly agree | 22.8% | 22.1% |
| Agree | 39.6% | 40.8% |
| Neither agree nor disagree | 24.6% | 23.7% |
| Disagree | 8.4% | 5.7% |
| Strongly disagree | 3.1% | 1.1% |
| Don’t know/prefer not to say | 1.6% | 6.5% |
| Net: Agree | 62.4% | 63% |
| Net: Disagree | 11.5% | 6.8% |
Annex B: Impact Evaluation
Research questions for the impact evaluation included:
-
Did the programme achieve it’s intended outcomes?
-
Did the programme achieve it’s intended impacts?
-
To what extent did the new NCS model cause or contribute towards observed outcomes?
The total sample for Year 1 was 2,636 and 3,591 for Year 2. The treatment group included 2,984 participants of the NCS residential programme, and 300 for the COTA service line. The comparison group comprised of 2,949 young people completing both baseline and follow-up for each group.
The key timelines for the impact evaluation fieldwork are outlined below:
Year 1
-
Treatment: Surveys took place in batches, baseline surveys were conducted between June-December 2023, with follow-up surveys between April-July 2024.
-
Comparison: Baseline surveys were conducted in August -November 2023 with follow-up surveys between April – July 2024.
Year 2
-
Treatment: Baseline surveys were conducted between January-November 2024 in intervals, with follow-up surveys between September 2024-April 2025.
-
Comparison: Baseline survey was conducted between July-August 2024, with a follow-up survey in January 2025.
The impact evaluation methodology – from data collection to analysis - for the 2023-25 evaluation is similar to the design of the 2019 impact evaluation, with a few key differences noted in Table B.1.
Table B.1 Changes to impact evaluation methodology 2019-2023
| Change | Impact |
|---|---|
| Survey questionnaire design | For the 2023-25 evaluation, a revised, more focused, set of measures was developed between DCMS and NCST. Key measures from across the youth sector were added to standardise results between programmes and enable comparisons across the sector. An alternative more indirect formulation of questions was created around social cohesion. The questionnaire was shortened and cognitively tested to ensure it is accessible and young-person centric. |
| Method of baseline survey administration | The baseline survey for residential and community open to all (COTA) was administered by NCST, on the grounds that this would maintain consistency of brand as well as on the expectation that this would increase response rates. Response rates for residential were similar to the previous programme but lower for COTA. In an attempt to boost the COTA baseline response rate a QR code link was developed for each COTA lead provider to be distributed to participants and ease survey access. The QR code version of the COTA baseline ran from August-November 2024. Combined with a push from COTA providers, this did boost completions during that period. |
| Comparison sample | In 2019 the comparison sample was made up of people that had expressed an interest in participating but did not take part. In the 2023-25 design the comparison sample is drawn from the National Pupil Database, with respondents filtered out at the point of survey if they say they have taken part in NCS. The NPD sample is a broader group of young people who may therefore be less similar to NCS participants – however they are also less dissimilar in that they have not actively decided not to participate in NCS. |
| Coverage of NCS programme | The 2019 evaluation covered only the summer and not the autumn programmes, however the summer delivery comprised most participants. The 2023-25 impact evaluation covers only residential and COTA service lines. The 2019 model consisted only of residential programmes whilst the 2023-25 model is a three-service line approach. |
| Follow-up period | In the 2019 evaluation, the gap between baseline and follow-up was three months, in the 2023-25 evaluation the gap is designed to be six months. This extension to six months was made on the recommendations of an independent feasibility study and discussion with the evaluation steering group. The feasibility study concluded that a three-month gap between the baseline and follow-up survey is too soon for measuring long-term changes in certain indicators. Specifically, measures around changes in young people’s skills would be context-related and would not reflect lasting changes if measured too soon after participation in the NCS programme. Assessing the transfer of impact from the short to long term was recommended to require; ‘a much longer time frame between the surveys’. Hence a six-month follow-up for the new design. It was considered whether a later follow-up might miss outcomes that arose at three months and dissipated, however arguably lack of a sustained impact from 3-6 months is not a positive outcome or necessarily value for money. In Year 1, we tested the extent to which impact estimates vary across respondents who completed baseline in Autumn (shorter gap between baseline and follow-up) and in Summer (longer gap). This analysis revealed that the difference in the timing of the follow up do not generally influence the impact estimates. |
The evaluation design has evolved to ensure a best fit for changes in the programme delivery, and in line with feedback and strategic priorities provided by NCST and DCMS. The evaluation design has maintained a robust methodology. On this basis, any difference in findings between the two evaluations is more likely to be the effect of issues with implementation and data collection and/or the altered delivery model than they are differences in methodology.
B1. Survey methodology and weighting
The impact evaluation surveys were intended to cover two of the four NCS service lines: residential and community open to all (COTA). It was agreed with DCMS that the community targeted service lines would not be part of the impact surveys as the funding was used to boost existing cohorts rather than for a specific NCS offer. It was also agreed that the impact surveys would not be appropriate for the digital service line as it was not proportionate to the experiences themselves which were often short or light touch.
Baseline
The sample is made up of two groups: (1) NCS participants and the (2) comparison group.
NCS participants were initially surveyed via NCST online around two weeks prior to the start of their course (baseline survey). This means that, for residential participants, the survey was essentially rolling throughout the year, although most respondents took part in summer, followed by another spike in October (aligned to delivery). The only exclusions were young people aged under 16, or who were registered on more than one NCS activity and so had already received the survey invitation.
For the majority of the evaluation, when an individual registered (or was registered) for a COTA or residential experience in the NCST system (and if their start date was more than a week away) an email was automatically explaining how they could complete the survey. For residential, the initial email invitation was sent 21 days before start with 2 email reminders sent 14 days and 7 days before programme start date respectively. Young people were unable to complete the survey after the recorded start date for their NCS experience.
However, response rates to the baseline survey for the COTA service line (c.8%) meant that a range of approaches were attempted to boost response in Year 2. A £5 completion incentive was introduced at the start of Year 2, then a QR code link was developed for each COTA lead provider to be distributed to participants and ease survey access. The latter approach aimed to respond to advice from COTA providers that the previous approach was not well-suited to COTA as participants often did not often register in advance for provision but rather dropped in on an ad-hoc basis. The QR code version of the COTA baseline ran from August-November 2024 (extended from August-September due to low response). Combined with a push from COTA providers, completions did eventually reach over 1,000 during that period but means that most of the responses for COTA are from a restricted time period. This is unrepresentative of the year round nature of the service.
The comparison survey sample was selected from an extract of the National Pupil Database (NPD) which covered all young people in state schools in England who were in Year 11 in either the 2021/22 or 2022/23 academic year. These years correspond to the same ages as most young people registered for the NCS residential service line. Young people aged under 16 were excluded to be consistent with the survey of NCS participants.
The comparison baseline sample was designed to have a similar profile to NCS participants, based on information provided by NCST about which young people had registered for the residential service line. The NPD data was divided into 16 groups based on age (aged 16 or aged 17), gender (male or female), and ethnicity (white, black, Asian, or any other ethnicity recorded). Within each group, the NPD data was sorted by school year and geography (Lower Super Output Area) before a random systematic sample was drawn from each group. This ensured the sample was spread geographically around the country. The number sampled within each group was chosen so that the sample would have a similar profile to the young people registered for NCS. Sampled young people were contacted by letter, inviting them to complete the baseline survey online. A £5 incentive was offered to young people for completing the survey.
The comparison survey was administered in batches, administered in line with intended residential/COTA delivery. In Year 1 it ran in August/September 2024 (batch 1) and November 2024 (batch 2). In Year 2, a survey was intended to run in spring 2024 but was prevented from doing so by restrictions around government research during the general election, as such there was only one comparison survey baseline in July and August 2024.
Follow-up
Respondents were contacted by email and letter asking them to complete the survey online. In Year 1 respondents were offered a £5 incentive for taking part, in Year 2 this was increased to £10. Up to three reminders were sent, using a combination of emails and letters to encourage participation. There was a decision to design a gap of 6 months between the baseline and follow-up surveys (see Table A.1). However, in practice, the gaps range from 4- 9 months, as explained below.
In Year 1 delays with data sharing and receipt of sample meant that the participant follow-up period was later than envisaged. Some comparison cases for batch 2 were issued for the follow-up at an earlier stage than planned, with additional sample coming onstream earlier than intended due to lower overall sample sizes and slightly lower initial response rates. In Year 2, the residential participant and counterfactual follow-up ran quarterly ensuring that the follow-up period was as planned. For residential and the counterfactual (average 5.7 months) and for COTA (6.4 months).
To account for these differences in follow-up periods, Verian included a binary variable for gap as a predictor in the Propensity Score Matching (PSM) model, meaning that any variation in the timing between baseline and follow-up completion is explicitly controlled for in the impact estimates. This helps ensure that differences in outcomes are not confounded by differences in follow-up timings.
Sample size and response
In Year 1, 2,625 baseline responses were collected from NCS participants. The vast majority of these are from the residential service line. Due to the way in which the COTA service line was delivered to participants (i.e. a less formal registration process than residential), fewer than expected COTA participants were invited to take part in the baseline survey. Therefore, only a small number of responses (38) were from the community open to all service line, the remainder were Residential (2,587). Of those, 1,211 Residential participants and 15 COTA participants completed follow-up.
For the comparison sample, 3,545 responses were collected from young people at the baseline. Of those, 1,410 went on to complete the follow-up survey.
Table B.2 Survey response volume and rate
| Participants | Comparison (batch 1) | Comparison (batch 2) | |
|---|---|---|---|
| Invited to baseline survey | 13,135 | 10,000 | 3,250 |
| Responded to baseline survey | 2,625 | 2,552 | 993 |
| (% of those invited) | (19.7%) | (25.5%) | (30.6%) |
| Responded to follow-up survey | 1,226 | 1,013 | 397 |
| (% of those responding to baseline) | (46.8%) | (39.7%) | (40.0%) |
In Year 2, Verian collected 5,547 baseline responses from NCS participants, including 4,124 from the residential service and 1,423 from COTA. Of these, 1,773 residential participants and 285 COTA participants completed the follow-up survey. For the comparison sample in Year 2, 5,204 responses were collected from young people at the baseline. Of those, 1,539 completed the follow-up survey. Table B.3 shows the breakdown of sample size and response rates. We have not included those invited to the baseline survey as due to the COTA QR administration method, that figure is not meaningful.
Table B.3 Survey response volume and rate
| Participants (batch 3) | Participants (batch 4) | Participants (batch 5) | Participants (batch 6) | Comparison | |
|---|---|---|---|---|---|
| Responded to baseline survey | 601 | 604 | 3,060 | 1,282 | 5,204 |
| Responded to follow-up survey | 195 | 256 | 1,325 | 282 | 1,539 |
| (% of those responding to baseline) | (32.4%) | (42.4%) | (43.3%) | (21.9%) | (29.6%) |
Weighting the participant sample
There are two weights for cases in the NCS participant sample: (1) a baseline weight for all NCS participants who completed the baseline, and (2) a follow-up weight for those who went on to complete the follow-up survey. The first weight is intended to account for initial non-response (i.e. young people who took part in the baseline survey were different in various ways to those who did not). The second weight is intended to additionally account for attrition (i.e. the young people who went on to complete the follow-up survey are different in various ways to those who dropped out of the study).
Wave 1 weight
In Year 1, NCST provided information about the profile of participants on the residential service line in 2023. We initially weighted the profile of the NCS participant sample to match the profile of all residential service line participants with respect to: gender (as recorded on the NCS new joiner form), age, ethnicity, and free school meals (FSM). This weighting uses Iterative Proportional Fitting, sometimes called ‘raking’, which involves iteratively weighting different sub-groups to match the profile variables in turn, until the weighted profile of the sample matches well on all variables at once.
For Year 2, we used the 2024/25 participant profile to weight the Residential line and the COTA line separately.
Wave 2 weight
An additional weight was needed for the follow-up survey to account for the fact that different types of baseline respondents were more or less likely to complete the follow-up.
To create this weight, we used a logistic Least Absolute Shrinkage and Selection Operator (LASSO) regression to predict the probability of completing the follow-up survey based on:
-
demographic variables (gender, age, ethnicity, FSM, special educational needs, disability status, sexual orientation)
-
information about the areas in which respondents live (rural/urban classification, deprivation, whether in an NCS priority area). In Year 2, we excluded deprivation and rural/urban from the LASSO regression due to missing postcode data in approximately 6.5% of cases (primarily among COTA participants).
-
outcomes recorded in the baseline survey (e.g. attitudes, behaviours, volunteering, wellbeing etc.). As these were recorded before treatment (i.e. before the young person’s NCS programme started), it is reasonable to use these in the impact analysis.
A LASSO regression is a type of statistical model that assigns different levels of importance to predictor variables based on how well they predict an outcome. In this case, the outcome is whether or not the respondent completed the follow-up survey. Verian used a form of cross-validation to tune the model. This involves building the model on a subset of the data and using it to predict the outcome for the remaining part of the data. This helps to find a form of the model which is most reliable.
The output of this model is a predicted probability for each respondent that they would complete the follow-up survey. The Wave 2 weight is based on the inverse of this predicted probability (i.e. 1 divided by the predicted probability). Types of respondent with a low predicted probability are relatively under-represented in the follow-up data and this method ensures they are weighted up appropriately. Similarly, types of respondent with a high predicted probability are relatively over-represented and so are given lower weight.
As a final step, this weight was calibrated by repeating the Iterative Proportional Fitting algorithm described above. This ensures that the final Wave 2 weight brings the profile of the follow-up participant sample in line with the profile of NCS residential participants.
Table B.4 shows the unweighted and weighted profiles of the Year 1 participant sample at both the baseline and follow-up surveys, and how this compares to the profile of NCS participants (based on figures provided by NCST).
Table B.4 Year 1 participant survey sample profiles
| Gender | Population (residential service line) | Baseline (W1 weight) Unweighted |
Baseline (W1 weight) Weighted |
Follow-up (W2 weight) Unweighted |
Follow-up (W2 weight) Weighted |
|---|---|---|---|---|---|
| Female | 42.64% | 66.50% | 42.60% | 69.00% | 42.60% |
| Male | 54.01% | 29.40% | 54.00% | 27.00% | 54.00% |
| Any other answer | 3.35% | 4.20% | 3.40% | 4.00% | 3.40% |
| Age at the start of programme | Population (residential service line) | Baseline (W1 weight) Unweighted |
Baseline (W1 weight) Weighted |
Follow-up (W2 weight) Unweighted |
Follow-up (W2 weight) Weighted |
|---|---|---|---|---|---|
| 16 or under[footnote 1] | 82.68% | 87.6% | 82.7% | 89.6% | 82.7% |
| 17 or above | 17.32% | 12.4% | 17.3% | 10.4% | 17.3% |
| Ethnicity | Population (residential service line) | Baseline (W1 weight) Unweighted |
Baseline (W1 weight) Weighted |
Follow-up (W2 weight) Unweighted |
Follow-up (W2 weight) Weighted |
|---|---|---|---|---|---|
| White | 54.93% | 52.2% | 54.9% | 53.0% | 54.9% |
| Asian | 10.64% | 23.5% | 22.1% | 24.4% | 22.1% |
| Black | 22.09% | 14.1% | 10.7% | 14.1% | 10.7% |
| Mixed | 7.14% | 6.5% | 7.1% | 5.4% | 7.1% |
| Any other answer | 5.20% | 3.7% | 5.2% | 3.1% | 5.2% |
| Free school meals | Population (residential service line) | Baseline (W1 weight) Unweighted |
Baseline (W1 weight) Weighted |
Follow-up (W2 weight) Unweighted |
Follow-up (W2 weight) Weighted |
|---|---|---|---|---|---|
| Recorded as eligible for/receiving FSM | 24.97% | 29.5% | 24.9% | 26.6% | 24.9% |
| Not recorded as eligible for/receiving FSM | 75.03% | 70.5% | 75.1% | 73.4% | 75.1% |
Table B.5 shows the weighted and unweighted profile of the Residential sample at both the baseline and follow-up surveys, and how this compares to the 2024 profile of NCS participants (based on figures provided by NCST ).
Table B.5 Year 2 participant survey sample profiles
| Gender | Population (residential service line) | Baseline (W1 weight)[footnote 2] Unweighted |
Baseline (W1 weight) Weighted |
Follow-up (W2 weight) Unweighted |
Follow-up (W2 weight) Weighted |
|---|---|---|---|---|---|
| Male | 38.84% | 28.21% | 38.84% | 27.52% | 38.84% |
| Female | 55.47% | 68.55% | 55.47% | 69.08% | 55.47% |
| Any other answer | 5.69% | 3.25% | 5.69% | 3.39% | 5.69% |
| Age at the start of programme | Population (residential service line) | Baseline (W1 weight) Unweighted |
Baseline (W1 weight) Weighted |
Follow-up (W2 weight) Unweighted |
Follow-up (W2 weight) Weighted |
|---|---|---|---|---|---|
| 16 years old | 62.78% | 82.95% | 62.78% | 85.16% | 63.43% |
| 17 or above | 35.77% | 16.59% | 35.77% | 14.55% | 36.00% |
| Any other answer | 1.45% | 0.46% | 1.45% | 0.28% | 0.57% |
| Ethnicity | Population (residential service line) | Baseline (W1 weight) Unweighted |
Baseline (W1 weight) Weighted |
Follow-up (W2 weight) Unweighted |
Follow-up (W2 weight) Weighted |
|---|---|---|---|---|---|
| White | 60.0% | 56.81% | 60.0% | 56.91% | 60.0% |
| Asian | 16.16% | 18.65% | 16.16% | 19.06% | 16.16% |
| Black | 9.81% | 14.23% | 9.81% | 13.76% | 9.81% |
| Mixed | 6.98% | 6.98% | 6.98% | 7.44% | 6.98% |
| Any other answer | 7.05% | 3.32% | 7.05% | 2.82% | 7.05% |
| Free school meals | Population (residential service line) | Baseline (W1 weight) Unweighted |
Baseline (W1 weight) Weighted |
Follow-up (W2 weight) Unweighted |
Follow-up (W2 weight) Weighted |
|---|---|---|---|---|---|
| Recorded as eligible for/receiving FSM | 25.65% | 29.03% | 25.65% | 29.44% | 25.65% |
| Not recorded as eligible for/receiving FSM | 74.35% | 70.97% | 74.35% | 70.56% | 74.35% |
Weighting the comparison group
The types of young people taking part in NCS will be different to some degree from the types of young people in the comparison group. To make the impact analysis robust as possible, it is important to try to account for these differences. The impact analysis used a form of PSM to create weights for the comparison group to adjust for differences between the participant and comparison groups.
The PSM was conducted separately for male and female residential respondents. This is to be consistent with the value for money analysis which uses figures split by gender. Doing the PSM separately by gender will help make these sub-group analyses more robust by making sure the treatment and comparison groups are reasonably well balanced within gender, and across the sample as a whole.
The first step was to fit another logistic LASSO regression. This time, the outcome for the model was a variable indicating whether a respondent is an NCS participant or part of the comparison group. The set of predictors was the same as the regression model used to derive the participant weights (described above), with the exception of sexual orientation (which was not included in the comparison group survey) and gender (as the PSM is already separated by gender, there is no need to include this variable in the regression model). Due to the smaller COTA sample, Verian did not produce separate weights by gender, but gender was included as a predictor in the PSM.
The output of this regression model is a predicted Propensity Score. This is the predicted probability of a respondent being in the participant group as opposed to the comparison group. Individuals with similar characteristics will have similar Propensity Scores.
The impact analysis then used a kernel PSM algorithm to derive the matching weights for the comparison group. This involves giving more weight to respondents in the comparison group who have a high Propensity Score as these respondents tend to have characteristics which are common in the participant sample. Similarly, the algorithm gives lower weight to the respondents in the comparison group with a low Propensity Score, as they tend to have characteristics which are relatively uncommon in the participant sample. In general, it is possible to match groups more closely at the cost of some loss of statistical precision (i.e. greater uncertainty in the findings). Therefore, it is important to find a good balance of a reasonably close match (that is, relatively small baseline differences between the participant and comparison groups) and reasonably good statistical precision. The evaluators repeated the matching algorithm with three different kernel bandwidths. They also tried variations of the initial regression model to estimate the Propensity Score, removing some variables where the differences between the participant and comparison groups were already fairly small.
The evaluators compared the weighted profiles of the participant and comparison groups across all the variables collected in the baseline survey as well as administrative variables such as rural/urban classification, deprivation, and time of year the survey was conducted. They then selected a matching solution which provided reasonable balance between the participant and comparison groups with acceptable statistical precision.
Tables B.6 and B.7 outline some key differences between the treatment and comparison groups before and after applying the PSM. Although some differences remain, the gaps have shrunk considerably, which give more confidence in the findings of the impact analysis.
Assessing the risk due to differences in the timing of surveys
The gap between the baseline and follow-up surveys varied from four to nine months depending on a number of factors including: when a young person took part in NCS, and whether a young person in the comparison group was part of the first or second comparison sample batch. It is possible that these different timings have influenced the findings of the impact evaluation to some degree.
In Year 1, Verian tested for this in two ways. First, the sample was divided into two given the date respondents completed the baseline survey (responses before and after the end of September 2024). These groups correspond to the two main spikes in NCS participation and the two comparison sample batches. The evaluators then investigated the extent to which the impact estimates differed between these two groups. There was little evidence of a systematic difference between the groups. For example, the average difference on the estimated impacts for standardised summary measures between the two groups was 0.01.
Second, the evaluators investigated the extent to which the impact estimates varied based on the number of days between a respondent completed their baseline and follow-up surveys. Again, there was little evidence of a systematic difference for respondents with a longer or shorter gap between baseline and follow-up.
In Year 2, this was addressed in two ways. Firstly, by adding an extra variable in the PSM regression to create weights for the comparison group. This variable indicates whether a respondent had a gap between baseline and follow-up of ‘5 or less months’ or ‘6 or more months’. Secondly, for the COTA analysis we i) included Year 1 comparison cases that completed baseline at the end of 2023 in the PSM, and ii) split the sample into two given the date respondents completed the baseline survey (responses before and after April 2024).
Table B.6 Key differences between treatment and comparison groups in Year 1, before and after applying the PSM
| Gender | Baseline: Unweighted: Treatment | Baseline: Unweighted: Comparison | Baseline: Weighted: Treatment | Baseline: Weighted: Comparison | Follow-up: Unweighted: Treatment | Follow-up: Unweighted: Comparison | Follow-up: Weighted: Treatment | Follow-up: Weighted: Comparison |
|---|---|---|---|---|---|---|---|---|
| Male | 29.5% | 32.0% | 27.0% | 28.2% | 27.1% | 28.2% | 27.0% | 28.2% |
| Female | 66.3% | 63.8% | 69.0% | 66.8% | 68.8% | 66.8% | 69.0% | 66.8% |
| Any other answer | 4.2% | 4.3% | 4.0% | 5.0% | 4.1% | 5.0% | 4.0% | 5.0% |
| Age | Baseline: Unweighted: Treatment | Baseline: Unweighted: Comparison | Baseline: Weighted: Treatment | Baseline: Weighted: Comparison | Follow-up: Unweighted: Treatment | Follow-up: Unweighted: Comparison | Follow-up: Weighted: Treatment | Follow-up: Weighted: Comparison |
|---|---|---|---|---|---|---|---|---|
| 16 years old | 86.7% | 80.7% | 89.1% | 82.1% | 88.4% | 82.1% | 89.1% | 82.1% |
| 17 years old | 12.5% | 18.0% | 10.2% | 17.2% | 10.7% | 17.2% | 10.2% | 17.2% |
| 18 years old or over | 0.4% | 0.2% | 0.2% | 0.1% | 0.4% | 0.1% | 0.2% | 0.1% |
| Prefer not to say | 0.4% | 1.0% | 0.5% | 0.6% | 0.5% | 0.6% | 0.5% | 0.6% |
| Ethnicity | Baseline: Unweighted: Treatment | Baseline: Unweighted: Comparison | Baseline: Weighted: Treatment | Baseline: Weighted: Comparison | Follow-up: Unweighted: Treatment | Follow-up: Unweighted: Comparison | Follow-up: Weighted: Treatment | Follow-up: Weighted: Comparison |
|---|---|---|---|---|---|---|---|---|
| White | 52.5% | 54.1% | 53.0% | 51.0% | 53.0% | 51.0% | 53.0% | 51.0% |
| Asian | 23.3% | 25.0% | 24.4% | 27.7% | 24.3% | 27.7% | 24.4% | 27.7% |
| Black | 14.0% | 11.1% | 14.1% | 11.6% | 14.2% | 11.6% | 14.1% | 11.6% |
| Mixed | 6.4% | 6.8% | 5.4% | 7.0% | 5.3% | 7.0% | 5.4% | 7.0% |
| Any other answer | 1.9% | No data | 1.7% | No data | 1.7% | No data | 1.7% | No data |
| Free school meals | Baseline: Unweighted: Treatment | Baseline: Unweighted: Comparison | Baseline: Weighted: Treatment | Baseline: Weighted: Comparison | Follow-up: Unweighted: Treatment | Follow-up: Unweighted: Comparison | Follow-up: Weighted: Treatment | Follow-up: Weighted: Comparison |
|---|---|---|---|---|---|---|---|---|
| Recorded as eligible for/receiving FMS | 29.6% | 21.5% | 26.6% | 21.3% | 26.9% | 21.3% | 26.6% | 21.3% |
| Not recorded as eligible for/receiving FSM | 70.4%% | 78.5% | 73.4% | 78.7% | 73.1% | 78.7% | 73.4% | 78.7% |
Table B.7 Key differences between Residential treatment and comparison groups in Year 2, before and after applying the PSM
| Gender | Baseline: Unweighted[footnote 3]: Treatment | Baseline: Unweighted: Comparison | Baseline: Weighted: Treatment | Baseline: Weighted: Comparison | Follow-up: Unweighted: Treatment | Follow-up: Unweighted: Comparison | Follow-up: Weighted: Treatment | Follow-up: Weighted: Comparison | |||
|---|---|---|---|---|---|---|---|---|---|---|---|
| Male | 28.2% | 34.2% | 3.8% | 40.1% | 25.9% | 30.5% | 38.8% | 40.1% | |||
| Female | 68.6% | 62.5% | 55.5% | 57.1% | 70.3% | 66.7% | 55.5% | 57.1% | |||
| Any other answer | 3.3% | 3.3% | 5.7% | 2.8% | 3.7% | 2.9% | 5.7% | 2.8% |
| Age | Baseline: Unweighted[footnote 3]: Treatment | Baseline: Unweighted: Comparison | Baseline: Weighted: Treatment | Baseline: Weighted: Comparison | Follow-up: Unweighted: Treatment | Follow-up: Unweighted: Comparison | Follow-up: Weighted: Treatment | Follow-up: Weighted: Comparison | |||
|---|---|---|---|---|---|---|---|---|---|---|---|
| 16 years old | 82.9% | 77.8% | 63.4% | 67.8% | 85.2% | 77.5% | 63.4% | 67.8% | |||
| 17 years old or above | 16.6% | 21.2% | 36.0% | 30.1% | 14.6% | 22.2% | 36.0% | 30.1% | |||
| Prefer not to say | 0.5% | 1.0% | 0.6% | 2.1% | 0.3% | 0.4% | 0.6% | 2.1% |
| Ethnicity | Baseline: Unweighted[footnote 3]: Treatment | Baseline: Unweighted: Comparison | Baseline: Weighted: Treatment | Baseline: Weighted: Comparison | Follow-up: Unweighted: Treatment | Follow-up: Unweighted: Comparison | Follow-up: Weighted: Treatment | Follow-up: Weighted: Comparison | |||
|---|---|---|---|---|---|---|---|---|---|---|---|
| White | 56.8% | 56.4% | 60.0% | 59.8% | 56.9% | 59.2% | 60.0% | 59.8% | |||
| Asian | 18.7% | 23.6% | 16.2% | 18.8% | 19.1% | 23.3% | 16.2% | 18.8% | |||
| Black | 14.2% | 11.0% | 9.8% | 10.1% | 13.8% | 10.4% | 9.8% | 10.1% | |||
| Mixed | 6.9% | 6.1% | 6.9% | 6.5% | 7.5% | 5.3% | 6.9% | 6.5% | |||
| Any other answer | 3.3% | 2.9% | 7.0% | 4.8% | 2.8% | 1.9% | 7.0% | 4.8% |
| Free school meals | Baseline: Unweighted[footnote 3]: Treatment | Baseline: Unweighted: Comparison | Baseline: Weighted: Treatment | Baseline: Weighted: Comparison | Follow-up: Unweighted: Treatment | Follow-up: Unweighted: Comparison | Follow-up: Weighted: Treatment | Follow-up: Weighted: Comparison | |||
|---|---|---|---|---|---|---|---|---|---|---|---|
| Recorded as eligible for/receiving FMS | 29.1% | 22.2% | 25.7% | 23.1% | 29.4 | 21.4% | 25.7% | 23.1% | |||
| Not recorded as eligible for/receiving FSM | 70.9% | 77.8% | 74.3% | 76.9% | 70.6% | 78.6% | 74.3% | 76.9% |
These analytical choices were made before working with the follow-up survey data. This means these choices were not influenced by whether they led to more or less favourable results in the impact analysis. After conducting the impact evaluation, Verian repeated the analysis with different matching solutions to test how sensitive the findings are to these choices. The results were similar, indicating that the findings are robust to different analytical choices being made in the matching process.
Weighting COTA participants
Across Year 1 and Year 2, Verian collected 1,462 responses from the COTA line. Of these, 300 participants completed the follow-up survey (20.5%). For the comparison sample, the evaluators used 397 comparison cases from Year 1 who completed baseline in November 2023, and all comparison cases from Year 2 that completed the follow-up survey (1,539). Table B.8 shows the breakdown of sample size and response rates by year.
Table B.8 Survey response volume and rate
| COTA participants Year 1 | COTA participants Year 2 | |
|---|---|---|
| Responded to baseline survey | 38 | 1,423 |
| Responded to follow-up survey | 15 | 285 |
| (% of those responding to baseline) | (39.5%) | (20.0%) |
Similarly to residential participants, Verian calculated: (1) a baseline weight for all COTA participants who completed the baseline, and (2) a follow-up weight for those who went on to complete the follow-up survey. The first weight (W1 weight) was used to match the profile of all COTA service line participants with respect to: gender (as recorded on the NCS new joiner form), ethnicity, and FSM status. The second weight (W2 weight) used outcomes recorded in the baseline survey (e.g. attitudes, behaviours, volunteering, wellbeing etc.).
Table B.9 Year 1 and Year 2 COTA participant survey sample profiles
| Gender | Population (COTA service line) | Baseline (W1 weight)[footnote 4] Unweighted | Baseline (W1 weight) Weighted | Follow-up (W2 weight)[footnote 5] Unweighted | Follow-up (W2 weight) Weighted |
|---|---|---|---|---|---|
| Male | 52.4% | 43.7% | 52.4% | 37.3% | 52.4% |
| Female | 42.4% | 51.1% | 42.4% | 60.3% | 42.4% |
| Any other answer | 5.2% | 5.2% | 5.2% | 2.3% | 5.2% |
| Age at start of programme[footnote 6] | Population (COTA service line) | Baseline (W1 weight)[footnote 4] Unweighted | Baseline (W1 weight) Weighted | Follow-up (W2 weight)[footnote 5] Unweighted | Follow-up (W2 weight) Weighted |
|---|---|---|---|---|---|
| 16 years old | NA | 62.4% | No data | 59.7% | No data |
| 17 or above | NA | 34.8% | No data | 37.7% | No data |
| Any other answer | NA | 2.6% | No data | 2.7% | No data |
| Ethnicity | Population (COTA service line) | Baseline (W1 weight)[footnote 4] Unweighted | Baseline (W1 weight) Weighted | Follow-up (W2 weight)[footnote 5] Unweighted | Follow-up (W2 weight) Weighted |
|---|---|---|---|---|---|
| White | 54.6% | 67.8% | No data | No data | No data |
| Asian | 8.9% | 13.8% | 8.9% | 19.7% | 8.8% |
| Black | 6.0% | 7.6% | 6.0% | 8.0% | 6.0% |
| Mixed | 4.1% | 5.6% | 4.1% | 5.7% | 4.2% |
| White + any other answer[footnote 7] | 80.9% | 72.9% | 80.9% | 66.7% | 80.9% |
| Free school meals | Population (COTA service line) | Baseline (W1 weight)[footnote 4] Unweighted | Baseline (W1 weight) Weighted | Follow-up (W2 weight)[footnote 5] Unweighted | Follow-up (W2 weight) Weighted |
|---|---|---|---|---|---|
| Recorded as eligible for/receiving FSM | 21.9% | 27.7% | 21.9% | 30% | 21.5% |
| Not recorded as eligible for/receiving FSM | 78.1% | 72.3% | 78.1% | 70% | 78.5% |
Table B.10 Key differences between COTA treatment and comparison groups in Years 1 and 2, before and after applying the PSM
| Gender | Baseline: Unweighted[footnote 8]: Treatment | Baseline: Unweighted :Comparison | Baseline: Weighted: Treatment | Baseline: Weighted: Comparison | Follow-up: Unweighted: Treatment | Follow-up: Unweighted: Comparison | Follow-up: Weighted: Treatment | Follow-up: Weighted: Comparison |
|---|---|---|---|---|---|---|---|---|
| Male | 43.7% | 33.7% | 52.4% | 42.3% | 37.3% | 30.1% | 52.4% | 42.3% |
| Female | 51.1% | 62.7% | 42.4% | 51.7% | 60.3% | 66.4% | 42.4% | 51.7% |
| Any other answer | 5.2% | 3.5% | 5.2% | 6.0% | 2.3% | 3.5% | 5.2% | 6.0% |
| Ethnicity | Baseline: Unweighted[footnote 8]: Treatment | Baseline: Unweighted :Comparison | Baseline: Weighted: Treatment | Baseline: Weighted: Comparison | Follow-up: Unweighted: Treatment | Follow-up: Unweighted: Comparison | Follow-up: Weighted: Treatment | Follow-up: Weighted: Comparison |
|---|---|---|---|---|---|---|---|---|
| Asian | 13.8% | 24.0% | 8.8% | 12.7% | 19.7% | 24.6% | 8.8% | 12.7% |
| Black | 7.6% | 11.1% | 6.0% | 6.0% | 8.0% | 10.7% | 6.0% | 6.0% |
| Mixed | 5.6% | 6.1% | 4.2% | 5.2% | 5.7% | 5.7% | 4.2% | 5.2% |
| White + any other answer | 72.9% | 58.8% | 80.9% | 76.1% | 66.7% | 58.9% | 80.9% | 76.1% |
| Free school meals | Baseline: Unweighted[footnote 8]: Treatment | Baseline: Unweighted :Comparison | Baseline: Weighted: Treatment | Baseline: Weighted: Comparison | Follow-up: Unweighted: Treatment | Follow-up: Unweighted: Comparison | Follow-up: Weighted: Treatment | Follow-up: Weighted: Comparison |
|---|---|---|---|---|---|---|---|---|
| Recorded as eligible for/receiving FMS | 27.7% | 22.1% | 21.5% | 21.8% | 30.0% | 21.2% | 21.5% | 21.8% |
| Not recorded as eligible for/receiving FSM | 72.3% | 77.9% | 78.5% | 78.2% | 70.0% | 78.8% | 78.5% | 78.2% |
B2: Summary outcome measures
The theory of change formed the foundation for designing the outcomes to be measured through the survey. In collaboration with NCST, the questionnaire was developed by mapping validated survey questions (taken mainly from the Kantar Review 2020 and Feasibility Study 2022) onto the theory of change. This exercise helped to assess which outcomes and measures should be prioritised and whether the measures are the most suitable to assess distance travelled towards NCS outcomes and impacts. Non-validated questions were taken through two consecutive rounds of cognitive testing.
Given the large number of outcome measures, the impact analysis focuses on summary outcomes. These summary outcomes were defined as the average (mean) response across a set of questions. For example, a respondent’s summary outcome for “Listening and Speaking” was the mean of their answers for “I am able to explain my ideas clearly”, “I feel confident speaking in public”, “I find it hard to express myself to others”, and “I find it hard to speak up in a group I don’t know well”. In this case, the scale for the final two questions was reversed so that a higher number always represents a more positive outcome. A small number of respondents did not give an answer to all four of these questions. These respondents were excluded from the impact analysis for this outcome. Tables B.11 to 15 describe which survey questions were used within each summary outcome.
Table B.11 Life skills and independent living summary measures
Q1. On a scale of 0 to 10 where 0 is ‘not at all like me’ and 10 is ‘very much like me’, how well do each of the following statements describe you?
| N | Statement label | Summary outcome measure |
|---|---|---|
| 1 | I feel confident when meeting new people | Teamwork A |
| 2 | I find it difficult to work with people if they have different ideas or opinions to me | Teamwork |
| 3 | I like being the leader of a team | Leadership |
| 4 | I am able to explain my ideas clearly | Listening & speaking |
| 5 | I try to see things from other people’s viewpoints | Teamwork A |
| 6 | I feel confident speaking in public | Listening & speaking |
| 7 | I find it hard to express myself to others | Listening & speaking |
| 8 | I find it hard to speak up in a group of people I don’t know well | Listening & speaking |
| 9 | I like coming up with new ideas for ways to do things | Creativity |
| 10 | I feel confident about having a go at something new | Creativity |
Q2. Please look at the statements below and say how much they apply to you. [Never, rarely, sometimes, often always]
| N | Statement label | Summary outcome measure |
|---|---|---|
| 1 | I bounce back quickly from bad experiences | Emotion mgmt./resilience |
| 2 | I understand how people close to me feel | Empathy |
| 3 | It is easy for me to feel what other people are feeling | Empathy |
| 4 | I seek help from others when I need it | Teamwork B |
| 5 | I go out of my way to help others | Teamwork B |
| 6 | I remind people to do their part | Teamwork B |
| 7 | People can count on me to get my part done | Responsibility |
| 8 | I do the things that I say I am going to do | Responsibility |
| 9 | I take responsibility for my actions, even if I make a mistake | Responsibility |
| 10 | I do my best when an adult asks me to do something | Responsibility |
| 11 | I give up when things get difficult | Initiative/resilience |
| 12 | I work as long and hard as necessary to get a job done | Initiative/resilience |
| 13 | I start a new task by brainstorming lots of ideas about how to do it | Problem-solving |
| 14 | I make step-by-step plans to reach my goals | Problem-solving |
| 15 | I make alternative plans for reaching my goals when things don’t work out | Problem-solving/resilience |
| 16 | I am good at managing time when I have to meet a deadline | Problem-solving |
Table B.12 Future prospects and work readiness summary measures
Survey questions (baseline and follow-up surveys): Q10. On a scale of 0 to 10 where 0 is ‘not at all like me’ and 10 is ‘very much like me’, how well do each of the following statements describe you?
Summary measure(s): Future transitions: Attitudes (q10) Positivity B (q10, codes 3 and 4)
| N | Statement label |
|---|---|
| 1 | I feel optimistic about my future |
| 2 | I value the opinions of those around me in helping shape my future goals |
| 3 | I feel positive about my chances of getting a job in the future |
| 4 | I feel confident that I will have the skills and experience to get a job in the future |
Survey questions (baseline and follow-up surveys): Q12. How much do you agree with the following statements? [Strongly agree, agree, neither agree nor disagree, disagree, strongly disagree]
Summary measure(s): Positivity about work/career transitions (q12)
| N | Statement label |
|---|---|
| 1 | I can choose a career that fits with my interests. |
| 2 | I can decide what my ideal job would be |
| 3 | I can choose a career that will allow me to live the life that I want to lead |
| 4 | I can assess my strengths and weaknesses |
| 5 | I will continue to work at my studies even when I get frustrated |
| 6 | I can choose a career that fits with what I am good at |
| 7 | I can work well with different sorts of people |
Survey questions (baseline and follow-up surveys): Q11. Thinking ahead to the future, which of the following would you consider doing between the ages of 18 and 21?
Summary measure(s): Future transitions: Consider higher education (q11); Future transitions: Consider further education (q11); Future transitions: Consider apprenticeship (q11)
| N | Multi-code option |
|---|---|
| 1 | Paid work (full-time or part-time) |
| 2 | Further Education in a (FE) College (e.g. T Levels, BTECs and other vocational training) |
| 3 | University of Higher Education (i.e. undergraduate degree, including Degree apprenticeship, Higher National Certificate (HNCs), Higher National Diploma (HNDs) |
| 4 | Apprenticeship |
| 5 | Traineeship (i.e. a skills development programme that includes a work placement) or internship (i.e. working in an organisation to gain work experience) |
| 6 | Go travelling/take a break from work or study |
| 7 | Take part in a full-time volunteer programme (in the UK or overseas) |
| 8 | Any other type of training |
| 9 | Something else (please specify) |
| 10 | Not sure/haven’t decided yet |
| 999 | Prefer not to say [FIXED, EXCLUSIVE] |
Table B.13 Social action summary measures
Survey questions (baseline and follow-up surveys): Q5. On a scale of 0 to 10, where 0 is not at all important and 10 is very important, how important are each of the following to you personally?
Summary measure(s): Civic engagement (q05)
| N | Statement label |
|---|---|
| 1 | To know about issues affecting my community |
| 2 | To know about issues affecting people in this country |
| 3 | To know about how to make a difference in my community if I wanted to |
| 4 | To vote in national elections or referendums when I am old enough |
| 5 | To help people in my community who need support |
| 6 | To feel confident that my voice is being heard by the people who make decisions in my community |
Survey questions (baseline and follow-up surveys): Q6. In the last 6 months, have you volunteered or helped anyone (unpaid) in any of these ways? Please select all that apply.
Q7. Thinking about the ways that you have volunteered or helped anyone (unpaid), approximately how many hours in total have you spent doing those activities in the last 6 weeks? Please type in the number of hours.
Summary measure(s): Types of volunteering (q06), hours of volunteering (q07), involvement in volunteering and social action (q06), time spent volunteering and social action (q07).
Table B.14 Social cohesion summary measures
Survey questions (baseline and follow-up surveys): Q8. How well does each of the following statements below describe you? [Very much like me, mostly, somewhat, not much, not at all]
Summary measure(s): Social mix A
| N | Statement label |
|---|---|
| 1 | I treat all people with respect regardless of their background |
| 2 | I respect the views of others |
| 3 | I feel bad when somebody is treated unfairly |
| 4 | I find it difficult working with people who have different backgrounds to me |
| 5 | If I saw a young person getting picked on by others, I would stand up for them or try to get help |
Survey questions (baseline and follow-up surveys): Q9. Thinking about people you mix with in your everyday life, for example your friends, classmates, teachers, people you might work with, etc. How important is it for you personally to…? [Very important, quite, neither important nor unimportant, not important, not at all]
Summary measure(s): Social mix B
| N | Statement label |
|---|---|
| 1 | Spend time with people who are different to you (for example their ethnicity, gender, sexual orientation, religion or family background) |
| 2 | Learn about other people’s cultures |
| 3 | Stand up for the rights of others |
| 4 | Treat people with respect, regardless of their background |
Survey questions (baseline and follow-up surveys): Q3. To what extent do you agree or disagree that you personally can influence decisions affecting your local area? By local area, we mean the area within 15 to 20 minutes from your home. [Strongly agree, agree, neither agree nor disagree, disagree, strongly disagree]
Q4. Please look at these statements and say how you feel about your local area. By local area, we mean the area within 15-20 minutes from your home. [Strongly agree, agree, neither agree nor disagree, disagree, strongly disagree]
Summary measure(s): Attitudes about local area (q03/q04), feelings about local area (q04)
| N | Statement label |
|---|---|
| 1 | I can trust people around here |
| 2 | I feel that I belong to this local area |
| 3 | I would be willing to work together with others on something to improve my neighbourhood |
| 4 | I feel a sense of responsibility towards my local neighbourhood |
Table B.15 Wellbeing measures
| Survey questions (baseline and follow-up surveys) | Summary measures |
|---|---|
| Q13. Overall, how satisfied are you with your life nowadays? [0= Not at all satisfied, 10=Completely satisfied] Q14. Overall, to what extent do you feel that the things you do in your life are worthwhile? [0= Not at all worthwhile, 10=Completely worthwhile] Q15. Overall, how happy did you feel yesterday? [0= Not at all happy, 10=Completely happy] Q16. On a scale where 0 is “not at all anxious” and 10 is “completely anxious”, overall, how anxious did you feel yesterday? [0= Not at all anxious, 10=Completely anxious] |
Outcomes are not summarised and reported individually: - ONS Wellbeing: Life satisfaction (q13) - ONS Wellbeing: Worthwhile (q14) - ONS Wellbeing: Happiness (q15) - ONS Wellbeing: Anxiety (q16) |
B3: Residential service line: impact estimates for summary outcomes
Table B.16 to B.20 presents the summary outcome measures created for the impact analysis of Year 1 and Year 2. Findings are written up in the main report. The summary measures were created by averaging individual measures. The baseline and follow-up estimates provide the average outcome for participants and comparison at baseline and follow-up.
The impacts are estimated as Difference-in-Differences. This means that the impact estimates compare the change between baseline and follow-up for participants and the comparison group. The key assumption is that the change in the comparison group represents the change that would have occurred in the participant group had they not taken part in NCS.
To interpret the results, refer to the impact estimate for the direction of impact (i.e. values greater than zero indicate a positive impact and values less than zero indicate a negative impact). Results are statistically significant when the p-value is less than 0.05.
Table B.16 Combined results of Year 1 and 2: Life skills and independent living – residential service line
| Summary outcome | Scale | Impact estimate | Standard Error | t-value | p-value | 95% lower CI | 95% upper CI | Baseline estimates: Comparison | Baseline estimates: Participants | Follow-up estimates: Comparison | Follow up estimates: Participants |
|---|---|---|---|---|---|---|---|---|---|---|---|
| Teamwork A (q01) | Standardised average | -0.12 | 0.03 | -3.60 | 0.000 | -0.18 | -0.05 | 4.35 | 4.45 | 4.29 | 4.26 |
| Leadership (q01) | Standardised average | 0.20 | 0.03 | 6.45 | 0.000 | 0.14 | 0.26 | 2.32 | 2.11 | 2.29 | 2.29 |
| Listening and speaking (q01) | Standardised average | 0.02 | 0.03 | 0.86 | 0.390 | -0.03 | 0.08 | 2.80 | 2.82 | 2.76 | 2.80 |
| Creativity (q01) | Standardised average | -0.02 | 0.03 | -0.63 | 0.532 | -0.09 | 0.05 | 1.62 | 1.56 | 1.78 | 1.69 |
| Emotion management (q02) | Standardised average | -0.06 | 0.04 | -1.42 | 0.155 | -0.14 | 0.02 | 3.95 | 4.00 | 3.84 | 3.82 |
| Empathy (q02) | Standardised average | -0.08 | 0.04 | -2.15 | 0.032 | -0.14 | -0.01 | 4.89 | 4.90 | 4.91 | 4.85 |
| Teamwork B (q02) | Standardised average | 0.16 | 0.04 | 4.30 | 0.000 | 0.09 | 0.24 | 5.68 | 5.58 | 5.68 | 5.75 |
| Responsibility (q02) | Standardised average | -0.21 | 0.03 | -6.11 | 0.000 | -0.28 | -0.14 | 7.58 | 7.78 | 7.44 | 7.43 |
| Initiative (q02) | Standardised average | 0.02 | 0.04 | 0.44 | 0.660 | -0.06 | 0.09 | 5.52 | 5.50 | 5.34 | 5.33 |
| Problem solving (q02) | Standardised average | 0.10 | 0.03 | 2.92 | 0.004 | 0.03 | 0.17 | 4.64 | 4.55 | 4.58 | 4.59 |
| Resilience (q02) | Standardised average | -0.02 | 0.03 | -0.59 | 0.557 | -0.09 | 0.05 | 5.93 | 5.93 | 5.75 | 5.73 |
Table B.17 Combined results of Year 1 and 2: Employability and work readiness – residential service line
| Summary outcome | Scale | Impact estimate | Standard Error | t-value | p-value | 95% lower CI | 95% upper CI | Baseline estimates: Comparison | Baseline estimates: Participants | Follow-up estimates: Comparison | Follow-up estimates: Participants |
|---|---|---|---|---|---|---|---|---|---|---|---|
| Future transitions: Attitudes (q10) | Standardised average | 0.01 | 0.04 | 0.29 | 0.774 | -0.06 | 0.08 | 4.19 | 4.19 | 4.00 | 4.02 |
| Future transitions: Positivity B (q10) | Standardised average | 0.01 | 0.04 | 0.31 | 0.756 | -0.06 | 0.08 | 3.61 | 3.64 | 3.42 | 3.46 |
| Future transitions: Consider higher education (q11) | Percentage points | 0.01 | 0.02 | 0.84 | 0.402 | -0.02 | 0.04 | 0.72 | 0.72 | 0.71 | 0.72 |
| Future transitions: Consider further education (q11) | Percentage points | -0.01 | 0.02 | -0.65 | 0.516 | -0.05 | 0.02 | 0.22 | 0.25 | 0.12 | 0.14 |
| Future transitions: Consider apprenticeship (q11) | Percentage points | -0.01 | 0.02 | -0.41 | 0.685 | -0.05 | 0.03 | 0.34 | 0.33 | 0.40 | 0.38 |
| Positivity about work/career transitions (q12) | Standardised average | 0.00 | 0.04 | -0.05 | 0.957 | -0.08 | 0.08 | 6.99 | 7.00 | 6.79 | 6.80 |
Table B.18 Combined results of Year 1 and 2: Social action and volunteering – residential service line
| Summary outcome | Scale | Impact estimate | Standard Error | t-value | p-value | 95% lower CI | 95% upper CI | Baseline estimates: Comparison | Baseline estimates: Participants | Follow up estimates: Comparison | Follow up estimates: Participants |
|---|---|---|---|---|---|---|---|---|---|---|---|
| Civic engagement (q05) | Standardised average | 0.01 | 0.04 | 0.20 | 0.840 | -0.07 | 0.08 | 3.93 | 3.97 | 3.89 | 3.94 |
| Hours of volunteering (q07) | Number of hours | 1.26 | 0.84 | 1.49 | 0.136 | -0.40 | 2.92 | 7.78 | 8.14 | 4.04 | 5.67 |
| Types of volunteering (q06) | Standardised average | 0.22 | 0.04 | 5.87 | 0.000 | 0.15 | 0.30 | 1.15 | 1.10 | 1.13 | 1.31 |
Table B.19 Combined results of Year 1 and 2: Social cohesion – residential service line
| Summary outcome | Scale | Impact estimate | Standard Error | t-value | p-value | 95% lower CI | 95% upper CI | Baseline estimates: Comparison | Baseline estimates: Participants | Follow-up estimates: Comparison | Follow-up estimates: Participants |
|---|---|---|---|---|---|---|---|---|---|---|---|
| Attitudes about local area (q03 / q04)) | Standardised average | 0.00 | 0.03 | -0.12 | 0.903 | -0.07 | 0.06 | 5.19 | 5.28 | 5.10 | 5.19 |
| Feelings about local area (q04) | Standardised average | 0.00 | 0.03 | -0.01 | 0.993 | -0.06 | 0.06 | 5.16 | 5.21 | 5.04 | 5.09 |
| Social mix A (q08) | Standardised average | -0.16 | 0.04 | -3.82 | 0.000 | -0.24 | -0.08 | 8.73 | 8.82 | 8.64 | 8.57 |
| Social mix B (q09) | Standardised average | 0.13 | 0.04 | 3.19 | 0.010 | 0.05 | 0.20 | 7.61 | 7.57 | 7.51 | 7.61 |
Table B.20 Combined results of Year 1 and 2: Wellbeing – residential service line
| Summary outcome | Scale | Impact estimate | Standard Error | t-value | p-value | 95% lower CI | 95% upper CI | Baseline estimates: Comparison | Baseline estimates: Participants | Follow-up estimates: Comparison | Follow-up estimates: Participants |
|---|---|---|---|---|---|---|---|---|---|---|---|
| ONS Wellbeing: Life satisfaction (q13) | Standardised average | 0.01 | 0.04 | 0.18 | 0.855 | -0.06 | 0.08 | 3.26 | 3.25 | 3.18 | 3.18 |
| ONS Wellbeing: Worthwhile (q14) | Standardised average | -0.05 | 0.04 | -1.25 | 0.212 | -0.12 | 0.03 | 3.11 | 3.09 | 3.07 | 3.00 |
| ONS Wellbeing: Happiness (q15) | Standardised average | -0.03 | 0.04 | -0.70 | 0.485 | -0.11 | 0.05 | 2.77 | 2.74 | 2.66 | 2.61 |
| ONS Wellbeing: Anxiety (q16) | Standardised average | -0.03 | 0.04 | -0.74 | 0.460 | -0.10 | 0.05 | 2.22 | 2.15 | 2.03 | 1.93 |
B4: COTA service line: impact estimates for summary outcomes
Tables B.21 to B.25 present the summary outcome measures created for the impact analysis of Community Open to All (COTA) service line Year 1 and Year 2. The summary measures were created by averaging individual measures. The baseline and follow-up estimates provide the average outcome for participants and comparison at baseline and follow-up.
The impacts are estimated as Difference-in-Differences. This means that the impact estimates compare the change between baseline and follow-up for participants and the comparison group. The key assumption is that the change in the comparison group represents the change that would have occurred in the participant group had they not taken part in NCS.
To interpret the results, refer to the impact estimate for the direction of impact (i.e. values greater than zero indicate a positive impact and values less than zero indicate a negative impact). Results are statistically significant when the p-value is less than 0.05.
In addition to the interpretability limitations already noted for the residential line analysis, the COTA analysis presents further caveats that should be considered:
-
Limited survey participation: Only a small proportion of COTA participants were invited to or took part in the survey. Those who did participate are likely to differ in various ways from those who did not, increasing the risk that the sample is not representative of the broader participant group.
-
Smaller and skewed sample: The COTA sample size is significantly smaller than that of the Residential sample (approximately 10%). Moreover, it includes a disproportionately high number of 18-year-olds compared to the comparison sample (10% vs. 0.3%).
-
Survey timing misalignment: Unlike the residential group, the timing of COTA respondents is less aligned with the comparison surveys. This is due to COTA’s more continuous delivery model. While efforts were made to match COTA respondents with the closest comparison batch, the fieldwork periods and the intervals between baseline and follow-up do not align as neatly as they do for residential.
Results show statistically significant evidence of positive outcomes among the COTA participants who completed the survey relative to the comparison group in the following outcome measures. Interestingly these align with the ‘community’ nature of provision i.e. relating to social inclusion, teamwork and empathy. Results are as follows:
-
An increase of 0.16 Standard Deviations (SD) in the perceived importance of social mixing, particularly learning about someone’s culture (social mix B)
-
An increase of 0.29 SD in problem solving skills, particularly related to making step-by-step plans to reach their goals.
-
An increase of 0.13 in social inclusion, for example finding it easy to work with people with different backgrounds and standing for someone if they’re treated unfairly (social mix A)
-
An increase of 0.28 SD in teamwork skills, particularly related to asking for help when they need it (teamwork B)
-
An increase of 0.20 SD in initiative, related to working hard to get something done and not giving up when things get difficult.
-
An increase of 0.16 in resilience, related to bouncing back and not giving up when things get difficult.
Table B.21 Life skills and independent living – COTA service line
| Summary outcome | Scale | Impact estimate | Standard Error | t-value | p-value | 95% lower CI | 95% upper CI | Baseline estimates: Comparison | Baseline estimates: Participants | Follow-up estimates: Comparison | Follow-up estimates: Participants |
|---|---|---|---|---|---|---|---|---|---|---|---|
| Teamwork A (q01) | Standardised average | 0.04 | 0.07 | 0.60 | 0.552 | -0.10 | 0.18 | 3.84 | 3.99 | 3.87 | 4.06 |
| Leadership (q01) | Standardised average | 0.29 | 0.09 | 3.17 | 0.002 | 0.11 | 0.47 | 2.11 | 2.01 | 2.07 | 2.25 |
| Listening and speaking (q01) | Standardised average | 0.00 | 0.07 | -0.04 | 0.966 | -0.15 | 0.14 | 2.53 | 2.65 | 2.52 | 2.63 |
| Creativity (q01) | Standardised average | -0.19 | 0.09 | -2.00 | 0.046 | -0.38 | 0.00 | 1.82 | 1.87 | 1.94 | 1.80 |
| Emotion management (q02) | Standardised average | 0.03 | 0.09 | 0.39 | 0.693 | -0.14 | 0.21 | 3.44 | 3.53 | 3.41 | 3.53 |
| Empathy (q02) | Standardised average | 0.17 | 0.09 | 1.87 | 0.061 | -0.01 | 0.35 | 4.32 | 4.34 | 4.39 | 4.58 |
| Teamwork B (q02) | Standardised average | 0.28 | 0.09 | 3.06 | 0.002 | 0.10 | 0.46 | 5.36 | 5.31 | 5.43 | 5.67 |
| Responsibility (q02) | Standardised average | 0.06 | 0.10 | 0.66 | 0.510 | -0.13 | 0.26 | 7.07 | 7.16 | 7.08 | 7.23 |
| Initiative (q02) | Standardised average | 0.20 | 0.09 | 2.26 | 0.024 | 0.03 | 0.37 | 4.93 | 4.81 | 4.80 | 4.88 |
| Problem solving (q02) | Standardised average | 0.29 | 0.09 | 3.26 | 0.001 | 0.11 | 0.46 | 4.33 | 4.37 | 4.36 | 4.68 |
| Resilience (q02) | Standardised average | 0.16 | 0.08 | 2.04 | 0.041 | 0.01 | 0.32 | 5.30 | 5.25 | 5.19 | 5.30 |
Table B.22 Employability and work readiness – COTA service line
| Summary outcome | Scale | Impact estimate | Standard Error | t-value | p-value | 95% lower CI | 95% upper CI | Baseline estimates: Comparison | Baseline estimates: Participants | Follow-up estimates: Comparison | Follow-up estimates: Participants |
|---|---|---|---|---|---|---|---|---|---|---|---|
| Future transitions: Attitudes (q10) | Standardised average | 0.13 | 0.09 | 1.42 | 0.157 | -0.05 | 0.31 | 3.62 | 3.58 | 3.54 | 3.64 |
| Future transitions: Positivity B (q10) | Standardised average | 0.11 | 010 | 1.14 | 0.253 | -0.08 | 0.30 | 3.09 | 3.06 | 3.00 | 3.08 |
| Future transitions: Consider higher education (q11) | Percentage points | -0.02 | 0.04 | -0.48 | 0.629 | -0.09 | 0.06 | 0.54 | 0.48 | 0.57 | 0.48 |
| Future transitions: Consider further education (q11) | Percentage points | 0.03 | 0.05 | 0.72 | 0.471 | -0.06 | 0.12 | 0.23 | 0.23 | 0.15 | 0.19 |
| Future transitions: Consider apprenticeship (q11) | Percentage points | -0.02 | 0.04 | -0.48 | 0.628 | -0.10 | 0.06 | 0.37 | 0.34 | 0.42 | 0.37 |
| Positivity about work/career transitions (q12) | Standardised average | 0.08 | 0.11 | 0.75 | 0.454 | -0.13 | 0.30 | 6.61 | 6.63 | 6.46 | 6.56 |
Table B.23 Social action and volunteering – COTA service line
| Summary outcome | Scale | Impact estimate | Standard Error | t-value | p-value | 95% lower CI | 95% upper CI | Baseline estimates: Comparison | Baseline estimates: Participants | Follow-up estimates: Comparison | Follow-up estimates: Participants |
|---|---|---|---|---|---|---|---|---|---|---|---|
| Civic engagement (q05) | Standardised average | 0.15 | 0.09 | 1.63 | 0.104 | -0.03 | 0.33 | 3.39 | 3.33 | 3.41 | 3.50 |
| Hours of volunteering (q07) | Number of hours | 0.88 | 0.77 | 1.15 | 0.250 | -0.62 | 2.39 | 4.11 | 3.75 | 3.80 | 4.33 |
| Types of volunteering (q06) | Standardised average | 0.13 | 0.11 | 1.12 | 0.261 | -0.09 | 0.34 | 0.96 | 1.01 | 0.97 | 1.15 |
Table B.24 Social cohesion – COTA service line
| Summary outcome | Scale | Impact estimate | Standard Error | t-value | p-value | 95% lower CI | 95% upper CI | Baseline estimates: Comparison | Baseline estimates: Participants | Follow-up estimates: Comparison | Follow-up estimates: Participants |
|---|---|---|---|---|---|---|---|---|---|---|---|
| Attitudes about local area (q03 / q04)) | Standardised average | 0.09 | 0.08 | 1.16 | 0.247 | -0.06 | 0.25 | 5.05 | 5.19 | 4.99 | 5.22 |
| Feelings about local area (q04) | Standardised average | 0.01 | 0.09 | 0.10 | 0.923 | -0.16 | 0.18 | 4.90 | 4.98 | 4.84 | 4.93 |
| Social mix A (q08) | Standardised average | 0.13 | 0.10 | 1.30 | 0.194 | -0.07 | 0.33 | 7.82 | 7.73 | 7.83 | 7.87 |
| Social mix B (q09) | Standardised average | 0.16 | 0.12 | 1.35 | 0.177 | -0.07 | 0.40 | 7.07 | 7.13 | 7.01 | 7.23 |
Table B.25 Wellbeing – COTA service line
| Summary outcome | Scale | Impact estimate | Standard Error | t-value | p-value | 95% lower CI | 95% upper CI | Baseline estimates: Comparison | Baseline estimates: Participants | Follow-up estimates: Comparison | Follow- up estimates: Participants |
|---|---|---|---|---|---|---|---|---|---|---|---|
| ONS Wellbeing: Life satisfaction (q13) | Standardised average | -0.02 | 0.10 | -0.17 | 0.869 | -0.21 | 0.18 | 2.91 | 2.91 | 2.87 | 2.86 |
| ONS Wellbeing: Worthwhile (q14) | Standardised average | -0.01 | 0.09 | -0.14 | 0.886 | -0.18 | 0.16 | 2.77 | 2.82 | 2.76 | 2.81 |
| ONS Wellbeing: Happiness (q15) | Standardised average | -0.02 | 0.11 | -0.18 | 0.859 | -0.24 | 0.20 | 2.41 | 2.44 | 2.42 | 2.43 |
| ONS Wellbeing: Anxiety (q16) | Standardised average | 0.23 | 0.09 | 2.45 | 0.014 | 0.05 | 0.42 | 1.98 | 1.85 | 1.87 | 1.98 |
Annex C: Year 1 Economic Evaluation
An economic evaluation was conducted by London Economics and the end of Year 1 (2023 to 2024) and consisted of a willingness to pay analysis of the NCS programme as a whole, followed by a further value for money analysis of the cohort of residential programme participants between April 2023 and December 2023.
C.1 Willingness to pay analysis
The purpose of the willingness to pay (WTP) study was to estimate the non-use value of NCS. The non-use value of NCS captures the value enjoyed by people who do not directly participate in NCS but benefit indirectly from its operation. For example, people may benefit from living in a society where young people can build skills, resilience, and connections through programmes such as NCS. The WTP survey focused on wider social outcomes of NCS – for example social and civic responsibility, and sense of belonging.
The WTP survey involved an online survey of 2,000 UK adults. The main purpose of the survey was to estimate the maximum amount respondents would be willing to pay in tax to support NCS.[footnote 9] The survey sample was split between a nationally representative sample of 1,000 UK adults, and a boost sample of 1,000 people with children of secondary school age (13 to 19) in their household. The boost sample also had minimum quotas of 150 parents of children with Special Educational Needs (SEN) or an Education, Health and Care Plan, and 150 parents of children registered to receive Free School Meals. The survey was piloted using 100 responses and fieldwork was completed between 11 October to 18 October 2023.
C1.1 Non-use value within the NCS value for money framework
The survey used three different techniques to estimate the maximum willingness to pay (WTP) for the overall NCS: single-bounded dichotomous choice, double-bounded dichotomous choice, and open-ended contingent valuation. The three techniques were applied sequentially in the survey. This approach follows the guidance outlined in the HM Treasury Green Book in relation to stated preference techniques.[footnote 10] Figure C.1 provides a summary of the three techniques.
Figure C.1 Diagram of three WTP techniques
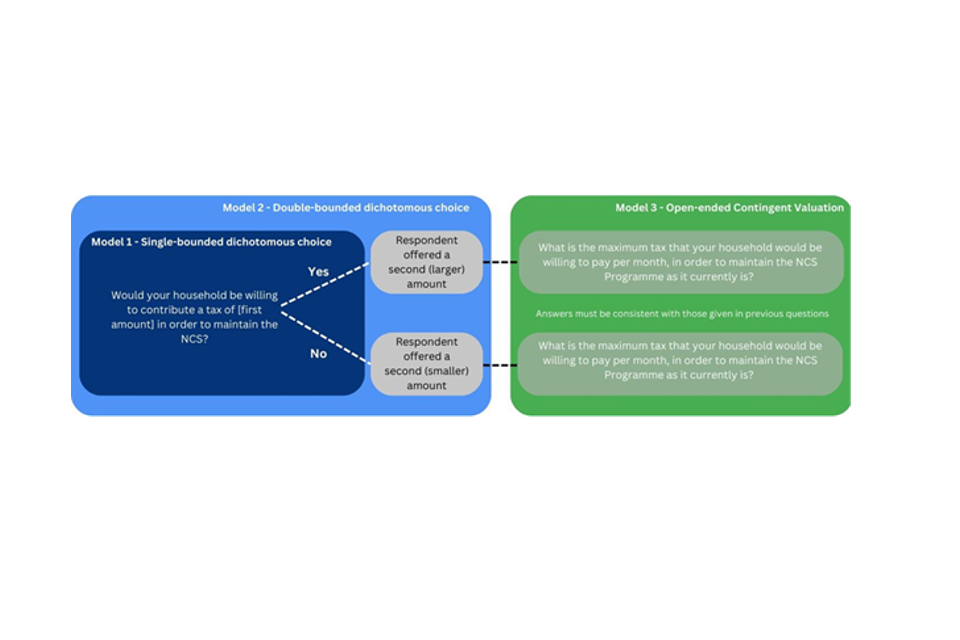
In the single-bounded dichotomous choice model, respondents were asked if they would be willing to pay some amount £x in tax to support NCS.
Respondents could answer ‘yes’ or ‘no’ to this question. Responses were analysed using a logit model to estimate the maximum WTP for each respondent. The maximum WTP was defined as the tax level £x which would make the respondent indifferent between responding ‘yes’ or ‘no’ to the single-bounded dichotomous choice question. In other words, it is the tax level where a respondent would not be willing to pay a tax which is £0.01 greater than £x, but would be willing to pay a tax which is equal to £x. In a hypothetical example, if a person’s maximum WTP to support NCS was estimated to be £10.00, then this would imply that they would be willing to pay £10.00 in tax to support NCS, but would choose not to pay £10.01.
The double-bounded dichotomous choice model proceeded in a similar way to the single-bounded model, except respondents were asked the same yes/no WTP question again with a different tax level.
The tax level presented in the double-bounded question was based on responses to the single-bounded question - if respondents said ‘yes’ to the initial amount £x they were shown a higher amount £y and asked if they would be willing to pay this amount to support NCS. If respondents said ‘no’ to £x they were shown a lower amount £z.
The key benefit of the double-bounded model is that it uses more information than the single-bounded model, which means it can generate more precise estimates of individual WTP.[footnote 11] As for the single-bounded model, the double-bounded model was analysed using a logit model to estimate maximum WTP levels for each respondent.
In the open-ended contingent valuation, following the response to the second yes/no question, respondents were asked to directly state their maximum WTP for NCS.
In other words, respondents were asked: “What is the maximum amount you would be willing to pay in tax to support NCS?” Respondents could also respond ‘not sure’.
The open-ended contingent valuation question was asked following the single-bounded and double-bounded dichotomous choice questions. This was done to allow respondents to become familiar with the valuation task and to provide bounds on WTP for the open-ended question. For example, if a respondent was willing to pay £5 to support the NCS but not willing to pay £10, then their maximum WTP should lie in the interval £5 to £10.[footnote 12]
The initial amount of tax £x was randomised across respondents. The rationale for this was to minimise anchoring in the open-ended response question. Anchoring occurs when people use arbitrary values as a reference point when answering open-ended valuation questions. For example, a respondent shown an initial tax level of £10 may use this value as a starting point when evaluating their maximum WTP for NCS. Randomising the initial tax £x across a range of values helps to reduce anchoring bias.
The WTP survey also asked a series of demographic questions to allow for analysis of WTP across different groups. For example, survey respondents were asked to state their level of education, their financial resilience, and whether they were previously aware of NCS.
C.1.2 Single-bounded dichotomous choice
The estimated mean and median maximum WTP from the single-bounded dichotomous choice are shown in Table C.1. Results are shown for the full sample, for the set of respondents with a child aged under 19 in the household, and the set of respondents who reported prior awareness of NCS.
Table C.1 - WTP by demographic group, single-bounded (£)
| Main sample | Children < 19 in household | All in the sample aware of NCS | |
|---|---|---|---|
| Mean | 14.80 | 20.40 | 23.58 |
| Median | 13.82 | 17.57 | 22.07 |
For the main sample, the mean estimated maximum WTP was £14.80. This means that, on average, respondents in the main sample were willing for their households to pay £14.80 in tax per year to support the NCS programme, compared to a situation where NCS ceases to operate. The median maximum WTP was slightly lower, at £13.82. The mean and median maximum WTP were higher for respondents who had children under 19 in their household or had previous awareness of NCS.
Figure C.2 Estimated WTP by respondent, single-bounded
Figure C.2 displays the estimated maximum WTP for each respondent, broken down by whether the respondent was in the main or boost sample. The estimated WTP is ordered from lowest to highest within each sample. The estimated WTP curve is higher for respondents in the boost sample. This is likely to be explained by the fact that respondents in the boost sample were more likely to have children in the household, more likely to have children with SEN, and more likely to be aware of the NCS - all factors positively associated with WTP.
C.1.3 Double-bounded dichotomous choice
The estimated mean and median maximum WTP for the double-bounded dichotomous choice model are shown in Table C.2, alongside the breakdown by demographic group. The estimated maximum WTP from the double-bounded model was £10.16. This means that, on average, respondents in the main sample were willing for their households to pay £10.16 in tax per year to support the NCS programme, compared to a situation where NCS ceases to operate. This estimate is lower than the central estimate for the single-bounded model, which was £14.80. As in the single-bounded model, the estimated WTP was higher for respondents with children under the age of 19 in the household, and for people with prior awareness of NCS. This finding suggests that awareness is a key driver of how people value NCS. This may mean that those that are aware of NCS tend to have a more positive view of the programme, as they are willing to pay more (on average) than the general population to support it.
Table C.2 - WTP by demographic group, double-bounded (£)
| Main sample | Children < 19 in household | All in the sample aware of NCS | |
|---|---|---|---|
| Mean | 10.16 | 13.98 | 17.16 |
| Median | 9.26 | 12.52 | 16.88 |
The estimated respondent maximum WTP for NCS in the single-bounded and double-bounded models are shown in Figure C.3.
Figure C.3 Estimated WTP by respondent, double vs. single-bounded
C.1.4 Open-ended contingent valuation
Lastly, we present the results from the open-ended contingent valuation of NCS. The mean and median values for the stated maximum WTP are shown in Table C.3. The mean maximum WTP from the main sample was £22.73. In other words, the mean maximum WTP suggests that the average respondent was willing for their household to pay £22.73 per year in taxes to support the NCS programme, compared to a situation where NCS ceases to operate.
Table C.3 - WTP by demographic group, open-ended contingent valuation (£)
| Main sample | Children < 19 in household | All in the sample aware of NCS | |
|---|---|---|---|
| Mean | 22.73 | 36.30 | 36.50 |
| Median | 11.00 | 29.00 | 30.00 |
Across the main sample and the demographic groups, the mean WTP was higher than the estimates from the single- and double-bounded models. One potential explanation for this is that respondents who had a lower WTP for NCS were more likely to respond ‘not sure’ to the open-ended question. Respondents who said ‘not sure’ to the open-ended question were less likely to accept a given tax level in the single- and double-bounded choice questions. This means that there is potentially non-random selection into answering the open-response question – i.e. the open-response question is potentially more likely to be answered by those with a higher willingness to pay, resulting in a higher mean WTP than the single- and double-bounded models.
The median WTP (£11.00) was half the mean WTP (£22.73) in the main sample. This suggests that the estimated mean WTP is being driven by outlier responses at the upper end of the distribution – i.e. a few very high values are skewing the mean upwards, which do not have as strong an impact on the median. The open-response median WTP of £11.00 is between those from the single-bounded model (£13.82) and the double-bounded model (£9.26).
The stated maximum WTP values from the main sample are displayed graphically in Figure C.4. The overall shape of the WTP distribution is roughly similar to the estimated distribution in the single- and double-bounded dichotomous choice models (Figure C.2 and Figure C.3). However, the stated maximum WTP estimates are much higher at the upper range of the distribution. For example, 50 respondents gave their maximum WTP as £100. There was some bunching at round numbers - for example £10, £20, and £50.
Figure C.4 Estimated WTP by respondent, open-ended contingent valuation
C.1.5 Non-use value of NCS
To generate an estimate of the overall non-use value of the NCS, the estimated mean WTP for NCS was multiplied by the estimated number of UK households – 28.2 million in 2022.[footnote 13] The preferred WTP estimate came from the mean of the double-bounded choice model. The reason for this is that this model uses more information than the single-bounded model and does not have the issue of potentially non-random selection as in the open-ended model.
The mean is preferred to the median as it can account for outliers who may potentially have a very high WTP for NCS. Although we may be concerned about the validity of outlier responses, these responses may simply reflect genuinely high valuations of NCS from certain respondents. However, it should be noted that in our preferred model there is relatively little difference between the mean and median WTP.
Central, low, and high estimates for the non-use value of NCS are shown in Table C.4. The low and high estimates were derived from the lower and upper bounds on the 95% confidence interval around the mean WTP from the double-bounded model (£10.16). The central estimate of £286.5 million is between 5-6 times higher than the NCS total budget of £50.3 million for 2023 to 2024.[footnote 14]
Table C.4 - Estimated non-use value of NCS
| Scenario | Mean WTP for NCS (£) | Number of UK households | Non-use value of NCS |
|---|---|---|---|
| Low | 9.68 | 28.2 million | £9.68 × 28.2 million = £273.0 million |
| Central | 10.16 | 28.2 million | £10.16 × 28.2 million = £286.5 million |
| High | 10.64 | 28.2 million | £10.64 × 28.2 million = £300.0 million |
C.2 Further value for money analysis
The key purpose of the value for money (VfM) analysis was to generate benefit-cost ratios for the residential programme. The analysis only considered the residential service and used data from the impact evaluation conducted at the end of year 1, this covered participants in the residential service line over the period April 2023 to December 2023.
Following the principles outlined in the HM Treasury Green Book,[footnote 15] London Economics monetised a series of benefits associated with participation in the NCS residential programme. The costs associated with the cohort of participants in the residential service line between April 2023 and December 2023 were then assessed, to generate estimates of the net benefit and benefit-cost ratio (BCR) associated with the residential service line during this period. There were 17,877 residential programme participants included in this cohort, of which 7,885 were male and 9,992 were female.
As in previous iterations of the NCS Evaluation, the VfM framework employed two distinct approaches to estimate the economic impact of the programme:
- a bottom-up approach which estimated economic impact using changes in individual-level skills, aspirations, and volunteering; and
- a top-down approach which estimated economic impact based on changes in subjective wellbeing among participants.
The bottom-up approach estimated the value of NCS by calculating the economic value of changes in specific attributes (e.g. aspirations to education, volunteering activity and non-cognitive skills)[footnote 16], before generating an aggregate value as the sum of these individual impacts. In contrast, the key idea of the top-down approach is that the benefits of participation in NCS are captured through changes in subjective wellbeing – for example, participants may feel improved wellbeing if they develop skills such as leadership or teamwork. Both approaches utilised data from the year 1 impact evaluation, combined with estimates of monetary benefits associated with these impacts from wider literature.
The two approaches should be considered separately and should not be summed due to the high likelihood of double counting. Impacts associated with aspirations for education, volunteering and non-cognitive skills could possibly result in increases in self-reported wellbeing, meaning that summing the two approaches could result in an overestimation of the benefits of the programme. Therefore, the findings from each approach are discussed separately below.
Within this analysis, impact estimates were considered regardless of statistical significance, which is consistent with the value for money analyses conducted in previous NCS evaluations. This approach was taken to maximise the amount of information used from the impact evaluation, as the point estimate still provides insights into the relative size of the effect regardless of its significance. Further, any negative point estimates from the impact evaluation were set to zero, as it is unrealistic to attribute negative economic benefits to the programme for any of the impacts considered. For example, it is implausible that participation in the residential programme would result in a reduction in a young person’s non-cognitive skills. This analysis used impact estimates for male and female participants separately rather than overall estimates, in order to account for differences in the size of unit economic benefits associated with certain impacts.[footnote 17]
C.2.1 The ‘bottom-up’ approach
Aspirations to education
A key objective of the residential service line was to help young people to develop and build their employability and work readiness. One way that participation in the NCS programme could improve a young person’s employability in the longer term was through changes in aspirations to education. In this value for money evaluation, aspirations to three types of education and training were considered: higher education, further education and apprenticeships. To estimate the unit economic benefit associated with aspirations to education, we first considered the probability that aspirations would feed through into the gaining of qualifications, before looking at the net graduate premiums/learner benefits and Exchequer benefits associated with each qualification. The unit economic benefits were then combined with the impacts of the programme and the number of participants to calculate the total economic benefit associated with aspirations to education.
Higher education
To monetise the impact of the residential programme on aspirations to higher education, a previous analysis from McIntosh (2019)[footnote 18] was used to link educational aspiration with realised progression. Specifically, the paper was used to estimate the pass-through rate from reported aspirations to higher education at 16 to entering higher education aged 18. Using this analysis, it was estimated that 42.1% of those that aspire to higher education at age 16 go on to attend a higher education institution at age 18.
To account for attrition during the degree programme, the model used data on non-continuation from the Higher Education Statistics Authority (HESA)[footnote 19] for the most recent available academic year (2019 to 2020). The rate of attrition after the first year of full-time, first degree study in England in 2019 to 2020 was 5.4%. Assuming a linear rate of attrition across a three-year degree programme, we estimated an attrition rate of 15.3% for the whole degree programme, therefore estimating that 84.7% of first degree entrants complete their degree.
Lastly, the analysis utilised a report by London Economics[footnote 20] estimating the net graduate premium and Exchequer benefit associated with first degree qualifications in England. The combined net graduate premium and Exchequer benefit was estimated at £221,000 and £131,000 for men and women respectively, in 2023 prices.
The Year 1 impact analysis found that male participants in the residential programme were approximately 7.5% more likely to aspire to higher education following participation in the programme, which was significant to the 5% level. The corresponding figure for female participants was 1.0%, which was insignificant to the 10% level, reflecting the insignificant estimates from the Year 1 impact evaluation.
Combining the information on a) pass-through from reported aspirations to higher education to attending a higher education institution, b) the attrition rate associated with first degree qualifications, c) the net graduate premium and Exchequer benefit associated with these qualifications and d) the impact estimates, we estimated an economic benefit associated with aspirations to higher education of £2,865 per participant.[footnote 21] When multiplying this by the number of residential programme participants, we estimated a total economic benefit associated with aspirations to enter higher education of £51.2 million.
Further education
The paper by McIntosh (2019) was also used to calculate the pass-through rate from aspiring to undertake further vocational education at age 16 to continuing on a vocational path in Year 12, which is estimated at 72.2%.
Next, using UK government statistics on further education and skills participation,[footnote 22] it was estimated that around 47.6% of 16 to 18-year-old vocational students were on a Level 2 course, 47.2% were on a Level 3 course, and 5.2% were studying for a Level 4+ qualification.
Using the UK government’s 16 to 18 destinations statistics,[footnote 23] we estimated the pass-through from a vocational route at age 16-18 to continued vocational qualifications at post-18 level. We treated students with an unknown destination post-16 as missing data and re-allocate them proportionally across all possible destinations. Under this approach, we estimated a pass-through rate of 20.9% - in other words, of students completing a vocational qualification aged 16 to 18, around one in five will continue to further vocational study post-18.
We assumed that students who continue on a vocational route post-18 complete a qualification one level above the level previously studied – for example, someone studying a Level 2 qualification at age 16 to 18 would go on to study a Level 3 qualification at post-18 level.
Combining these data sources with information on the achievement rates for different vocational courses,[footnote 24] we estimated the probability of achieving a given level of vocational qualification, conditional on post-16 aspirations. Using these methods, it was estimated that of those that have aspirations at age 16 to enter vocational education in Year 12, 22.0% leave vocational education with a Level 2 qualification, 29.0% leave with a Level 3 qualification, and 7.4% leave with a Level 4 qualification.
These estimates can be combined with estimates of the learner benefit and Exchequer benefit associated with different levels of vocational qualifications, which are calculated through an analysis of the Labour Force Survey and presented in Table C.5, to derive the overall monetised benefit associated with increased aspirations to further education.
Table C.5 – Combined net learner and Exchequer benefits associated with further education, by level of study and gender
| Level | Male | Female |
|---|---|---|
| Level 2 | £125,000 | £67,000 |
| Level 3 | £163,000 | £61,000 |
| Level 4 | £214,000 | £69,000 |
Note: Estimates are rounded to the nearest £1,000 and presented in 2023 prices
The Year 1 impact evaluation found a negative, although insignificant to the 10% level, relationship between participation in the NCS residential programme and aspirations to enter further education for male participants. There was a positive impact regarding female participants of 0.4%, although this finding was also insignificant to the 10% level. This reflects the lack of significant findings in relation to further education estimated at the overall level within the Year 1 impact evaluation.
Multiplying the impact estimate for female participants by both a) the expected combined net learner and Exchequer benefits and b) the probability of gaining each level of qualification conditional on aspirations, we estimated an expected benefit per female participant of £140. This results in a total economic benefit of £1.4 million.
Apprenticeships
A similar approach to those used to monetise higher education and further education was also used for apprenticeships. As the McIntosh paper does not provide specific estimates for apprenticeships, we made an assumption that the same pass-through rate from aspirations at age 16 to participation in apprenticeships was the same as for further education, 72.2%.
Using the most recent available data published by the Department for Education,[footnote 25] we estimated the proportion of 16 to 18 year old apprentices at each level of apprenticeship. The data showed that 50.6% of apprentices in this age group obtaining a Level 2 qualification, 44.9% were completing a Level 3 qualification, and the remaining 4.4% were at Level 4 or above. This data was combined with achievement rates for each apprenticeship level[footnote 26] to estimate the probability of achieving a given apprenticeship level, conditional on post-16 aspirations. These probabilities were estimated at 19.8%, 19.3% and 2.1% for Levels 2, 3 and 4 respectively. We assumed that following a 16-18 apprenticeship, the apprentice enters the labour force directly and does not acquire any further vocational education.
Again, these estimates can be combined with the combined net learner and Exchequer benefits associated with each level of apprenticeship, which were calculated separately for males and females and presented in Table C.6.
Table C.6 – Combined net learner and Exchequer benefits associated with apprenticeships, by level of study and gender
| Level | Male | Female |
|---|---|---|
| Level 2 | £275,000 | £101,000 |
| Level 3 | £247,000 | £136,000 |
| Level 4 | £381,000 | £213,000 |
Note: Estimates are rounded to the nearest £1,000 and presented in 2023 prices.
The impact evaluation found a negative relationship between participation in the residential programme and aspirations to undertake apprenticeships for both male and female participants. Both estimates were insignificant at the 10% level. This again reflects the lack of significant findings in relation to future plans within the Year 1 impact evaluation. As a result, the estimated economic benefit associated with aspirations to apprenticeships is £0 million.
Volunteering
The residential NCS programme aims to encourage young people to undertake social action and volunteering, which can bring significant benefits to the wider community as well as economic benefits. To monetise volunteering activity undertaken due to the NCS programme, we combine information on the number of additional volunteering hours committed after the NCS residential programme with the relevant earnings that would be expected to be earned by young people in the labour market in the absence of this volunteering activity.
Using data from the Annual Survey of Hours and Earnings (ASHE),[footnote 27] we can estimate the wage rate that a young person could achieve in the labour market by using the median wage rate for a young person’s relevant age category. This was £8.00 per hour for those aged 16 to 17 and £10.89 per hour for those aged 18 to 21 in 2023.
Next, assumptions from previous NCS evaluations[footnote 28] are used to understand the extent to which volunteering as a result of the NCS programme is likely to persist. For example, additional follow-on evaluations of the 2013 NCS programme found a lasting impact of the programme on volunteering, with programme participants contributing significantly higher rates of volunteering up to 28 months after completion.[footnote 29] Further, it is also assumed that the effect of the NCS programme on volunteering activity remains constant in the first 15 months post-participation, before diminishing at a constant rate to zero by the 27th month, which is consistent with the effect sizes found in the follow-on evaluations of the 2013 NCS programme.
The 2023 impact evaluation found that volunteering hours after participation in the NCS residential programme increased by 2.4 hours per month and 1.0 hours per month for male and female participants respectively. However, both of these estimates were insignificant to the 10% level, despite the significant and positive impacts found overall in the Year 1 impact evaluation.
Combining these estimates with the wage rates found in the ASHE, and the assumptions regarding volunteering persistence into the longer term, it is estimated that the additional volunteering associated with participation in the NCS residential programme brings economic benefits worth £281 per participant.[footnote 30] This results in a total economic benefit associated with volunteering of £5.0 million.
Non-cognitive skills
Another key objective of the NCS residential service line is the development of independence and life skills. To account for these within the value for money evaluation, evidence from the wider literature regarding the income benefits associated with improved non-cognitive skills is considered. This is combined with an indicator for non-cognitive skills, which is created through the use of survey questions relating to different aspects of life skills.
First, we consider the wider literature to estimate the monetary benefits associated with increases in non-cognitive skills, specifically utilising a meta-analysis by Cabus et al. (2021).[footnote 31] The central estimate in this paper suggests that a one standard deviation increase in non-cognitive skills is associated with a 3.2% increase in lifetime earnings.
This can be combined with data from the Office for National Statistics[footnote 32] relating to human capital per head, which is equivalent to total lifetime earnings per person, to calculate the expected earnings premium associated with increases in non-cognitive skills. Considering 16 to 25 year olds, using 2023 prices, it is estimated that average lifetime earnings per head are £1.3m for men and £0.9 million for women. Combining these figures with the findings from Cabus et al. (2021) (i.e. multiplying these average lifetime earnings by 3.2%), an increase in non-cognitive skills of one standard deviation would therefore be associated with an increase in earnings of £41,000 for male participants and £29,000 for female participants.
Next, we utilise estimates from the impact evaluation relating to a set of non-cognitive skills. The following non-cognitive skills are considered:
-
leadership
-
teamwork
-
creativity
-
listening and speaking
-
empathy
-
problem solving
-
initiative
-
responsibility
-
emotion management
To combine these skills into one ‘non-cognitive skills’ score, the following three steps are taken:
-
Survey responses are re-coded in a consistent way, so that a higher score indicates a higher level of that specific element of non-cognitive skill, and all responses are coded on a scale of 1 to 5.
-
For each of the nine non-cognitive outcome measures listed above, the average of the observed scores for each individual for survey questions relating to that measure is taken.[footnote 33]
-
For each individual, the average of the resulting scores across all nine measures included in the non-cognitive skill indicator is taken.
NCS participation is associated with a slight reduction in the non-cognitive skills score for both male and female participants, although both estimates are insignificant to the 10% level. Therefore, the estimated economic benefit associated with non-cognitive skills is £0 million.
The negative, although statistically insignificant, relationship between participation in the residential service line and non-cognitive skills reflects the mixed findings in terms of life skills within the Year 1 impact analysis. The impact evaluation found positive and significant impacts for one of the nine non-cognitive skills considered (leadership), negative and significant impacts for two non-cognitive skills (responsibility and emotion management), and no significant relationship (at the 5% level) between NCS participation and life skills for the remaining six life skills considered. The lack of relationship between non-cognitive skills and participation in the residential programme may reflect the shortened residential experience compared to the previous NCS programme.
Total gross economic benefit – bottom-up approach
The aggregate gross economic benefit resulting from the bottom-up approach is presented in Table C.7. It is found that the residential service line of the NCS programme contributed economic benefits worth £57.6 million. The vast majority of these benefits are associated with increased aspirations to higher education, which are worth £51.2 million, with additional positive economic benefits associated with volunteering (£5.0 million) and aspirations to further education (£1.4 million). However, there are no identified economic benefits associated with aspirations to undertake apprenticeships or changes in non-cognitive skills related to taking part in the NCS residential programme, due to the negative (although insignificant) impacts found for both male and female participants.
Only one of the positive impact estimates included within the gross economic benefit calculations below is statistically significant, which is aspirations to higher education for male participants. However, the economic benefit corresponding to this impact estimate is £46.4 million, making up the majority of the total gross economic benefit estimated.
Table C.7 – Gross economic benefits of the residential service line – bottom-up approach
| Economic benefit | Central estimate |
|---|---|
| Aspirations to higher education | £51.2 million |
| Aspirations to further education | £1.4 million |
| Aspirations to apprenticeships | £0 million |
| Volunteering after the programme | £5.0 million |
| Non-cognitive skills | £0 million |
| Total gross economic benefit | £57.6 million |
Note: Totals may not sum due to rounding of estimates
C.2.2 The ‘top-down’ approach
The top-down approach is estimated by utilising a question in the impact survey relating to life satisfaction. Specifically, respondents were asked to report how satisfied they are with their life nowadays, on a scale of 0 to 10.
Movements along this scale associated with increases or decreases in life satisfaction can be monetised through the use of wellbeing adjusted life years (WELLBYs). A WELLBY is defined as “one statistical unit of life-satisfaction on a 0 to 10 scale for one person for one year”.[footnote 34] Following HM Treasury Green Book principles, the central estimate of the value of a WELLBY in 2023 prices is £15,258.
The impact evaluation finds that participation in the residential programme is associated with an increase in life satisfaction for male participants of 0.12 on a scale of 0 to 10. Conversely, the impact evaluation found that female participants experienced a negative change in life satisfaction associated with the residential programme. Both estimates were insignificant to the 10% level, reflecting the lack of significant findings in relation to wellbeing within the Year 1 impact evaluation.
When multiplying the value of a WELLBY by the impact of NCS participation on male participants’ life satisfaction, we estimate a gross economic benefit of £1,899 per male participant. Aggregating this up by the number of male participants in the residential programme, we estimate an overall gross economic benefit associated with the top-down approach of £15.0 million.
C.2.3 Costs associated with the residential service line
Costs borne by NCST
To fully assess whether the residential programme represents value for money, the costs associated with the residential service line also need to be considered. These costs are either attributable directly to the delivery of the programme or are related to the central costs incurred by NCST associated with the operation of NCS as a whole. According to data provided by NCST, the total delivery cost associated with those that participated in the residential programme between April 2023 and December 2023 was £13.7 million.
It was estimated that NCST costs associated with the residential service line in the 2023 to 2024 financial year were £6.8 million. As the analysis presented here only considers the first nine months of this financial year (i.e. April 2023 to December 2023), these overall costs were pro-rated in order not to overestimate the costs associated with this cohort of participants. Therefore, NCST costs were estimated at £5.1 million.
The overall cost associated with the residential service line, in relation to the participants of the residential programme between April 2023 and December 2023, are therefore estimated at £18.8 million.
Costs to parents and guardians
Whilst participation in the residential programme is mostly funded by the Exchequer, there was a contribution by the parents and guardians of programme participants. In 2023, this was £95 per participant, although some participants did not have to pay and were instead supported through bursaries. Of the 17,877 participants included in this analysis, there were 10,355 fully paid places, resulting in a total cost to parents of £1.0 million. For simplicity, this is notionally allocated across all participants included in the analysis, resulting in an average cost to parents of £55 per participant. This figure is deducted from the gross economic benefits calculated through both approaches, to estimate the net economic benefit associated with the residential programme.
C.2.4 Value for money assessment
Approach 1 – the ‘bottom-up’ approach
As presented above, the gross economic benefits associated with the residential programme, was calculated utilising the bottom-up approach, are £57.6m. These mostly related to the benefits associated with increased aspirations to higher education, which were worth £51.2 million, although further positive economic benefits related to both volunteering (£5.0 million) and aspirations to further education (£1.4 million).
When adjusting to account for the parental contribution to the programme (£1.0 million), the total net economic benefit was therefore estimated at £56.7 million.
The costs associated with this cohort of residential programme participants were £18.8 million. Therefore, the net benefits associated with the residential programme exceed the costs of the programme, resulting in a central benefit-cost ratio of 3.01. In other words, as at the end of Year 1 for every £1 spent on the implementation of the NCS residential programme, it returned £3.01 in terms of increased aspirations to education and additional hours spent volunteering.
Low and high estimates of the gross economic benefits were generated by applying the 95% confidence interval around the central impact estimates and applying the same value for money calculations as presented earlier in this section. As most of the impact estimates were insignificant at the end of Year 1, the low estimate of the gross economic benefits associated with the residential programme is estimated at £0.8 million, which relates only to aspirations to higher education among male participants.[footnote 35] The high estimate of the gross economic benefits was £273.0 million.
The resulting net benefit, accounting for costs to parents and guardians of NCS participation, ranged between -£0.2 million and £272.0 million. The corresponding benefit-cost ratios therefore ranged between -0.01 and 14.44.
Approach 2 – the ‘top-down’ approach
As shown above, the gross economic benefits generated as a result of increased life satisfaction after participating in the NCS residential programme were estimated at £15.0m. Taking into account the parental contribution to the programme (£1.0 million), the net benefits as calculated under the top-down approach were £14.0 million.
Therefore, under the top-down approach, the costs (of £18.8 million) of the programme were estimated to be greater than the net wellbeing benefits associated with participation in the programme, resulting in a benefit-cost ratio of 0.74. In other words, for every £1 spent on the implementation of the NCS residential programme at the end of Year 1, it returned £0.74 in terms of increased wellbeing for participants.
As the impact estimates used for the calculation of the gross economic benefits under the top-down approach were insignificant, the low estimate of the gross economic benefits was £0.0m. The high estimate of the gross economic benefits was £86.7 million. This results in net economic benefits ranging between -£1.0 million and £85.7 million, leading to benefit-cost ratio estimates ranging between -0.05 and 4.55.
Annex D: Value for Money Methodology
D1. Additional description of the value for money methodology
D1.1 Aspirations to higher education
To monetise the impact of the residential programme on aspirations to higher education, a previous analysis from McIntosh (2019)[footnote 36] is used to link educational aspiration with realised progression. Specifically, the paper is used to estimate the pass-through rate from reported aspirations to undertake higher education at 16 to actually entering higher education at age 18. This consists of the following three components:
-
The proportion of students aspiring to an academic route in Year 11 that went on to an academic or mixed route at the post-16 stage: 75.3%. This is calculated as an average of the results from the two cohorts included in the McIntosh study (based on the Longitudinal Survey of Young People in England (LSYPE)), weighted by the number of individuals in each cohort.
-
Of those students on the A-level (i.e. academic or mixed) route, the proportion that went on to apply to university: 70.7%. As above, this is a weighted average of both cohorts.
-
The proportion of applicants to higher education that go on to attend a higher education institution: 79.1%.
Combining these figures, it is estimated that 42.1% of those that aspire to higher education at age 16 go on to attend a higher education institution at age 18.
To account for attrition during the degree programme, the model uses data on non-continuation from the Higher Education Statistics Authority (HESA)[footnote 37] for the most recent available academic year (2019 to 2020). The rate of attrition after the first year of full-time, first degree study in England in 2019 to 2020 was 5.4%. Assuming a linear rate of attrition across a three-year degree programme, we estimate an attrition rate of 15.3% for the whole degree programme, therefore estimating that 84.7% of first degree entrants complete their degree.
Lastly, the analysis utilises a report by London Economics[footnote 38] estimating the net graduate premium and Exchequer benefit associated with first degree qualifications in England. The combined net graduate premium and Exchequer benefit is estimated at £221,000 and £131,000 for men and women respectively, in 2023 prices.[footnote 39]
D1.2 Aspirations to further education
Whilst aspirations to higher education are monetised under the assumption that these aspirations refer to first degrees only, the monetisation of aspirations to further education are complicated by the different levels of qualification that may be achieved. This analysis combines the following data sources to estimate the probability that aspirations to further education will feed through to gaining a further education qualification at Level 2, Level 3 or Level 4 and above. Where possible, calculations are made using as many academic years for which data are available, to ensure that the analysis is not influenced by fluctuations in specific academic years (e.g. possibly relating to COVID-19).
- Pass-through rate from aspiring to undertake further vocational education at age 16 to continuing on a vocational path in Year 12
This is taken from McIntosh (2019) and is estimated at 72.2%. This is again calculated through an average of both LSYPE cohorts, weighted by the number of individuals in each cohort.
- The proportion of 16 to 18 year old vocational students aiming for each level of qualification
This is estimated using UK government statistics on further education and skills participation,[footnote 40] using an average across five academic years (between 2019 to 2020 and 2023 to 2024) weighted by the size of each cohort. It is estimated that around 47.6% of 16 to 18 year old vocational students were on a Level 2 course, 47.2% were on a Level 3 course, and 5.2% were studying for a Level 4+ qualification.
- Achievement rates among 16 to 18 year old vocational students by level of qualification
Using Department for Education data,[footnote 41] we estimate the completion rates associated with each level of qualification for 16 to 18 year olds. This is an average of the achievement rates across the 2020 to 2021, 2021 to 2022 and 2022 to 2023 academic years. We also average the achievement rates across the following four qualification types, which are most likely to relate to predominately vocational qualifications: “Award”, “Certificate”, “Diploma” and “Access to HE”. These achievement rates are weighted by the number of leavers associated with each qualification type and academic year. We estimate achievement rates of 81.0%, 84.4% and 86.0% for Level 2, 3 and 4+ respectively.
- Pass-through rate from vocational study at 16-18 years old to vocational study at post-18 level
Again, this is estimated using Department for Education statistics, specifically relating to 16 to 18 destinations.[footnote 42] We only consider students that were studying at state-funded mainstream colleges at 16 to 18 years old, excluding sixth form colleges (which relate to more academic forms of study). We treat students with an unknown destination post-16 as missing data and re-allocate them proportionally across all possible destinations. Data relating to the 2020 to 2021 and 2021 to 2022 academic years are considered, and an average is taken across these academic years weighted by the number of students in each cohort. Under this approach, we estimate a pass-through rate of 20.9% - in other words, of students completing a vocational qualification aged 16 to 18, around one in five will continue to further vocational study post-18.
- Achievement rates among 19+ year old vocational students by level of qualification
We assume that students who continue on a vocational route post-18 aim to start a qualification one level above the level previously studied – for example, someone studying a Level 2 qualification at age 16 to 18 would go on to study a Level 3 qualification at post-18 level. Therefore, we consider the achievement rates among older students relating to the qualification one level above the one studied at 16 to 18 years old. Using the same data source and approach as for achievement rates for 16 to 18 year old students outlined above, we estimate achievement rates of 86.1% for Level 2 qualifications, 76.0% for Level 3 study, and 69.9% for qualifications at Level 4 and above.
Combining the data sources outlined above, we can estimate the pass-through from the initial aspirations to undertake vocational study to achieving a qualification at each level by calculating the proportion of individuals on each ‘path’ of further education. By summing the proportion of students on each path (which results in a given qualification level), we can estimate the total proportion of students that achieve each qualification level. This is shown in more detail in Figure D.1.
It is therefore estimated that of those that have aspirations at age 16 to enter vocational education in Year 12, 23.4% leave vocational education with a Level 2 qualification, 29.0% leave with a Level 3 qualification, and 7.4% leave with a Level 4 qualification or above.
These proportions can then be combined with the estimated learner and Exchequer benefits associated with each qualification level to derive the overall monetised benefit associated with increased aspirations to further education. More details of the analysis undertaken to estimate these learner and Exchequer benefits are presented later in this annex.
Figure D.1 Flow diagram from aspirations to further education at age 16 and achieving each level of qualification
D1.3 Aspirations to apprenticeships
Unlike aspirations to further education, we assume that following an apprenticeship at 16 to 18 years old, the apprentice enters the labour force directly and does not acquire any further vocational education. Therefore, the assumptions used to estimate the proportion of apprentices completing an apprenticeship at each level are simpler than those for further education. These proportions are estimated using the following three steps:
- Pass-through rate from aspiring to undertake an apprenticeship at age 16 to starting on an apprenticeship in Year 12:
As the McIntosh paper does not provide specific estimates for apprenticeships, we assume the same pass-through rate from aspirations at age 16 to participation in apprenticeships as for further education (72.2%).
- The proportion of 16 to 18 year old apprentices aiming for each level of apprenticeship:
Using the most recent available data published by the Department for Education,[footnote 43] we estimate the proportion of 16 to 18 year old apprentices at each level of apprenticeship, taking a weighted average of the 2020 to 2021, 2021 to 2022 and 2022 to 2023 academic years. The data shows that 50.6% of apprentices in this age group were aiming for a Level 2 apprenticeship, 44.9% were completing a Level 3 apprenticeship, and the remaining 4.4% were training at Level 4 or above.
- Achievement rates among 16 to 18 year old apprentices by level of apprenticeship:
Again using Department for Education data,[footnote 44] the completion rates associated with each level of apprenticeship for 16 to 18 year olds are estimated. This is again a weighted average of the achievement rates across the 2020 to 2021, 2021 to 2022 and 2022 to 2023 academic years. We estimate achievement rates of 54.1%, 59.6% and 66.0% for apprenticeships at Level 2, 3 and 4+ respectively.
For each apprenticeship level, we multiply a) the pass-through rate from aspirations to starting an apprenticeship, b) the proportion of 16 to 18 year old apprentices starting at the qualification level and c) the achievement rate associated with that level of apprenticeship, in order to estimate the probability that aspirations will pass-through to gaining the given level of apprenticeship qualification. These probabilities are estimated at 19.8%, 19.3% and 2.1% for Levels 2, 3 and 4+ respectively.
D1.4 Estimating the net learner and Exchequer benefits associated with vocational qualifications
Here we outline the approach used to estimate the net learner and Exchequer benefits associated with further education qualifications and apprenticeships. The econometric approach undertaken to estimate the gross benefits in terms of enhanced labour market outcomes associated with these qualifications is described first. This is followed by a discussion of the costs of study, which are subtracted, to arrive at the net benefits associated with each qualification and level.
Defining the gross learner benefit and gross Exchequer benefit
To measure the economic benefits of further education qualifications and apprenticeships, we estimate the labour market value associated with these qualifications, rather than simply assessing the labour market outcomes achieved by individuals in possession of these qualifications. The standard approach to estimating this labour market value is to undertake an econometric analysis where the ‘treatment’ group consists of those individuals in possession of the qualification of interest, and the ‘counterfactual’ group consists of individuals with comparable personal and socioeconomic characteristics but with the next highest (lower) level of qualification. The rationale for adopting this approach is that the comparison of the earnings and employment outcomes of the treatment group and the counterfactual group ‘strips away’ (to the greatest extent possible with the relevant data) those other personal and socioeconomic characteristics that might affect labour market earnings and employment (such as gender, age, or sector of employment), leaving just the labour market gains attributable to the qualification itself (see Figure D.2 for an illustration of this). Throughout the analysis, the assessment of earnings and employment outcomes associated with qualification attainment (at all levels) is undertaken separately by gender, reflecting the different labour market outcomes between men and women.
Figure D.2 Estimating the gross learner benefit and gross Exchequer benefit (example for Level 2 vocational qualifications)
Note: This illustration is based on an analysis of the 2022 to 2023 cohort of further education students studying in England. We assume a mean age at enrolment for students undertaking vocational qualifications at Level 2 of 18, with a corresponding average study duration of 1 year.
To estimate the gross learner benefit, based on the results from the econometric analysis, we then estimate the present value of the enhanced post-tax earnings of individuals in possession of different further education qualifications and apprenticeships (i.e. after income tax, National Insurance and VAT are removed, and following the deduction of foregone earnings (where applicable)) relative to an individual in possession of the counterfactual qualification.
The gross benefits to the Exchequer from the provision of further education qualifications and apprenticeships are derived from the enhanced taxation receipts that are associated with a higher likelihood of being employed, as well as the enhanced earnings associated with more highly skilled and productive employees. Based on the analysis of the lifetime earnings and employment benefits associated with qualification attainment and combined with administrative information on the relevant taxation rates and bands (from HM Revenue and Customs),[footnote 45] we estimate the present value of additional income tax, National Insurance and VAT associated with further education qualification and apprenticeship attainment (by gender and level of study).
Throughout the analysis, it is assumed that those gaining further education and apprenticeship qualifications as a result of participation in NCS are undertaking full time study, with an age of enrolment of 18. Table D.1 presents the assumed average age at enrolment, study duration, and age at completion for students in the 2022 to 2023 further education and apprenticeships cohorts.[footnote 46]
Table D.1 Average age at enrolment, study duration, and age at completion for students in the 2022 to 2023 further education and apprenticeships cohorts
| Qualification level | Age at enrolment | Duration (years) | Age at completion |
|---|---|---|---|
| Level 2 Vocational | 18 | 1 | 19 |
| Level 3 Vocational | 18 | 1 | 19 |
| Level 4 Vocational | 18 | 1 | 19 |
| Level 2 Apprenticeships | 18 | 1 | 19 |
| Level 3 Apprenticeships | 18 | 2 | 20 |
| Level 4 Apprenticeships | 18 | 1 | 19 |
Qualifications and counterfactuals considered in the econometric analysis
Our econometric analysis of the earnings and employment returns to further education qualifications and apprenticeships considered:
-
Three different further education qualification groups (i.e. three ‘treatment’ groups for further education qualifications), for Level 2, Level 3 and Level 4 vocational qualifications separately; and
-
Three different apprenticeship levels, including Intermediate Apprenticeships, Advanced Apprenticeships and Higher Apprenticeships.
Table D.2 presents the different further education qualifications and apprenticeships (i.e. treatment groups) considered in the analysis, along with the associated counterfactual group used for the marginal returns analysis in each case (which is the next highest level of qualification). As outlined above, we compare the earnings of the group of individuals in possession of each further education qualification or apprenticeship to the relevant counterfactual group, to ensure that (to the greatest extent possible) we assess the economic benefit associated with the qualification itself (rather than the economic returns generated by the specific characteristics of the individual in possession of the qualification). This is a common approach in the literature and allows us to control for other personal, regional, or socioeconomic characteristics that might influence both the determinants of qualification attainment as well as earnings/employment.
Table D.2 Treatment and comparison groups used to assess the marginal earnings and employment returns to further education qualifications and apprenticeships
| Treatment group – highest qualification | Comparison group - highest qualification |
|---|---|
| FE qualifications | No data |
| Level 4 vocational qualifications | Level 3 vocational qualifications |
| Level 3 vocational qualifications | Level 2 vocational qualifications |
| Level 2 vocational qualifications | Level 1 vocational qualifications |
| Apprenticeships | No data |
| Level 4 Apprenticeships | Level 3 vocational qualifications |
| Level 3 Apprenticeships | Level 2 vocational qualifications |
| Level 2 Apprenticeships | Level 1 vocational qualifications |
Marginal earnings and employment returns to further education qualifications and apprenticeships
Marginal earnings returns
To estimate the impact of qualification attainment on earnings, using information from the Labour Force Survey (LFS), we estimated a standard ordinary least squares linear regression model, where the dependent variable is the natural logarithm of hourly earnings, and the independent variables include the full range of qualifications held alongside a range of personal, regional, and job-related characteristics that might be expected to influence earnings. In this model specification, we included individuals who were employed on either a full-time or a part-time basis. This approach has been used widely in the academic literature.
The basic specification of the model was as follows:
Where ln(Wi) represents the natural logarithm of hourly earnings, Ei represents an error term, α represents a constant term, i is an individual LFS respondent, and Xi provides the independent variables included in the analysis, as Table D.3
Table D.3. Independent variables included in analysis
| Variable |
|---|
| Highest qualification held |
| Age |
| Age squared |
| Ethnic origin |
| Disability status |
| Region of work |
| Marital status |
| Number of dependent children under the age of 16 |
| Full time/ part time employment |
| Temporary or permanent contract |
| Public or private sector employment |
| Workplace size |
| Yearly dummies |
Using the above specification, we estimated earnings returns in aggregate and for men and women separately. Further, to analyse the benefits associated with different education qualifications over the lifetime of individuals holding these qualifications, where possible, the regressions were estimated separately across a range of different age bands for the working age population, depending on the qualification considered.[footnote 47] The analysis of earnings premiums was undertaken at a national (UK-wide) level.
To estimate the impact of further education qualifications and apprenticeships on labour market outcomes using this methodology, we used information from pooled Quarterly UK Labour Force Surveys between Q1 2010 and Q4 2023.
The resulting estimated marginal wage returns to the different qualifications of interest are presented in Table D.4. In the earnings regressions, the coefficients provide an indication of the additional effect on hourly earnings associated with possession of the respective qualification/apprenticeship relative to the counterfactual level of qualification:
-
For Level 4 apprenticeships only, the underlying sample sizes within the LFS data were too small to produce any meaningful results when breaking the estimates down by age band. Therefore, in this instance we estimate and apply average marginal earnings and employment returns across all ages/age bands. For example, the analysis suggests that men in possession of a Level 4 apprenticeship qualification achieve a 24.2% hourly earnings premium (on average across all ages/age bands) compared to comparable men with Level 3 vocational qualifications. The corresponding estimate for women stands at 21.3%.
-
For all other qualifications, it was possible to estimate separate marginal earnings (and employment) returns by age band. For example, the analysis suggests that men aged between 31 and 35 in possession of a Level 3 further education qualification achieve a 15.0% hourly earnings premium compared to comparable men holding a Level 2 vocational qualification as their highest level of attainment. The comparable estimate for women aged between 31 and 35 stands at 9.5%.
Table D.4 Marginal earnings returns to further education qualifications and apprenticeships, in % (following exponentiation), by gender and age band
| Men: Qualification level (vs. counterfactual) | Age band: 16 to 20 | Age band: 21 to 25 | Age band: 26 to 30 | Age band: 31 to 35 | Age band: 36 to 40 | Age band: 41 to 45 | Age band: 46 to 50 | Age band: 51 to 55 | Age band: 56 to 60 | Age band: 61 to 65 |
|---|---|---|---|---|---|---|---|---|---|---|
| Level 2 FE (vs. Level 1 vocational) | No data | 12.3% | No data | 11.2% | 9.1% | 15.0% | 8.5% | 11.1% | No data | No data |
| Level 3 FE (vs. Level 2 vocational) | No data | 9.0% | 13.1% | 15.0% | 20.8% | 24.9% | 19.0% | 19.2% | 21.7% | 23.6% |
| Level 4 FE (vs. Level 3 vocational) | No data | 10.8% | 12.5% | 19.7% | 19.7% | 20.2% | 28.0% | 31.1% | 27.4% | 31.5% |
| Level 2 App. (vs. Level 1 vocational) | No data | 24.1% | 21.5% | 30.0% | 23.7% | 36.1% | 24.2% | 28.8% | 22.0% | 10.2% |
| Level 3 App. (vs. Level 2 vocational) | 12.9% | 26.4% | 27.6% | 25.1% | 26.7% | 19.5% | No data | No data | 30.7% | 36.8% |
| Level 4 App. (vs. Level 3 vocational)1 | 24.2% | 24.2% | 24.2% | 24.2% | 24.2% | 24.2% | 24.2% | 24.2% | 24.2% | 24.2% |
| Women: Qualification level (vs. counterfactual) | Age band: 16 to 20 | Age band: 21 to 25 | Age band: 26 to 30 | Age band: 31 to 35 | Age band: 36 to 40 | Age band: 41 to 45 | Age band: 46 to 50 | Age band: 51 to 55 | Age band: 56 to 60 | Age band: 61 to 65 |
|---|---|---|---|---|---|---|---|---|---|---|
| Level 2 FE (vs. Level 1 vocational) | No data | No data | No data | 8.0% | No data | No data | No data | 11.0% | No data | No data |
| Level 3 FE (vs. Level 2 vocational) | No data | 5.1% | 7.9% | 9.5% | 12.7% | 12.1% | 10.2% | 10.2% | 12.3% | 7.1% |
| Level 4 FE (vs. Level 3 vocational) | 8.9% | No data | 10.4% | 10.4% | 18.4% | 22.6% | 23.4% | 23.4% | 19.7% | 21.9% |
| Level 2 App. (vs. Level 1 vocational) | No data | No data | No data | 20.3% | No data | 12.1% | No data | 14.0% | No data | No data |
| Level 3 App. (vs. Level 2 vocational) | No data | 10.5% | 13.2% | 13.1% | No data | 12.7% | 14.3% | 26.4% | -12.5% | No data |
| Level 4 App. (vs. Level 3 vocational)* | 21.3% | 21.3% | 21.3% | 21.3% | 21.3% | 21.3% | 21.3% | 21.3% | 21.3% | 21.3% |
*The returns to Level 4 vocational qualifications were not estimated separately across different age bands. In this instance, we estimated average returns across all ages/age bands, due to relatively limited underlying sample sizes within the LFS data.
Note: In cases where the estimated coefficients are not statistically significantly different from zero (at the 10% level), the coefficient is assumed to be zero; these are displayed as gaps in the table.
Marginal employment returns
To estimate the impact of qualification attainment on employment, we adopted a probit model to assess the likelihood of different qualification holders being in employment or otherwise. The basic specification defines an individual’s labour market outcome to be either in employment (working for payment or profit for more than 1 hour in the reference week (using the standard International Labour Organisation definition)) or not in employment (being either unemployed or economically inactive). The specification of the probit model was as follows:
Figure D.4 Probit model specification[footnote 48]
The dependent variable adopted represents the binary variable EMPNOTi, which is coded 1 if the individual is in employment and 0 otherwise.[footnote 49] We specified the model to contain a constant term (α) as well as a number of standard independent variables, including the qualifications held by an individual (represented by Zi in the above equation), as Table D.5.
Table D.5. Independent variables included in analysis
| Variable |
|---|
| Highest qualification held |
| Age |
| Age squared |
| Ethnic origin |
| Disability status |
| Region of usual residence |
| Marital status |
| Number of dependent children under the age of 16 |
| Yearly dummies. |
Again, Ei represents an error term. Similar to the methodology for estimating earnings returns, the above-described probit model was estimated in aggregate and separately for men and women, with the analysis further split by respective age bands (again, for all qualifications except Level 4 apprenticeships). Further, and again similar to the analysis of earnings returns, employment returns were estimated at the national (i.e. UK-wide) level.
The resulting estimated marginal employment returns are presented in Table C.6. The returns here provide estimates of the impact of each qualification on the probability of being in employment (expressed in percentage points):
-
Again, for Level 4 apprenticeships only, we estimate and apply average marginal earnings and employment returns across all ages/age bands. For example, the analysis suggests that men in possession of a Level 4 apprenticeship are 8.0 percentage points more likely to be in employment (on average across all ages/age bands) than comparable men with no formal qualifications. The corresponding estimate for women stands at 10.5 percentage points.
-
For all other qualifications, we estimated separate returns by age band. For example, the analysis estimates that a man aged between 31 and 35 in possession of a Level 3 vocational qualification is 5.9 percentage points more likely to be in employment than a man of similar age holding only a Level 2 vocational qualification as their highest level of attainment. The comparable estimate for women aged between 31 and 35 stands at 6.7 percentage points.
Table D.6 Marginal employment returns to further education qualifications and apprenticeships, in percentage points, by gender and age band
| Men: Qualification level (vs. counterfactual) | Age band: 16 to 20 | Age band: 21 to 25 | Age band: 26 to 30 | Age band: 31 to 35 | Age band: 36 to 40 | Age band: 41 to 45 | Age band: 46 to 50 | Age band: 51 to 55 | Age band: 56 to 60 | Age band: 61 to 65 |
|---|---|---|---|---|---|---|---|---|---|---|
| Level 2 FE (vs. Level 1 vocational) | 22.1 | 22.6 | 11.4 | 9.8 | 10.4 | 11.9 | 8.2 | 5.7 | 5.7 | No data |
| Level 3 FE (vs. Level 2 vocational) | No data | 6.5 | 8.0 | 5.9 | 3.9 | 3.2 | 4.5 | 5.2 | No data | -5.3 |
| Level 4 FE (vs. Level 3 vocational) | No data | 3.3 | No data | 1.8 | 3.5 | No data | 1.2 | 1.8 | No data | No data |
| Level 2 App. (vs. Level 1 vocational) | 33.9 | 30.0 | 23.3 | 10.5 | 10.7 | 9.2 | 8.2 | 7.8 | No data | No data |
| Level 3 App. (vs. Level 2 vocational) | 19.2 | 13.3 | 9.9 | 6.8 | 11.1 | No data | 11.6 | No data | No data | No data |
| Level 4 App. (vs. Level 3 vocational)* | 8.0 | 8.0 | 8.0 | 8.0 | 8.0 | 8.0 | 8.0 | 8.0 | 8.0 | 8.0 |
| Women: Qualification level (vs. counterfactual) | Age band: 16 to 20 | Age band: 21 to 25 | Age band: 26 to 30 | Age band: 31 to 35 | Age band: 36 to 40 | Age band: 41 to 45 | Age band: 46 to 50 | Age band: 51 to 55 | Age band: 56 to 60 | Age band: 61 to 65 |
|---|---|---|---|---|---|---|---|---|---|---|
| Level 2 FE (vs. Level 1 vocational) | 18.0 | 17.1 | 17.8 | 21.4 | 17.9 | 18.7 | 9.2 | 5.5 | 10.5 | 8.3 |
| Level 3 FE (vs. Level 2 vocational) | 11.3 | 12.0 | 8.1 | 6.7 | 8.5 | 4.8 | 5.8 | 3.0 | No data | No data |
| Level 4 FE (vs. Level 3 vocational) | No data | No data | No data | 3.8 | 2.1 | 2.5 | No data | -1.9 | -3.7 | -4.1 |
| Level 2 App. (vs. Level 1 vocational) | 32.8 | 26.5 | 19.4 | 23.9 | 24.1 | 17.8 | 9.2 | No data | No data | No data |
| Level 3 App. (vs. Level 2 vocational) | 26.3 | 17.8 | 11.9 | 15.2 | 9.7 | 9.8 | 15.8 | 15.9 | 15.0 | No data |
| Level 4 App. (vs. Level 3 vocational)* | 10.5 | 10.5 | 10.5 | 10.5 | 10.5 | 10.5 | 10.5 | 10.5 | 10.5 | 10.5 |
*The returns to Level 4 vocational qualifications were not estimated separately across different age bands. In this instance, we estimated average returns across all ages/age bands, due to relatively limited underlying sample sizes within the LFS data.
Note: In cases where the estimated coefficients are not statistically significantly different from zero (at the 10% level), the coefficient is assumed to be zero; these are displayed as gaps in the table.
Estimating the gross learner benefit and gross Exchequer benefit
The gross learner benefit associated with qualification attainment is defined as the present value of enhanced post-tax earnings (i.e. after income tax, National Insurance and VAT are removed, and following the deduction of foregone earnings) relative to an individual in possession of the counterfactual qualification. To estimate the value of the gross graduate premium, it is necessary to extend the econometric analysis (presented above) by undertaking the following elements of analysis (separately by qualification level and gender):
-
We estimated the employment-adjusted annual earnings achieved by individuals in the counterfactual groups (see above for more detail), using pooled Quarterly UK Labour Force Survey data between Q1 2010 and Q4 2023.
-
We inflated these baseline or counterfactual earnings using the marginal earnings premiums and employment premiums (presented in Table C.4 and Table C.6 above) to produce annual age-earnings profiles associated with the possession of each particular qualification.
-
We adjusted these age-earnings profiles to account for the fact that earnings are expected to increase over time (based on average annual earnings growth rate forecasts estimated by the Office for Budget Responsibility.[footnote 49] [footnote 50]
-
Based on the earnings profiles generated for individuals in possession of each particular qualification of interest, and income tax and National Insurance rates and allowances for the relevant year,[footnote 51] we computed the future stream of net (i.e. post-tax) earnings.[footnote 52] Using similar assumptions, we further calculated the stream of (employment-adjusted) foregone earnings (based on earnings in the relevant counterfactual group)[footnote 53] during the period of study, again net of tax.
-
We calculated the discounted stream of additional (employment-adjusted) future earnings compared to the relevant counterfactual group (using a standard real discount rate of 3.5% (Years 1 to 30) and 3.0% (Years 31+) as outlined in HM Treasury Green Book)[footnote 54], and the discounted stream of foregone earnings during qualification, to generate a present value figure. We thus arrive at the gross learner benefit.
-
The discounted stream of enhanced taxation revenues minus the tax income foregone during students’ qualification attainment derived in element 4 provides an estimate of the gross public benefit associated with qualification attainment.
Estimating the net learner benefit and net Exchequer benefit
The difference between the gross and net learner benefit relates to students’ direct costs of qualification acquisition.[footnote 55] However, for both further education qualifications and apprenticeships, there are assumed to be no direct costs to the individual. In fact, in the case of apprenticeships, these learners benefit from receiving apprentice wages during their training, and these net (after-tax) wages constitute a significant benefit associated with apprentice training.[footnote 56]
Similarly, the difference between the gross and net Exchequer benefit relates to the direct costs to the public purse associated with funding education provision:
-
For further education qualifications, the direct Exchequer costs of funding these qualifications are set to the spending per student by further education colleges in the 2022-23 academic year, as estimated by the Institute for Fiscal Studies (2022). We assume that these costs are the same across all levels of study in the absence of more granular data.
-
For apprenticeships, we set the direct Exchequer costs to zero. Whilst the Exchequer does fund apprenticeships through the Apprentice Levy, the Exchequer consistently makes a surplus on apprenticeship funding as the amount received through the Levy is greater than the total (Levy and non-Levy) spend on apprenticeships by the Exchequer.[footnote 57] In addition, and as a key Exchequer benefit during training (rather than a cost), the Exchequer accrues the tax receipts (again including income tax, National Insurance employee and employer contributions, and VAT) associated with the apprentice wages received by learners during their training.
These direct costs and direct benefits associated with qualification attainment to both students and the Exchequer (by qualification level) are calculated from start to completion of a student’s learning aim (i.e. over the entire expected study/training duration). Throughout the analysis, to ensure that the economic impacts are computed in present value terms (i.e. in 2022-23 money terms), all benefits and costs occurring at points in the future were discounted using the standard HM Treasury Green Book real discount rates of 3.5%/3.0%.[footnote 58]
Deducting the resulting individual and Exchequer costs from the estimated gross learner and gross public purse benefit,[footnote 59] respectively, we arrive at the estimated net learner benefit and net public purse benefit per student (presented later in this Annex).
Estimating net apprentice pay during training
While incurring the (indirect) costs of foregone earnings associated with the baseline/counterfactual group level of qualification, apprentice learners receive apprentice wages during their training.
To estimate these benefits for the 2022-23 cohort of apprentices, we made use of the Department for Education’s 2021 Apprenticeship Evaluation Learner Survey.[footnote 60] The survey provides detailed information on the average hourly pay[footnote 61] and number of actual hours per week[footnote 62] among apprentices in England in 2021, with separate breakdowns available by gender, age band (16 to 18, 19 to 24, and 25+), and RQF level.
Given that the original survey results are only published separately by either gender, age band, or level, we first estimated a combined breakdown of apprentice wages across all three of these dimensions. Specifically, we first estimated a breakdown by age band and level, by multiplying the pay rates by level by the ratio of overall average hourly pay for each age band relative to the overall average hourly pay for all apprentices (i.e. we assume the same pay distribution by age band across all apprenticeship levels). We then proceeded similarly to estimate the breakdown by level, age band, and gender, assuming the same pay distribution by gender across all age bands and levels.
To estimate aggregate (net) apprentice pay over the total study duration, we then undertook the following calculation steps:
-
By combining the above average hourly pay rates with the associated average number of hours worked per week (again based on the 2021 Apprenticeship Evaluation Learner Survey) and the average number of weeks per year (52.2), we calculated average annual earnings in 2022 to 2023 (adjusted to 2022 to 2023 values using information on the UK average nominal earnings growth rate in 2022 to 2023 published by the Office for Budget Responsibility (2024)). Table C.7 presents our resulting estimated annual apprentice pay rates in 2022 to 2023 by gender, age band and level.
-
Using the assumptions on the average age at which apprentice learners in the 2022 to 2023 cohort start their training and the assumed average duration of training (by level),[footnote 63] we estimated the total gross (i.e. pre-tax) apprentice earnings per learner over the total study duration.
-
As with earnings post-completion, we adjusted the estimates to account for Office for Budget Responsibility forecasts of average nominal earnings growth for the UK.[footnote 64]
-
Based on the relevant income tax and National Insurance employee contribution rates and thresholds, we then computed the stream of net (post-tax) apprentice earnings.
-
Finally, we again discounted the results to NPV terms in 2022 to 2023 prices.
Table D.7 Average apprentice pay in England: Estimated annual pay by gender, age band, and apprenticeship level
| Age band | Male: Level 2 | Male: Level 3 | Male: Level 4 | Female: Level 2 | Female: Level 3 | Female: Level 4 |
|---|---|---|---|---|---|---|
| 16 to 18 | £12,200 | £13,700 | £18,900 | £11,300 | £12,700 | £17,600 |
| 19 to 24 | £17,700 | £19,900 | £27,500 | £16,500 | £18,500 | £25,500 |
| 25+ | £21,900 | £24,600 | £33,900 | £20,300 | £22,800 | £31,500 |
Note: All pay rates are presented in 2023 prices and rounded to the nearest £100.
Estimated net learner and Exchequer benefit
Table D.8 presents the estimated net learner benefits and public purse benefits per student associated with further education qualification and apprenticeship attainment based on the 2022 to 2023 cohort of starters, broken down by level of study and gender, resulting from the above-outlined analysis.
Table D.8 Net learner and Exchequer benefits per student associated with further education qualification and apprenticeship attainment, by level of study and gender
| Qualification type | Qualification level | Net learner benefit: male | Net learner benefit: female | Net Exchequer benefit: male | Net Exchequer benefit: female |
|---|---|---|---|---|---|
| Apprenticeships | Level 2 | £161,000 | £87,000 | £115,000 | £14,000 |
| Apprenticeships | Level 3 | £138,000 | £90,000 | £109,000 | £45,000 |
| Apprenticeships | Level 4 | £209,000 | £121,000 | £171,000 | £93,000 |
| Vocational education | Level 2 | £78,000 | £64,000 | £47,000 | £3,000 |
| Vocational education | Level 3 | £89,000 | £45,000 | £74,000 | £16,000 |
Note: Estimates are rounded to the nearest £1,000 and presented in 2023 prices.
D1.5 Volunteering
To estimate the economic benefits associated with volunteering, we first use data from the ASHE[footnote 65] to estimate the wage rate that a young person could achieve in the labour market. The median wage rate for a young person’s relevant age category is used, which was £8.00 per hour for those aged 16 to 17 and £10.89 per hour for those aged 18 to 21 in 2023. As we consider the benefits of volunteering into the medium term, the assumptions regarding wage rates are changed as individuals age. Specifically, the wage rates used are calculated as follows:
-
In the first year after NCS participation, the median wage rate for 16 to 17-year-olds of £8.00 per hour is used.
-
To take account of some participants turning 18, an average of the two rates (£9.45 per hour) was applied to additional volunteering hours in the second year following participation.
-
The calculations from month 25 post-participation onwards used the median wage rate for 18 to 20-year-olds of £10.89 per hour.
Next, assumptions from previous NCS evaluations are used to understand the extent to which volunteering as a result of the NCS programme is likely to persist. For example, additional follow-on evaluations of the 2013 NCS programme found a lasting impact of the programme on volunteering, with programme participants contributing significantly higher rates of volunteering up to 28 months after completion.[footnote 66] Further, it is also assumed that the effect of the NCS programme on volunteering activity remains constant in the first 15 months post-participation, before diminishing at a constant rate to zero by the 27th month, which is consistent with the effect sizes found in the follow-on evaluations of the 2013 NCS programme.
Lastly, the economic analysis of streams of future benefits or costs requires discounting in order to make them comparable to benefits and costs accruing in the present. As in the estimation of the net learner and Exchequer benefits of vocational qualifications, we follow Green Book guidance[footnote 67] and use the standard 3.5% discount rate for any benefits which occur after the first 12 months of NCS participation.
D1.6 Non-cognitive skills
First, we consider the wider literature to estimate the monetary benefits associated with increases in non-cognitive skills, specifically utilising a meta-analysis by Cabus et al. (2021).[footnote 68] They compile over 300 estimates linking earnings to measures of non-cognitive skill and provide estimates for the effect of increasing non-cognitive skill on labour market earnings. The central estimate in this paper suggests that a one standard deviation increase in non-cognitive skills is associated with a 3.2% increase in lifetime earnings.
This can be combined with data from the Office for National Statistics[footnote 69] relating to human capital per head, which is equivalent to total lifetime earnings per person, to calculate the expected earnings premium associated with increases in non-cognitive skills. Considering 16 to 25 year olds, using 2023 prices, it is estimated that average lifetime earnings per head are £1.3 million for men and £0.9 million for women. These figures are already adjusted for present value (i.e. discounted following Green Book guidance) and consider only those that are employed (which is preferred in order to account for potential future unemployment). Combining these figures with the findings from Cabus et al. (2021) (i.e. multiplying these average lifetime earnings by 3.2%), an increase in non-cognitive skills of one standard deviation would therefore be associated with an increase in earnings of £41,000 for male participants and £29,000 for female participants.
Next, we utilise estimates from the impact evaluation relating to a set of non-cognitive skills, Table D.9
Table D.9. Non-cognitive skills in scope for economic evaluation
| Non-cognitive skills |
|---|
| Leadership |
| Teamwork |
| Creativity |
| Listening and speaking |
| Empathy |
| Problem solving |
| Initiative |
| Responsibility |
| Emotion management |
To combine these skills into one ‘non-cognitive skills’ score, the following three steps are taken:
-
Survey responses are re-coded in a consistent way, so that a higher score indicates a higher level of that specific element of non-cognitive skill, and all responses are coded on a scale of 1 to 5.
-
For each of the nine non-cognitive outcome measures listed above, the average of the observed scores for each individual for survey questions relating to that measure is taken.[footnote 70]
-
For each individual, the average of the resulting scores across all nine measures included in the non-cognitive skill indicator is taken.
D1.7 Life satisfaction
Used during the top-down approach, impacts of the NCS programme on life satisfaction are estimated through a survey question asking respondents to report how satisfied they are with their life nowadays, on a scale of 0 to 10.
Movements along this scale associated with increases or decreases in life satisfaction can be monetised through the use of wellbeing adjusted life years (WELLBYs). A WELLBY is defined as “one statistical unit of life-satisfaction on a 0 to 10 scale for one person for one year”, as per the Green Book.[footnote 71] According to the Green Book, a WELLBY is valued between £10,000 and £16,000 in 2019 prices depending on the approach used, resulting in a central estimate of £13,000. To update these figures to 2023 prices, we use data on changes in the gross domestic product (GDP) deflator[footnote 72] and GDP per capita[footnote 73] between 2019 and 2023 as per the following formula presented in the Green Book:
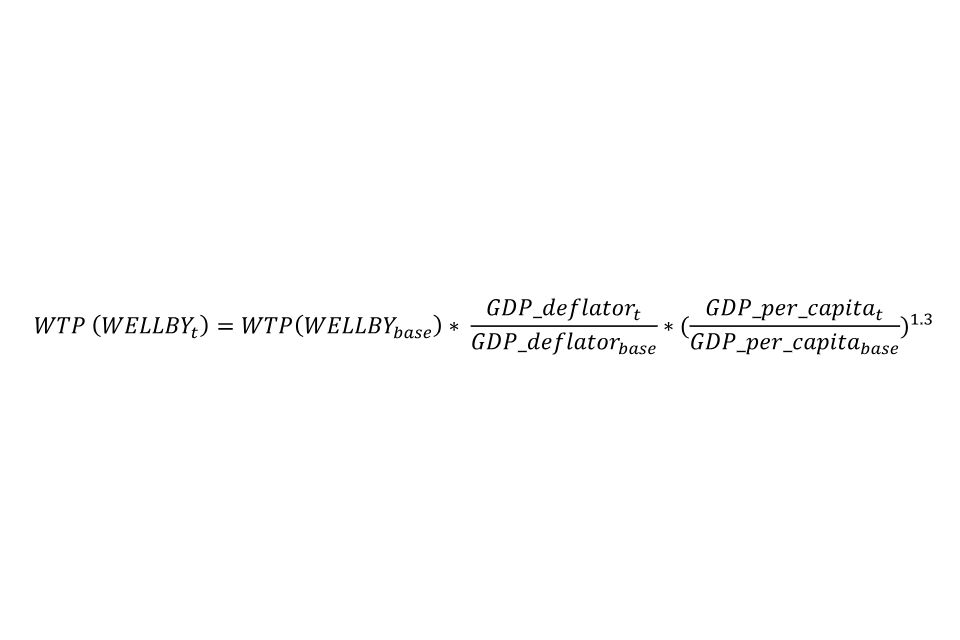
The resulting low and high estimates calculated through this approach are £11,737 and £18,779 respectively, resulting in a central estimate of the value of a WELLBY in 2023 prices of £15,258.
D2. Presentation of low and high estimates of value for money
Given the inherent uncertainty surrounding the estimation of the impacts through the use of survey data, to generate a range of values the benefit-cost ratios could take, the high and low estimates of value for money are presented in this section. High and low estimates of economic impact were generated by applying the 95% confidence interval around the central impact estimates and applying the same value for money calculations as presented in the main report and previously in this Annex.
D2.1 Low, central and high impact estimates
Table D.10 presents the low, central and high impact estimates for each of the benefits considered within the value for money evaluation, separately by sex.
With the exception of aspirations to higher education among male participants, all of the impact estimates were insignificant to the 5% level. As a result, the low estimates for each of these impact estimates were negative. However, as it is unrealistic to attribute negative economic benefits to the programme for any of the impacts considered, these impacts are instead set to zero.
The central estimates are the same as those presented in the main report. The central estimate for some impacts was also negative, including for aspirations to apprenticeships and for non-cognitive skills for both male and female participants. Again, these impacts are instead set to zero. However, in all cases where we see a negative central point estimate, the result is insignificant to the 5% level. This means that the high impact estimate is greater than zero for all impacts for both male and female participants.
Table D.10 Low, central and high impact estimates used in the value for money evaluation by sex
| Impact | Low: Male | Low: Female | Central: Male | Central: Female | High: Male | High: Female |
|---|---|---|---|---|---|---|
| Aspirations to higher education | 0.1% | 0.0% | 7.5% | 1.0% | 14.8% | 5.8% |
| Aspirations to further education | 0.0% | 0.0% | 0.0% | 0.4% | 2.9% | 3.3% |
| Aspirations to apprenticeships | 0.0% | 0.0% | 0.0% | 0.0% | 4.4% | 1.4% |
| Volunteering after the programme | 0.0 | 0.0 | 2.4 | 1.0 | 5.3 | 2.9 |
| Non-cognitive skills | 0.0% | 0.0% | 0.0% | 0.0% | 11.6% | 8.1% |
| Life satisfaction | 0.0 | 0.0 | 0.1 | 0.0 | 0.5 | 0.2 |
Note: Any negative point estimates from the impact evaluation are set to zero for the purposes of the value for money analysis. The aspirations to education estimates are presented as percentage changes in the likelihood of aspiring to attend the given type of education. Estimates relating to volunteering are presented in additional hours of volunteering supplied per month. The non-cognitive skills score impacts are in terms of a percent of a standard deviation. Life satisfaction impacts are presented in terms of movements along the 0-10 scale.
D2.2 Value for money under the ‘bottom-up’ approach
Table D.11 presents the value for money assessment under the bottom-up approach utilising the low, central and high impact estimates. The central estimate of the gross benefits of the NCS residential programme under this approach is £57.6m, with a range from £0.8m to £273.0m. The wide range in the size of the gross benefits under the bottom-up approach indicates the inherent uncertainty surrounding the impact estimates.
To calculate the net benefits associated with the residential service line, we consider the parental contribution associated with participation (of £1.0m) and subtract this from the gross benefits. We estimate that the net benefits therefore range from -£0.2m to £272.0m.
When compared to the costs of the programme of £18.8m, we therefore calculate benefit-cost ratios ranging between -0.01 and 14.44 under the bottom-up approach, with a central estimate of 3.01.
Table D.11 Value for money assessment under the bottom-up approach
| Low | Central | High | |
|---|---|---|---|
| Higher education | £0.8 million | £51.2 million | £119.0 million |
| Further education | £0.0 million | £1.4 million | £34.1 million |
| Apprenticeships | £0.0 million | £0.0 million | £45.7 million |
| Volunteering after the programme | £0.0 million | £5.0 million | £12.4 million |
| Non-cognitive skills score | £0.0 million | £0.0 million | £61.8 million |
| Gross benefits | £0.8 million | £57.6 million | £273.0 million |
| Net benefits | -£0.2 million | £56.7 million | £272.0 million |
| Costs | £18.8 million | £18.8 million | £18.8 million |
| Benefit-cost ratio | -0.01 | 3.01 | 14.44 |
D2.3 Value for money under the ‘top-down’ approach
The low, central and high estimates of value for money under the top-down approach are presented in Table D.10. As the impact estimates for both male and female participants in relation to life satisfaction were insignificant to the 5% level, the low estimate of gross benefits under this approach is £0.0 million. The central estimate of the gross benefits is £15.0 million, and the high estimate is £86.7 million.
Taking into account the parental contribution to the NCS residential programme, we estimate net benefits under the top-down approach between -£1.0 million and £85.7 million. As a result, the benefit-cost ratios calculated are between -0.05 and 4.55, with a central estimate of 0.74.
Table D.12 Value for money assessment under the top-down approach
| Low | Central | High | |
|---|---|---|---|
| Life satisfaction | £0.0 million | £15.0 million | £86.7 million |
| Gross benefits | £0.0 million | £15.0 million | £86.7 million |
| Net benefits | -£1.0 million | £14.0 million | £85.7 million |
| Costs | £18.8 million | £18.8 million | £18.8 million |
| Benefit-cost ratio | -0.05 | 0.74 | 4.55 |
D3. Value for money reference list
Cabus, S., Napierala, J., & S. Carretero. (2021). “The returns to non-cognitive skills: a meta-analysis.”
Department for Education. (2022). ‘Apprenticeship evaluation 2021: Learner and employer surveys.’
Department for Education. (2024a). “Further education and skills - Learner characteristics - Participation, Achievement by Age, LLDD, Primary LLDD, Ethnicity, Provision Type.”
Department for Education. (2024b). “Further education and skills - Achievement Rates - Headlines by Age, Level, Qualification Type, SSA T1.”
Department for Education. (2024c). “16-18 destination measures - 16-18 National level destinations.”
Department for Education. (2024d). “Apprenticeships - Achievement Rates Learner Characteristics - Volumes and Rates by Level, Age, Sex, LLDD, Ethnicity.”
Department for Education. (2024e). “Apprenticeships - Duration, Starts by Level, Age, Length of employment.”
FE Week. (2023). “Apprenticeship levy turns into Treasury ‘cash cow’.”
Hanemann, M., Loomis, J., & Kanninen, B. (1991). “Statistical Efficiency of Double-Bounded Dichotomous Choice Contingent Valuation.”
HESA. (2023). “Non-continuation summary: UK Performance Indicators.”
HM Treasury. (2013). Green Book supplementary guidance: stated preference techniques.
HM Treasury. (2022). The Green Book, Central Government Guidance on Appraisal and Evaluation.
Institute for Fiscal Studies. (2022). Annual report on education spending in England: 2022.
Ipsos MORI. (2015). National Citizen Service 2013 Evaluation – One Year On: Main Report.
Ipsos MORI. (2017). National Citizen Service 2013 Evaluation – Two Years On: Main Report.
London Economics. (2024). “The economic impact of higher education teaching, research, and innovation.”
McIntosh, S. (2019). “Post-16 Aspiration and Outcomes: Comparison of the LSYPE Cohorts.” Department for Education.
NCS Trust Annual Business Plan 2023/24. (2023).
Office for Budget Responsibility (2024). ‘Economic and fiscal outlook – March 2024.’
Office for National Statistics. (2023a). Families and households in the UK: 2022.
Office for National Statistics. (2023b). “Earnings and hours worked, age group: ASHE Table 6.”
Office for National Statistics. (2024a). “Human capital stocks estimates in the UK: 2004 to 2022.”
Office for National Statistics. (2024b). “GDP – data tables- Quarter 1 (Jan to Mar) 2024, quarterly national accounts edition of this dataset.” Dataset MNF2.
Office for National Statistics. (2024c). “Gross domestic product (Average) per head, CVM market prices: SA.”
UK Parliament. (2024). “Apprentices: Taxation.”
Annex E: Summary of findings against evaluation questions (Combined results for Year 1 and Year 2)
| Strand | Evaluation question | Summary of findings |
|---|---|---|
| Process evaluation | Implementation and delivery: Are the new service lines being implemented as intended, and how well has implementation and delivery gone? |
In-person (residential and community) service lines were broadly implemented as intended, although delivery models evolved over time in response to learnings and young person feedback. The digital service line evolved significantly beyond what was initially envisaged, resulting in significant delays to implementation, but also providing useful learnings for future programmes. The ambition for multi-service line participation and engagement in more of a ‘year-round’ offer was also limited in practice and tended to be more likely to occur where the same providers were delivering multiple service lines in a region The new programme faced several implementation and delivery challenges. Prolonged contract negotiations at the beginning of the programme effectively shrunk the Year 1 delivery window. The lack of a centralised marketing function and the absence of the MyNCS platform (originally envisaged as a ‘one-stop shop’ for young people to register for experiences) meant delivery partners had to undertake significantly more marketing work than originally planned. Funding uncertainty could make it hard to plan for the more medium-term, whilst funding constraints meant some providers had to supplement NCS monies themselves. The payment mechanism ‘pay mech’ was felt to create greater financial risk for residential providers, compounded by high attrition rates particularly among bursary recipients. |
| Process evaluation | How well is the relationship between NCS Trust as grant funder/contractor and partners delivering the programme working? | Delivery partners praised NCS Trust, the national arm’s length programme body, as a flexible and supportive partner. They particularly valued the open communication, flexible and supportive approach to managing grantees, and the visible senior engagement from NCST’s leadership team. |
| Process evaluation | Reach and engagement: What has been the programme’s reach (especially for harder-to-reach audiences)? What has been the level of engagement across different service lines and activities? Is multiple versus single participation happening, what drives this and how can it be encouraged? |
Multi-service line participation was perceived as rare by interviewed strategic leads, however, it was not possible to validate this view using available MI data. Reported barriers to multi-service line participation included: delivery partners not knowing who else is delivering in their region, data sharing policies restricting young people data sharing between delivery partners, young people lacking awareness of other service lines, and young people lacking time to engage in multiple service lines. Multi-service line participation was perceived as more common in regions where the same delivery partner was responsible for multiple service lines, allowing them to join up their own experiences. |
| Process evaluation | Participants’ experience: What do young people think about the various experiences on offer? |
Young people’s feedback on NCS residential experiences was largely positive, with 83% of residential participants surveyed reporting ‘enjoyable’ experiences. and 81% reporting the experiences were ‘worthwhile.’ Interviews with young people taking part in residential and community open to all experiences also showed feedback to be overwhelmingly positive. These participants particularly valued the social aspects of the programme, the quality of staff, and the opportunity to do something new and different from their regular day-to-day experience. |
| Impact evaluation (residential only) | Outcomes: Did the programme achieve its intended outcomes (identified in the theory of change)? |
The main impact evaluation findings are based on the residential service line only. Overall, results from the impact evaluation are mixed with some statistically significant evidence of findings both aligning and contradicting the expected causal pathways set out in the theory of change. Most results show no statistically significant evidence of impact. There is statistically significant evidence of an increase in leadership skills, teamwork skills in relation to asking for help and helping others, engaging in different types of volunteering and problem solving. There is also statistically significant evidence of an increase in the perceived importance of social mixing. There is statistically significant evidence that NCS had a negative impact on responsibility and empathy. There was also a decrease in the social inclusion summary outcome, relating to how often participants treat people with respect regardless of their background. There are some positive findings from the impact evaluation of the COTA service line, however data collection limitations mean that these findings should be treated as indicative only. |
| Impact evaluation (residential only) | Impacts: Did the programme achieve its intended impacts (identified in the theory of change)? |
There are no statistically significant findings for the impacts of sense of belonging or wellbeing. This may be unsurprising given this is expected to be a longer-term impact of the programme and therefore less likely to arise over the evaluation period. However, the previous 2019 evaluation did identify a positive impact on all four ONS wellbeing measures. |
| Impact evaluation (residential only) | Attribution: To what extent did the new NCS model cause/contribute to observed outcomes? |
There are several factors that must be taken into account when interpreting impact findings, including the limited data for the community service lines (and no data for other service lines) and limited scope for understanding multiple participation across service lines. Taken together, these issues mean that the impact evaluation findings may under-represent the true impact of NCS participation. |
| Economic evaluation (Year 1 residential service line only) | Willingness to pay: What is the average household’s willingness to pay in taxes to support the NCS programme? Does average willingness to pay change across different groups in society? |
The central estimate for respondents’ willingness to pay (WTP) (in year 1) to support NCS was £10.16. This meant that, on average, respondents were willing to pay just over £10 in tax per year to support NCS. Respondents who had children under the age of 19 in their household or were previously aware of NCS reported a higher average WTP. This finding suggests that awareness is a key driver of how people value NCS. This may mean that those that are aware of NCS tend to have a positive view of the programme, as they are willing to pay more (on average) than the general population to support it. Alternatively, these groups may have a higher WTP because they feel that their children benefit from the NCS programme, or they are likely to benefit from the programme in the future. |
| Economic evaluation (Year 1 residential service line only) | Value for money: What were the costs and benefits associated with the residential service line? Did the programme represent value for money? |
The VfM analysis for the year 1 residential programme applied two varying approaches – a ‘bottom-up’ and a ‘top-down’ approach. The bottom-up approach looked at a number of specific expected impacts and monetises them, which when summed results in an estimate of the total economic benefit associated with the programme. The top-down approach only considered changes in wellbeing, assuming that all the benefits of the programme can be captured through expected increases in life satisfaction. Both approaches utilised data from the Year 1 impact evaluation, combined with estimates of monetary benefits associated with these impacts from wider literature. Most of the Year 1 impact estimates used throughout this value for money analysis were statistically insignificant, meaning that there is uncertainty surrounding the size of the economic benefit associated with the programme under either approach. Applying the bottom-up approach provides an estimated benefit-cost ratio of 3.01, indicating that for every £1 spent on the implementation of the NCS residential programme, it returns £3.01 in terms of benefits such as increased aspirations to education and additional hours spent volunteering. Applying the top-down approach provides an estimate of net benefit-cost ratio of 0.74; meaning, for every £1 spent on the implementation of the NCS residential programme, it returns £0.74 in terms of increased wellbeing for participants. In summary, the contrasting findings presented above may suggest that participation in the programme has more benefits in the longer term (such as by encouraging participation in education which increases lifetime incomes) than through increased wellbeing in the months after the programme. It might also be the case that the methodological approach is better suited at identifying the more ‘tangible’ outcomes (such as the aspiration to undertake additional education and/or training) rather than outcomes relating to wider life satisfaction. However, the results should be treated with caution as many Year 1 impact estimates used within the value for money analysis were inconclusive (as discussed above). |
-
The survey only covered young people aged 16 and above. However, in Year 1, a small proportion of NCS participants were aged 15 (about 5%). ↩
-
Includes all baseline participants, not only those that completed the follow-up survey. ↩
-
All baseline cases, not only those who completed follow-up. ↩ ↩2 ↩3 ↩4
-
Includes all baseline COTA participants (n=1,439), not only those that completed the follow-up survey. ↩ ↩2 ↩3 ↩4
-
Corresponds to 300 COTA participants that completed the follow-up survey. ↩ ↩2 ↩3 ↩4
-
Age profile not available for COTA participants. ↩
-
Two categories merged for weighting. ↩
-
Includes all baseline COTA participants (n=1,439), not only those that completed the follow-up survey. ↩ ↩2 ↩3
-
The survey also asked respondents to estimate their WTP for individual NCS service lines. However, the results from the service line analysis suggested that survey respondents were either unable to conceptually differentiate the value of the overall NCS from the value of its individual service lines or did not consider the value of each service line in an additive way. In both cases, the stated WTP estimates for each service line would also embed an implicit valuation of other NCS service lines. As a result, we chose to omit the service line results from the non-use value calculation. ↩
-
HM Treasury. (2013). Green Book supplementary guidance: stated preference techniques ↩
-
Hanemann, Michael, Loomis, John, and Kanninen, Barbara. (1991). “Statistical Efficiency of Double-Bounded Dichotomous Choice Contingent Valuation.” Agricultural Economics 73(4). ↩
-
The added benefit of asking the open-ended question after the bounded WTP questions is that it allows detection of inconsistent responses. An open-ended WTP estimate was defined as inconsistent if it was lower than the implied lower bound on WTP from the dichotomous choice questions or was higher than the implied upper bound from these questions. For example, if a respondent indicated they would not be willing to pay £10 to support the NCS in the bounded dichotomous choice questions, it would be inconsistent to state their maximum WTP as £20 in the open-ended question. We detected 105 inconsistent responses to the open-ended question in the data. These responses were removed from the data for the subsequent analysis. In cases of missing data (for example missing educational status), we removed these responses before conducting the analysis. This resulted in 113 responses being removed before conducting the main analysis. Therefore, the final sample size for the main analysis was 1,782. ↩
-
Office for National Statistics. (2023a). Families and households in the UK 2022. ↩
-
HM Treasury. (2022). The Green Book, Central Government Guidance on Appraisal and Evaluation. ↩
-
The measure of non-cognitive skills used here combines the following nine NCS outcome measures to estimate an overall non-cognitive skills score for each respondent: leadership, teamwork, creativity, listening and speaking, empathy, problem solving, initiative, responsibility, emotion management ↩
-
For example, the average net graduate premium and net Exchequer benefit associated with higher education is greater for men than women. ↩
-
McIntosh, S. (2019). “Post-16 Aspiration and Outcomes: Comparison of the LSYPE Cohorts.” Department for Education. ↩
-
HESA. (2023). “Non-continuation summary: UK Performance Indicators.” ↩
-
London Economics. (2024). “The economic impact of higher education teaching, research, and innovation.” ↩
-
This is an average across male and female participants, weighted by the proportion of all participants of each sex ↩
-
Department for Education. (2024a). “Further education and skills - Learner characteristics - Participation, Achievement by Age, LLDD, Primary LLDD, Ethnicity, Provision Type.” ↩
-
Department for Education. (2024c). “16-18 destination measures - 16-18 National level destinations.” ↩
-
Department for Education. (2024b). “Further education and skills - Achievement Rates - Headlines by Age, Level, Qualification Type, SSA T1.” ↩
-
Department for Education. (2024d). “Apprenticeships - Achievement Rates Learner Characteristics - Volumes and Rates by Level, Age, Sex, LLDD, Ethnicity.” ↩
-
Department for Education. (2024d). “Apprenticeships - Achievement Rates Learner Characteristics - Volumes and Rates by Level, Age, Sex, LLDD, Ethnicity.” ↩
-
Office for National Statistics. (2023b). “Earnings and hours worked, age group: ASHE Table 6.” ↩
-
Whilst the NCS programme has changed substantially since the previous evaluations, these assumptions were used due to a lack of updated evidence on the persistence of volunteering impacts for NCS participants ↩
-
Ipsos MORI (2017). National Citizen Service 2013 Evaluation – Two Years On: Main Report. ↩
-
This is an average across male and female participants, weighted by the proportion of participants of each sex ↩
-
Cabus, S., Napierala, J., & S. Carretero. (2021). “The returns to non-cognitive skills: a meta-analysis.” ↩
-
Office for National Statistics. (2024a). “Human capital stocks estimates in the UK: 2004 to 2022.” ↩
-
Unlike in the impact evaluation, questions from both survey questions regarding teamwork are combined for the purposes of the value for money analysis in year 1. ↩
-
HM Treasury. (2022). Green Book supplementary guidance: wellbeing. ↩
-
All other impact estimates were insignificant, resulting in negative low impact estimates which were set to zero for the purposes of this analysis. ↩
-
McIntosh, S. (2019). “Post-16 Aspiration and Outcomes: Comparison of the LSYPE Cohorts.” Department for Education. ↩
-
HESA. (2023). “Non-continuation summary: UK Performance Indicators.” ↩
-
London Economics. (2024). “The economic impact of higher education teaching, research, and innovation.” ↩
-
Here, and throughout, prices are inflated to 2023 prices using a GDP deflator from the Office for National Statistics (2024b) ↩
-
Department for Education. (2024a). “Further education and skills - Learner characteristics - Participation, Achievement by Age, LLDD, Primary LLDD, Ethnicity, Provision Type.” ↩
-
Department for Education. (2024b). “Further education and skills - Achievement Rates - Headlines by Age, Level, Qualification Type, SSA T1.” ↩
-
Department for Education. (2024c). “16-18 destination measures - 16-18 National level destinations.” ↩
-
Department for Education. (2024d). “Apprenticeships - Achievement Rates Learner Characteristics - Volumes and Rates by Level, Age, Sex, LLDD, Ethnicity.” ↩
-
Department for Education. (2024d). [“Apprenticeships - Achievement Rates Learner Characteristics - Volumes and Rates by Level, Age, Sex, LLDD, Ethnicity.”] (https://explore-education-statistics.service.gov.uk/data-tables) ↩
-
The analysis makes use of relevant tax rates and thresholds applicable to individuals living in England, Wales, and Northern Ireland. ↩
-
For further education qualifications, study duration is assumed to be 1 year in the absence of published data. For apprenticeships, the assumed average duration is based on data on the average expected apprenticeship training duration (by level) in 2022-23 published by the Department for Education (2024e). ↩
-
This breakdown of marginal earnings (and employment) returns by age band was possible for all qualifications with the exception of Level 4 apprenticeships as the underlying sample sizes within the Labour Force Survey data were too small to produce any meaningful and sensible results in this case. Therefore, in this instance we instead use average marginal earnings and employment returns across individuals of all ages. ↩
-
The probit function reflects the cumulative distribution function of the standard normal distribution. ↩
-
Office for Budget Responsibility (2024). ‘Economic and fiscal outlook – March 2024.’ ↩ ↩2
-
Specifically, we make use of the Office for Budget Responsibility’s most recent short-term forecasts (for 2023-24 to 2028-29) and long-term forecasts (for 2029-30 onwards) of nominal average earnings growth. ↩
-
i.e. 2022-23. Note that the analysis assumes fiscal neutrality, i.e. it is asserted that, in subsequent years, the earnings tax and National Insurance income thresholds/bands grow at the same rates of average annual earnings growth (again based on Office for Budget Responsibility forecasts). Further note that different thresholds and rates for National Insurance contributions applied throughout different parts of the 2022-23 tax year. Here, for simplicity, we use the rates and threshold that applied at the end of 2022-23 (i.e. the rates and thresholds applicable between 6th November 2022 and 5th April 2023 (the last 5 months of the 2022-23 tax year)). ↩
-
The tax adjustment also takes account of increased VAT revenues for HM Treasury, by assuming that individuals consume 91.3% of their annual income, and that approximately 50% of their consumption is subject to VAT at a rate of 20%. The assumed proportion of income consumed and the proportion of consumption subject to VAT are both based on forecasts by the Office for Budget Responsibility (2024) (where the proportion of income consumed is calculated as 100% minus the forecast household savings rate). ↩
-
The foregone earnings calculations are based on the relevant earnings among individuals in the relevant counterfactual group (see Table C.2 for more detail). ↩
-
HM Treasury. (2022). The Green Book, Central Government Guidance on Appraisal and Evaluation. ↩
-
Note again that the indirect costs associated with qualification attainment, in terms of the foregone earnings during the period of study, are already deducted from the gross learner benefit. ↩
-
As a result of these in-training benefits, for apprentice learners, the estimated ‘net’ learner benefits are consistently larger than the estimated ‘gross’ learner benefits. More information on our methodological approach for estimating apprentice pay during training is provided later in this Annex. ↩
-
See UK Parliament (2024) and FE Week (2023). ↩
-
HM Treasury. (2022). The Green Book, Central Government Guidance on Appraisal and Evaluation. ↩
-
And, for apprentices, adding the benefits of apprentice pay (and associated tax receipts) during training. ↩
-
Department for Education. (2022). ‘Apprenticeship evaluation 2021: Learner and employer surveys.’ ↩
-
We use information on gross hourly pay, including any overtime pay (or other income) ↩
-
Actual hours per week includes contracted hours as well as any paid or unpaid overtime. ↩
-
See above for more detail. ↩
-
Office for Budget Responsibility (2024). ‘Economic and fiscal outlook – March 2024.’ ↩
-
Office for National Statistics. (2023b). “Earnings and hours worked, age group: ASHE Table 6.” ↩
-
Ipsos MORI. (2017). National Citizen Service 2013 Evaluation – Two Years On: Main Report. ↩
-
HM Treasury. (2022). The Green Book, Central Government Guidance on Appraisal and Evaluation. ↩
-
Cabus, S., Napierala, J., & S. Carretero. (2021). The returns to non-cognitive skills: a meta-analysis.” ↩
-
Office for National Statistics. (2024a). “Human capital stocks estimates in the UK: 2004 to 2022.” ↩
-
The mapping between the survey questions and the nine non-cognitive skills is presented in Annex B2. Unlike in the impact evaluation, questions from both survey questions regarding teamwork are combined for the purposes of the value-for-money analysis. ↩
-
HM Treasury. (2022). The Green Book, Central Government Guidance on Appraisal and Evaluation. ↩
-
Office for National Statistics. (2024b). “GDP – data tables- Quarter 1 (Jan to Mar) 2024, quarterly national accounts edition of this dataset.” Dataset MNF2. ↩
-
Office for National Statistics. (2024c). “Gross domestic product (Average) per head, CVM market prices: SA.” ↩