Mortgage and landlord possession statistics: April to June 2020
Published 13 August 2020

© Crown copyright 2020
This publication is licensed under the terms of the Open Government Licence v3.0 except where otherwise stated. To view this licence, visit nationalarchives.gov.uk/doc/open-government-licence/version/3 or write to the Information Policy Team, The National Archives, Kew, London TW9 4DU, or email: psi@nationalarchives.gov.uk.
Where we have identified any third party copyright information you will need to obtain permission from the copyright holders concerned.
This publication is available at https://www.gov.uk/government/statistics/mortgage-and-landlord-possession-statistics-april-to-june-2020/mortgage-and-landlord-possession-statistics-april-to-june-2020
1. Main Points
| All possession actions by both landlords and mortgage providers have reduced significantly following Covid-19 impact and associated actions | As a result of FCA announcements and the passing of the Coronavirus Act in March 2020, possession actions of all types have dropped to unprecedentedly low levels. As a result, the data is unlikely to be representative of general trends in possession actions. Caution should therefore be used when interpreting and applying these figures. |
| Mortgage claims, orders, warrants and repossessions have decreased signficantly | Compared to the same quarter last year, mortgage possession claims, orders and warrants have decreased by 97%, 96% and almost 100% respectively. No repossessions by county court bailiffs have been recorded for this quarter. |
| Landlord possession actions have also all decreased significantly | Landlord possession claims, orders and warrants decreased by 89%, 97% and 98% respectively (compared to the same quarter last year). No repossessions by county court bailiffs have been recorded for this quarter. |
| Mortgage and Landlord possession claims and repossession rates have fallen across all regions | Decreases in possession claims have been recorded over all regions. Landlord claims remain concentrated in London (with 9 of the highest 10 claim rates). |
This publication provides mortgage and landlord possession statistics in April to June 2020, compared to the same quarter the previous year. For technical detail, please refer to the accompanying supporting document.
For feedback related to the content of this publication, please let us know at CAJS@justice.gov.uk
We are currently conducting a user consultation on these statistics. If you are interested in offering your views on this publication and future developments, the survey can be found here. This consultation will run until 14th November 2020.
2. Statistician’s Comment
The data suggests that a general downward trend in the number of possession actions seems to have been already underway from the beginning of 2020. This was marked by noticeable but steady decreases across the main indicators in January and February, compared to previous years.
Due to new Covid-19 measures implemented, the trend accelerated from the end of March 2020, with marked decreases in all types of repossession actions for both mortgages and landlords, and a complete cessation of any repossessions for an initial period of three months. The original legislation was subsequently extended by a further two months to 23 August 2020, after which possession activity will resume in the courts. As outlined in this statistical release, a small proportion of claims, orders and warrants are still being registered in the system. However, these cannot be progressed to bailiff repossessions at this time.
A judicial-led Working Group set up by the Master of the Rolls has been working to prepare for the expiration of the stay. We do not expect all claims to restart (or all new claims to be issued) and are working with representative bodies to understand the expected demand.
While these statistics are still believed to be of interest to the public, it is worth noting that the small volumes of repossession actions mean that the data is unlikely to be representative of general trends in possessions. Caution should therefore be used when interpreting and applying these figures. With regard to future publications, our statistical teams will consider the impact of the pause in repossessions in the timeliness series when we publish the average timeliness estimates.
3. Overview of Mortgage Possession
Mortgage possession figures have dropped to the lowest values in the series, with claims, orders, warrants and repossessions all dropping by more than 95% in comparison to March-June 2019
As a result of coronavirus and associated actions, all mortgage possession actions have dropped significantly. Compared to the same quarter in the previous year, mortgage possession claims (161), are down 97%. Mortgage orders for possession (149) are down 96% and warrants issued (9) are down almost 100%. No repossessions were recorded in the current quarter.
Figure 1: Mortgage possession actions (actual and seasonally adjusted) in the county courts of England and Wales, April 2015 to June 2020 (Source: Table 10a)
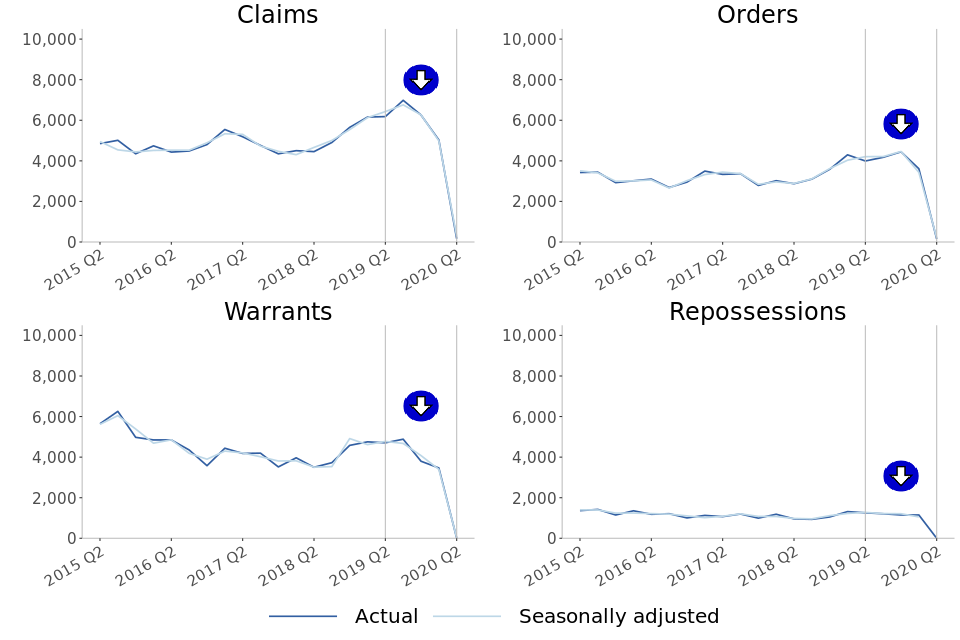
Mortgage possession actions (actual and seasonally adjusted) in the county courts of England and Wales, April 2015 to June 2020 (Source: Table 10a)
Mortgage possession claims fell from a peak of 26,419 in April to June 2009 before stabilising in April to June 2015 (4,849). In the most recent quarter, April to June 2020 there were 161 claims for possession, down 97% from the same quarter in 2019.
Orders and warrants for possession followed a similar trend to mortgage claims, falling from a peak of 23,850 orders in July to September 2009 and 21,350 warrants in January to March 2009, and stabilizing around 2016/17. Compared to the same quarter of the previous year, orders are down 96% to 149 and warrants are down almost 100% to 9 in April to June 2020.
Historically, repossessions by county court bailiffs fell from a high of 9,284 in Q1 of 2009 to 934 in Q3 of 2019, the lowest recorded level of the series at the time. In April to June 2020, there were no recorded repossessions.
Before the impact of coronavirus, the historical fall in the number of mortgage possession actions since 2008 generally coincides with lower interest rates, a proactive approach from lenders in managing consumers in financial difficulties and other interventions, such as the Mortgage Rescue Scheme and the introduction of the Mortgage Pre-Action Protocol. Additionally, the downward trend seen in recent years mirrors that seen in the proportion of owner-occupiers.
4. Mortgage Possession Action Timeliness
Median timeliness figures are volatile for mortgage orders, warrants and repossessions due to low volumes being processed
Median average time has increased for orders and warrants, however due to the low volumes of possession actions this quarter, caution should be used when interpreting these results. It is unlikely that these timeliness figures are representative of any statistical trend.
Over the last two years, the median time between claim to repossession has varied between 33 and 54 weeks. No claims to repossession times have been recorded this quarter, so timeliness cannot be calculated.
Figure 2: Average timeliness of mortgage possession actions, April 2015 to June 2020 (Source: Table 3a)
Number of weeks taken from initial mortgage claim to…
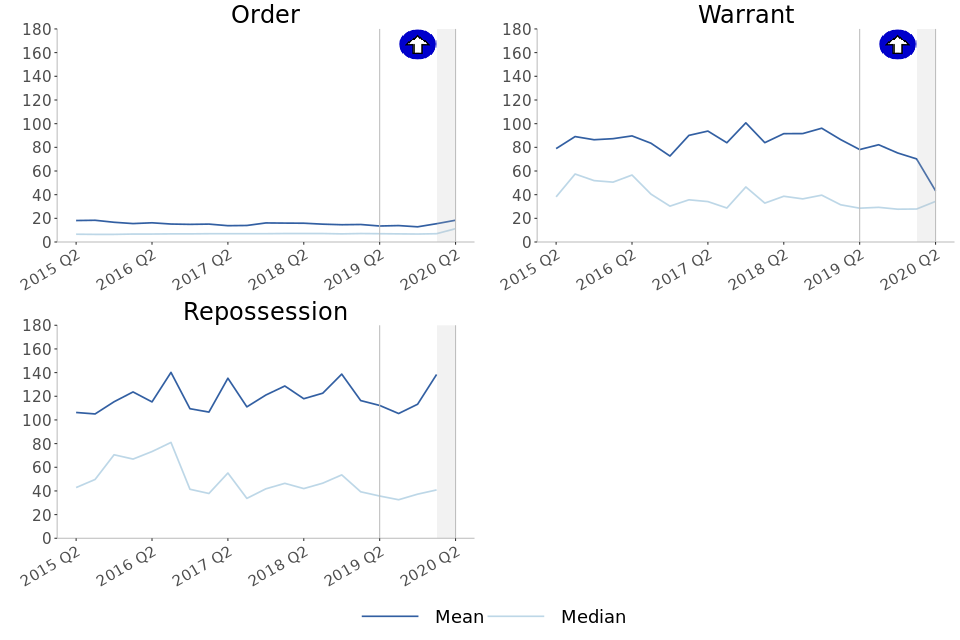
Average timeliness of mortgage possession actions, April 2015 to June 2020 (Source: Table 3a)
-
Claims to order median timeliness has increased to 11.3 weeks from 7.0 weeks in the same period in 2019.
-
Claims to warrant median timeliness has increased to 34.3 weeks from 28.6 weeks in the same period in 2019.
-
No claims have been converted to repossessions this quarter.
The above charts distinguish between the timeliness of possession claims at different stages of a case. Average time taken from claim to warrant or repossession can fluctuate and is affected by various factors. For example, the final two charts take account of the amount of time between the court order being issued and the claimant, such as the mortgage lender, applying for a warrant of possession.
The long-term increases in the mean average time from claim to warrant and claim to repossession are due to an increasing proportion of historical claims (dating from 2007 to 2013) reaching the warrant and repossession stages respectively in recent quarters. This is possibly due to defendants recently breaking the terms of the mortgage agreements put in place at the start of the process. Although these historical outlying cases inflate the mean average, they have less effect on the median. The median is still subject to volatility though, due to the increasing proportion of historic cases.
No claims have been converted to repossessions this quarter, so no timeliness estimate can be calculated.
Figure 3: Percentage (cumulative) of mortgage claims that reach each stage (by number of quarters since claim was submitted) (Source: Table 3b)[footnote 1]
| In the first 2 quarters | 5-year period | |
|---|---|---|
| Orders | 50% | 58% |
| Warrants | 12% | 33% |
| Repossessions | 4% | 17% |
Over the last 5 years, 58% of claims progressed to orders of repossession; 33% to warrants, and 17% ended in repossession (by a county court bailiff). When the 5-year period to June 2020, is compared to the 5-year period to June 2019, the proportion of claims reaching each possession stage remains mostly unchanged, with only claims reaching the order stage decreasing slightly (down 1pp).
The proportion of mortgage possession claims reaching the order stage decreased slightly in the initial 6 months up to April to June 2020 compared with the same period last year (down 2pp). The proportion of claims reaching warrant stage also decreased (by 1pp) and claims reaching the repossession stage remained stable over the same period.
5. Overview of Landlord Possession
The number of landlord possession actions for all court stages have also decreased to their lowest point in the series, down at least 89% in comparison to the same quarter of last year
As a result of coronavirus and associated actions, all landlord possession actions have dropped significantly. Compared to the same quarter the previous year, landlord possession actions; claims (3,022), orders for possession (658) and warrants (268) have decreased by 89%, 97%, and 98% respectively. No repossessions have been recorded this quarter.
Figure 4: Landlord possession actions (actual and seasonally adjusted) in the county courts of England and Wales, April 2015 to June 2020 (Source: Table 10b)
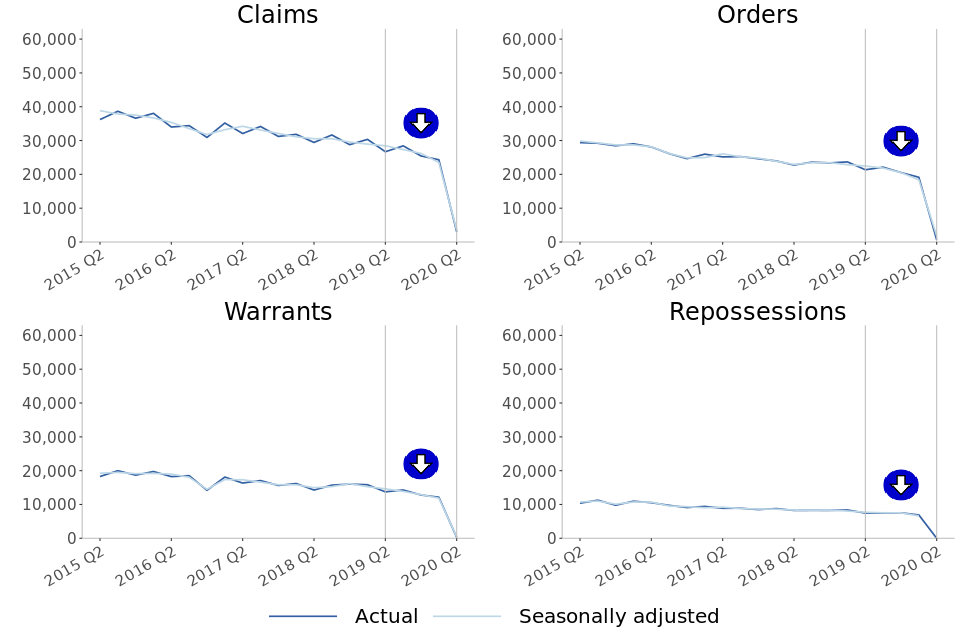
: Landlord possession actions (actual and seasonally adjusted) in the county courts of England and Wales, April 2015 to June 2020 (Source: Table 10b)
In April to June 2020, a minority (27% or 823) of all landlord possession claims were social landlord claims, and 29% (882) were accelerated claims. The group making up the largest proportion of landlord claims (44% or 1,317) were private landlord claims.
This is in contrast to previous quarters, for example in April to June 2019, the majority (58% or 15,581) of all landlord possession claims were social landlord claims, and accelerated claims and private landlord claims made up just 19% and 23% of all landlord claims respectively.
The fall in claim and orders volumes is observed across all geographical regions. As in previous quarters, a concentration of claims was seen in London, with 1,232 landlord claims and 255 landlord orders at London courts in April to June 2020, accounting for 41% and 39% of all landlord possession claims and orders respectively. Despite this, in London there was still a decrease of 82% (from 6,721) for landlord claims and a decrease of 95% for landlord orders (from 4,817 in April to June 2019).
The 98% decrease in landlord warrants in April to June 2020, when compared to April to June 2019 was again accompanied by large decreases across all regions. The largest regional number of warrants (120) was again found in London, with this making up 45% of all landlord warrants. Despite this, there was a decrease of 97% for landlord warrants in London (from 3,700 in April to June 2019 to 120 in April to June 2020).
6. Landlord Possession Timeliness[footnote 2]
Median timeliness figures are volatile for landlord orders, warrants and repossessions due to low volumes being processed
Median average time has increased for orders and warrants, however due to the low volumes of possession actions this quarter, caution should be used when interpreting these results. It is unlikely that these timeliness figures are representative of any statistical trend in timeliness.
There have been no claims to repossession times recorded this quarter but timeliness for landlord possession actions has remained stable across the previous five years.
Figure 5: Mean and median average timeliness of landlord possession actions, April 2015 to June 2020 (Source: Table 6a)
Number of weeks taken from initial landlord claim to…
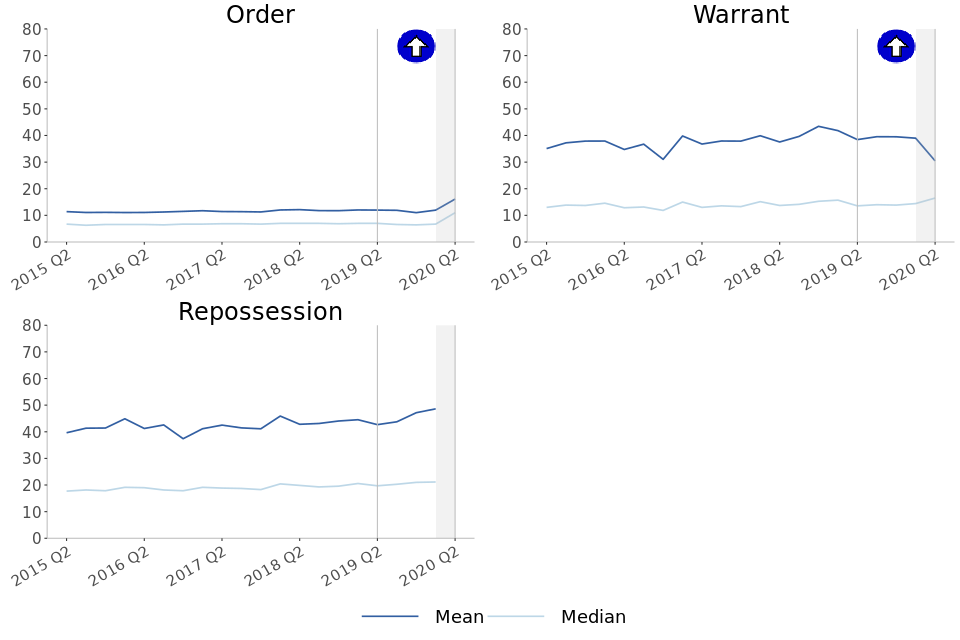
Mean and median average timeliness of landlord possession actions, April 2015 to June 2020 (Source: Table 6a)
-
Claims to order median timeliness has increased to 11.0 weeks from 7.0 weeks in the same period in 2019.
-
Claims to warrant median timeliness has increased to 16.5 weeks from 13.6 weeks in the same period in 2019.
-
No claims to repossessions were recorded this quarter.
As shown by Figure 5, median figures are generally considerably lower than mean figures, demonstrating that on average, the progression from claim to successive stages can be skewed by outlying cases when using a mean measure of average timeliness.
Figure 6: Percentage (cumulative) of landlord claims that reach each stage (by number of quarters since claim was submitted) (Source: Table 6b)[footnote 3]
| In the first 2 quarters | 5-year period | |
|---|---|---|
| Orders | 63% | 70% |
| Warrants | 24% | 38% |
| Repossessions | 13% | 26% |
Over the last 5 years, 70% of claims progressed to orders of repossession; 38% to warrants, and 26% ended in repossession. Over the 5-year period to April to June 2020, when compared to the 5-year period to April to June 2019, the proportion of claims reaching each possession stage have generally decreased slightly, with claims reaching orders and claims reaching warrants down 4pp and 2pp respectively, while claims reaching repossessions remained unchanged.
The proportion of landlord possession claims reaching the order and warrant stage also decreased slightly in the initial 6 months up to April to June 2020 (down 3pp and 1pp respectively) compared with the same period last year. Claims reaching the repossession stage remained unchanged.
7. Regional Possession Claims
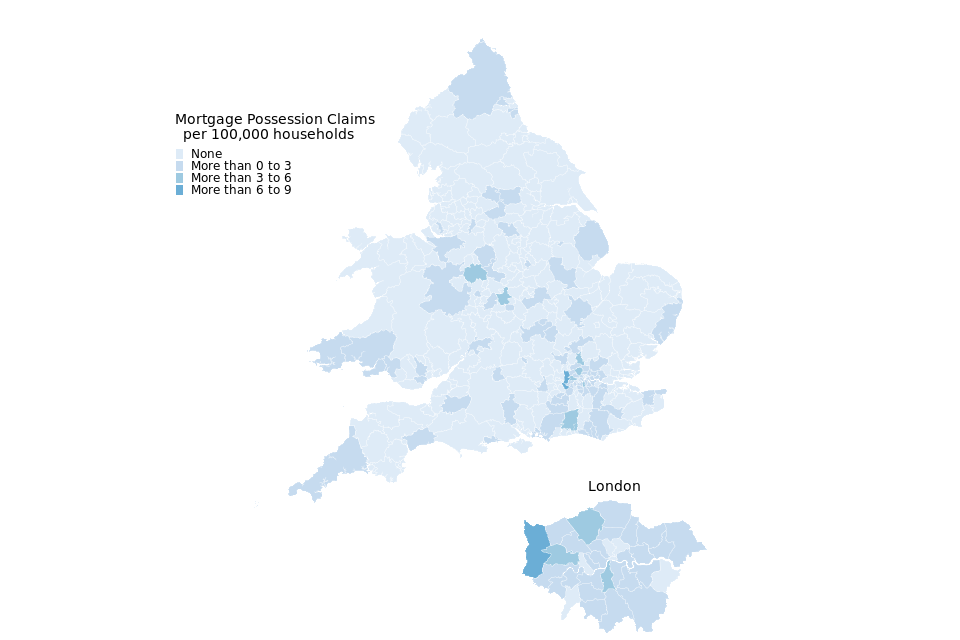
Spelthorne in the South East region had the highest rate of mortgage possession claims at 7.5 per 100,000 households, followed by Hillingdon (London region) and Ealing (London region); with 7.3 and 4.9 claims per 100,000 respectively. Note that these rates are based on small numbers of possessions only.
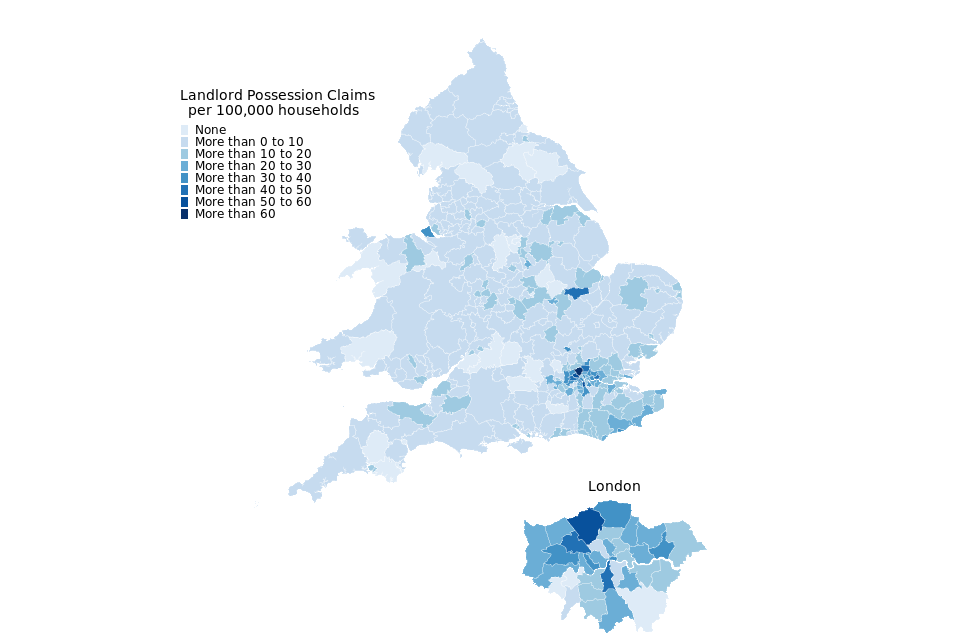
Landlord possession claim rates were highest in London, with 9 of the 10 highest rates occurring in the London region. Barnet had the highest rate (120 per 100,000 households).
Figure 7a: Mortgage possession Claims per 100,000 households, April to June 2020 (Source: map.csv; see supporting guide)
Percentage (cumulative) of landlord claims that reach each stage (by number of quarters since claim was submitted) (Source: Table 6b)
| Local Authority | Rate (per 100,000 households) | Actual number |
|---|---|---|
| Spelthorne | 7.5 | 3 |
| Hillingdon | 7.3 | 8 |
| Ealing | 4.9 | 6 |
223 local authorities had no possession claims during this period. Excluding these, Manchester had the lowest rate of mortgage claims (0.5 per 100,000 households).
Figure 7b: Landlord possession Claims per 100,000 households, April to June 2020 (Source: map.csv; see supporting guide)
Mortgage possession Claims per 100,000 households, April to June 2020 (Source: map.csv; see supporting guide)
| Local Authority | Rate (per 100,000 households) | Actual number |
|---|---|---|
| Barnet | 120 | 180 |
| Lambeth | 59 | 82 |
| Brent | 57 | 66 |
London boroughs account for 9 of the 10 local authorities with the highest rate of landlord claims.
2 local authorities had no landlord claims during this period. Excluding this, Harrogate had the lowest rate of landlord claims (1.4 per 100,000 households).
8. Regional Repossessions (by County Court Bailiffs)
There were no bailiff repossessions for either mortgages or landlord case types during April to June 2020.
9. Annex: Impact of changes in possession process related to Coronavirus
On 17 March 2020, the Chancellor announced additional support aimed at limiting short-term hardships faced by home owners and renters. This was followed by the passing of the Coronavirus Act by royal assent on 25 March 2020, which extended the notice period to three months for some tenancies in the private and social sectors.
Furthermore, the Master of the Rolls, with the agreement of the Lord Chancellor, suspended all ongoing housing possession cases for 90 days from 27 March 2020[footnote 4]. The original legislation was subsequently extended by a further two months to 23 August 2020[footnote 5].
These actions have had an impact on possessions data from March 2020 throughout the second quarter (April to June) 2020 and this annex provides a monthly breakdown of this data[footnote 6]. Further analysis of the impact on possession claims will be provided in future publications.
Covid-19 had several related actions which have all had a significant impact on mortgage and landlord possession actions. These have included The Financial Conduct Authority (FCA) announcement on the 20th March 2020[footnote 7] that they expected all lenders to cease any mortgage repossession action, and the passing of the Coronavirus Act by royal assent on 25 March 2020[footnote 8].
Whilst these measures have impacted both Q1 and Q2 of 2020, the effect on Q1 was not consistent throughout the quarter, with the most significant impact observed during the final days of March. Further, though the impact was generally as expected throughout the second quarter, there remains significant public interest in the monthly breakdown of these possession actions. This annex aims to more clearly demonstrate the impact of COVID-19-related action on two stages of the possession process. The initial claim stage and warrant issue stage have been chosen as they are considered to be representative of the early and late stages of a typical possession action.
Alongside the figures for 2019 and 2020, we have presented a 5-year average which can be considered a baseline.
Figure 8: Comparison of all possession claims by month in the county courts of England and Wales (January to June for 2019, 2020 and the 5-year average)
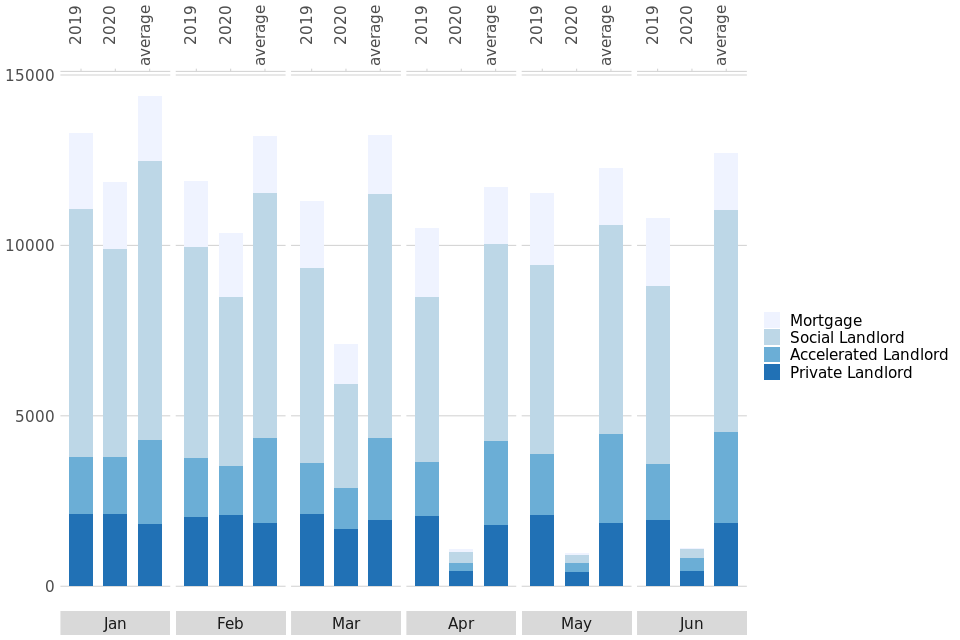
Comparison of all possession claims by month in the county courts of England and Wales (January to June for 2019, 2020 and the 5-year average)
As can be seen in Figure 8, across January and February the total number of claims was somewhat lower than the same months of 2019 (down 11% and 13% respectively) and was significantly lower than the five year average (down 17% and 22% respectively)
A more significant decrease was observed in March. Although the start of Covid-related actions only impacted the end of this month, the number of claims were still down 37% on March 2019 and 46% lower than the five-year average respectively.
By April these figures had fallen to just 1,080 claims, 90% down on April 2019 and down 91% on the 5-year average. These figures remained consistently low over May and June with just 979 and 1,124 claims registered respectively (92% and 91% lower than the five year average respectively).
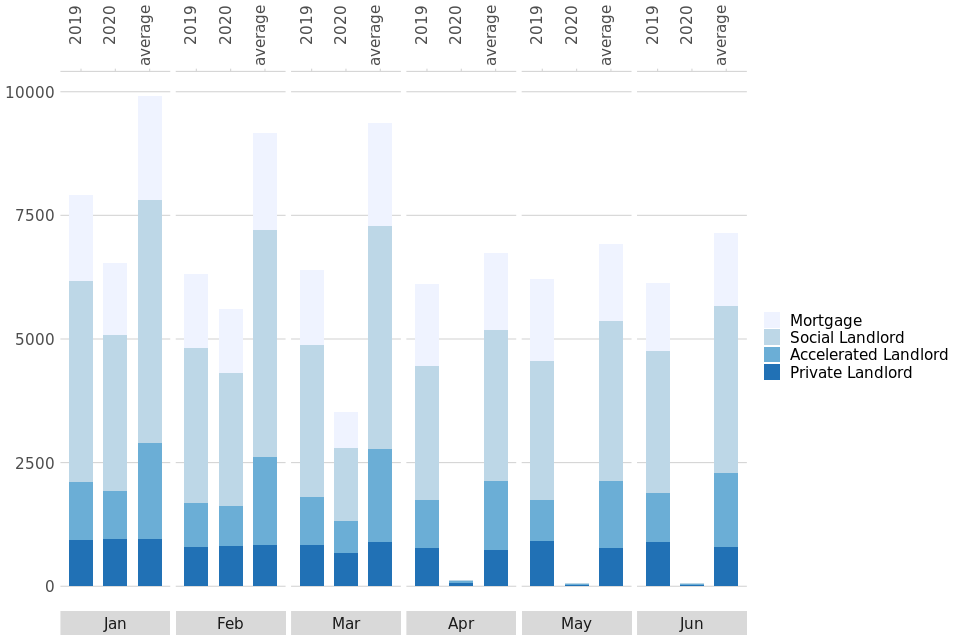
Figure 9: Comparison of monthly claims by possession type in the county courts of England and Wales (January to June 2019, 2020 and 5-year average)
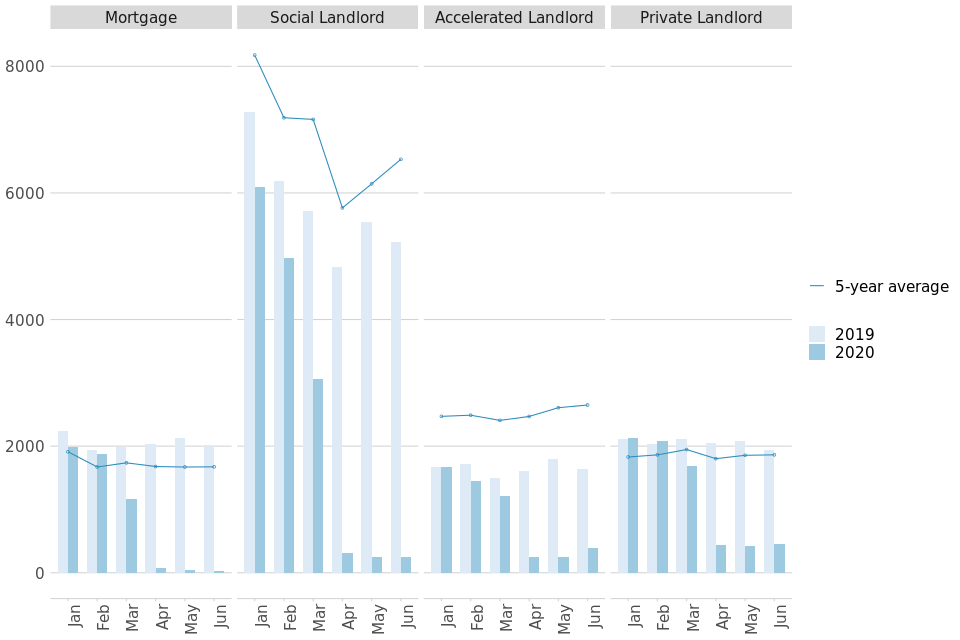
Comparison of monthly claims by possession type in the county courts of England and Wales (January to June 2019, 2020 and 5-year average)
The total number of claims can be further subdivided by claim type, with figure 9 showing the variation in claim numbers between landlord and mortgage claims.
Mortgage figures saw the most significant decline in claim numbers, suggesting that overwhelmingly mortgage lenders have complied with the FCA suspension of mortgage possession actions. January and February saw claim numbers similar to 2019 (down 11% and 3% respectively). In contrast, there were just 1,165 claims made in March 2020, down 41% on the previous year. This number dropped significantly in April (79 claims, down 96% on 2019), followed by a steadier decline throughout May and June (49 and 33 claims respectively).
The number of landlord claims registered by month varies greatly by type.
Social landlord claims follows a similar pattern to mortgage claims. While they were already down on 2019 in January and February (down 16% and 20% respectively), a more substantial decrease was recorded in March (3,054 claims, down 47% on 2019). This is despite the fact that the Coronavirus Act did not come into force until the 26th March, suggesting that claims were already dropping before this time. Claims then dropped significantly in April (313 claims, down 94% on 2019), and remained at low levels throughout May and June (255 claims for each month).
In contrast, accelerated and private landlord claims both show trends which differ from mortgage and Social landlord claims. Accelerated and private landlord claims in January and February remained at broadly similar levels to 2019, and while both registered a decrease in claims in March 2020 (down 19% and 21% on 2019 respectively). This drop is less pronounced than observed for social landlords. Claims dropped again in April; 245 claims for accelerated landlord (down 85% on 2019) and 443 claims for private landlords (down 78% on 2019). While claims have remained steady for private landlords throughout May and June (424 and 450 respectively), there was an increase for accelerated landlords from May to June (251 in May and 386 in June), although this was still down 77% on June 2019.
As a result, accelerated and private landlord claims made up the bulk of all claims for May and June (69% and 74% respectively).
Figure 10: Comparison of all possession warrants issued by month in the county courts of England and Wales (January to June 2019, 2020 and 5-year average)
Comparison of all possession warrants issued by month in the county courts of England and Wales (January to June 2019, 2020 and 5-year average)
As can be seen in Figure 10, across January and February the total number of warrants issued was also down on the same months of 2019 (down 17% and 11% respectively) and more significantly down on the five-year average (down 34% and 39% respectively)
With the start of Covid-related actions impacting from the end of March, warrant numbers were down 45% on March 2019 and 62% on the five-year average respectively.
By April, numbers had fallen to just 133 warrants, down 98% on both April 2019 and the 5-year average. These figures remained consistently low over May, and June with just 71 and 73 warrants issued respectively (down 99% on the five year average for both months).
It should also be noted that though warrants may still be issued where an individual has applied for one, that individual will be informed that no enforcement action can be undertaken at this time.
Figure 11: Comparison of monthly warrants by possession type in the county courts of England and Wales (January to June 2019, 2020 and 5-year average)
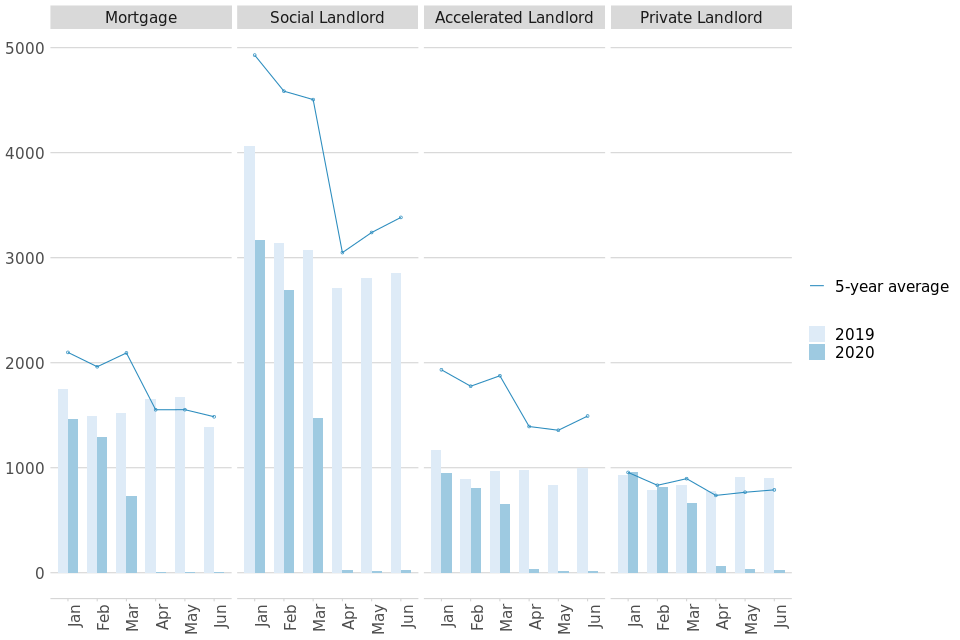
Comparison of monthly warrants by possession type in the county courts of England and Wales (January to June 2019, 2020 and 5-year average)
The total number of warrants can be subdivided by claim type (as in figure 11).
As for claims, mortgage warrants saw the most significant decline in numbers. January and February 2020 saw warrant numbers that were broadly similar to 2019 (down 17% and 13% respectively). In contrast, there were just 728 warrants issued in March 2020, down 52% on the previous year. By April, warrants issued were negligible (4 warrants), and remained in single figures throughout May and June (3 and 2 warrants respectively).
Unlike claims, the number of landlord warrants issued is low across all warrant types.
Social landlord warrants showed the greatest decline in numbers. While warrant numbers were already down on 2019 in January and February (down 22% and 14% respectively), this fell further with the cessation of repossession action progression in March (1,469 warrants issued, down 52% on 2019). Warrants throughout April to June were extremely low, with just 29, 20 and 29 social landlord warrants issued in April, May and June respectively).
Accelerated and private landlord warrants also declined significantly throughout 2020. Accelerated and private landlord claims in January and February remained at broadly similar levels to 2019, and both decreased in warrants issued in March 2020 (down 32% and 20% on 2019 respectively). Warrants issued then dropped sharply in April; 37 warrants for accelerated landlord (down 96% on 2019) and 63 warrants for private landlords (down 92% on 2019). Warrant numbers have remained steady for both accelerated and private landlord types throughout May (16 accelerated warrants and 32 private landlord warrants respectively) and June (15 accelerated landlord warrants and 27 private landlord warrants).
Accelerated and private landlord warrants make up the bulk of all claims for May and June, 68% and 58% respectively. However, this data should be interpreted with caution as very few warrants of any type were issued, and therefore it is not necessarily representative of a broader trend.
10. Further information
The statistics in the latest quarter are provisional and revisions may be made when the next edition of this bulletin is published. If revisions are needed in subsequent quarters, these will be annotated in the tables.
10.1 Consultation
We are currently conducting a user consultation with the aim of to learning more about how stakeholders use the statistics. This will help us prioritise improvements on what our stakeholders find useful.
If you are interested in offering your views on this publication and future developments, the survey can be found at https://www.smartsurvey.co.uk/s/BT6VHH/. This consultation will run until 14th November 2020.
10.2 Accompanying files
As well as this bulletin, the following products are published as part of this release:
-
A supporting guide providing further information on how the data is collected and processed, including a guide to the csv files, as well as legislation relevant to mortgage possessions and background information.
-
A set of overview tables, covering key sections of this bulletin.
-
CSV files of the map data and the possession action volumes by local authority and county court.
-
A CSV file of the data included in the Annex.
-
The effect of the COVID-19 pandemic on our capacity means we have not updated the data visualisation tool this quarter. The tool containing data to Q4 2019 is still available https://public.tableau.com/profile/moj.analysis.
10.3 National Statistics status
National Statistics status means that official statistics meet the highest standards of trustworthiness, quality and public value.
All official statistics should comply with all aspects of the Code of Practice for Statistics. They are awarded National Statistics status following an assessment by the Authority’s regulatory arm. The Authority considers whether the statistics meet the highest standards of Code compliance, including the value they add to public decisions and debate.
It is the Ministry of Justice’s responsibility to maintain compliance with the standards expected for National Statistics. If we become concerned about whether these statistics are still meeting the appropriate standards, we will discuss any concerns with the Authority promptly. National Statistics status can be removed at any point when the highest standards are not maintained, and reinstated when the standards are restored.
10.4 Future publications
Our statisticians regularly review the content of publications. Development of new and improved statistical outputs is usually dependent on reallocating existing resources. As part of our continual review and prioritisation, we welcome user feedback on existing outputs including content, breadth, frequency and methodology. Please send any comments you have on this publication including suggestions for further developments or reductions in content.
10.5 Contact
Press enquiries should be directed to the Ministry of Housing, Communities and Local Government press office:
Simon Varcoe - email: Simon.Varcoe@communities.gov.uk
Other enquiries and feedback on these statistics should be directed to the Justice Statistics Analytical Services division of the Ministry of Justice:
Carly Gray - email: CAJS@justice.gov.uk
Next update: 12th November 2020
© Crown Copyright
Produced by the Ministry of Justice
Alternative formats are available upon request from ESD@justice.gov.uk
-
The value of tables 3b and 6b for our users, particularly in comparison to the other timeliness data in tables 3a and 6a, is currently being reviewed. If you use these tables, or any timeliness data in this publication, please send your views on their usefulness or clarity to CAJS@justice.gov.uk. ↩
-
The law requires at least 4 and no more than 8 weeks between claim and court hearing. Possession orders stipulate when a tenant must vacate the property - typically within 4 weeks from the date the order was made. Landlords cannot issue a warrant until after this period (if the tenant has failed to comply). ↩
-
The value of tables 3b and 6b for our users, particularly in comparison to the other timeliness data in tables 3a and 6a, is currently being reviewed. If you use these tables, or any timeliness data in this publication, please send your views on their usefulness or clarity to CAJS@justice.gov.uk. ↩
-
Practice Directive 51Z ↩
-
Civil Procedure (Amendment No. 2) (Coronavirus) Rules 2020 ↩
-
The underlying data used for this section is available in CSV format accompanying this publication. ↩
-
https://www.fca.org.uk/news/press-releases/new-guidance-mortgage-providers-lenders-coronavirus ↩
-
Coronavirus Act 2020: An Act to make provision in connection with coronavirus; and for connected purposes. ↩