LPC summary of evidence 2026
Published 28 October 2026

© Crown copyright 2026
This publication is licensed under the terms of the Open Government Licence v3.0 except where otherwise stated. To view this licence, visit nationalarchives.gov.uk/doc/open-government-licence/version/3 or write to the Information Policy Team, The National Archives, Kew, London TW9 4DU, or email: psi@nationalarchives.gov.uk.
Where we have identified any third party copyright information you will need to obtain permission from the copyright holders concerned.
This publication is available at https://www.gov.uk/government/publications/minimum-wage-rates-for-2027/lpc-summary-of-evidence-2026
1. Introduction
The Low Pay Commission (LPC) is the independent body that advises the Government on the National Minimum Wage (NMW) rates, including the National Living Wage (NLW). We are a social partnership, comprising worker representatives, employer representatives and independent experts.
This short report sets out the key evidence behind our recommendations for the minimum wage rates which will come into force on 1 April 2027. It should be read in conjunction with our letter of advice to the Prime Minister and Secretary of State for Business, Innovation, Science and Trade.
We will publish our full annual report in the new year, which will set out at greater length the data and testimony which informed our recommendations this year.
We met in October 2026 to agree these recommendations and submitted our advice on 23 October. Our recommendations were then accepted by the Government and announced at the Autumn Budget on 28 October.
The Government published the LPC’s remit in March 2026. It is available to view online here
2. Recommendations and Rationales for rates in 2027
This section summarises the rate recommendations for rates to apply from April 2027, their nominal and percentage increases and the rationale taken from our letter of recommendations, which can be found here.
2.1 Rates to apply from 1 April 2027
| NMW rate from April 2027 | Increase (£) | Increase (%) | |
|---|---|---|---|
| National Living Wage (21 and over) | £13.21 | 50p | 3.9 |
| 18-20 Year Old Rate | £11.27 | 42p | 3.9 |
| 16-17 Year Old Rate | £8.31 | 31p | 3.9 |
| Apprentice Rate | £8.31 | 31p | 3.9 |
| Accommodation Offset | £11.53 | 43p | 3.9 |
2.2 National Living Wage
Despite strong economic growth, labour demand is weak, particularly in key low-paying industries. Economic growth is expected to be slightly lower next year, vacancies are falling and unemployment is expected to rise. Although we have not seen robust evidence that recent NLW increases have reduced employment for either youth or adults, we have concluded that a cautious approach is justified at this time … although our 3.9 per cent recommendation will not reach the two thirds of median earnings reference point, it still makes progress towards it. Commissioners remain committed to reaching the remit’s key reference point of two thirds of median earnings when economic conditions allow.
2.3 18-20 Year Old Rate
Our view is that while there is still potential to lower the age limit, especially for 20-year-olds, demand for young workers has slowed and the risks associated with ambitious rises have increased. Therefore, we recommend pausing on alignment by recommending a percentage increase in line with that for the NLW, which we believe is consistent with the remit’s aim of prioritising youth employment. We recommend a 3.9 per cent increase or 42p to £11.27.
2.4 16-17 Year Old Rate
The remit asks us to set a rate that supports the employment of this group. The vast majority of 16–17-year-olds are in full-time education and so their job market is distinct. Employment for this age group has deteriorated in recent years. While the evidence does not suggest this is a result of minimum wage increases, the decline in their employment is hard to ignore and the evidence does not guarantee that future increases are risk free. On this basis we recommend an increase of 31p to £8.31 (3.9 per cent).
2.5 Apprentice Rate
Apprentices of all ages are entitled to the Apprentice Rate in the first year of their apprenticeship. Apprentice vacancy numbers have declined faster than for all vacancies in the economy. While we don’t think the Apprentice Rate is a key factor here either, some employer stakeholders are increasingly concerned about how the cost of employing an apprentice has increased. Employee stakeholders argue the level is inadequate. On this basis we recommend an increase of 31p to £8.31 (3.9 per cent).
2.6 Accommodation Offset
We recommend increasing the Accommodation Offset in line with the NLW to £11.53 (an increase of 43p or 3.9 per cent). This is in line with the conclusion of our review of the offset in 2022, where we stated that: “The value of the offset as a proportion of the NLW will not increase significantly until we have some assurance that there are robust minimum standards in place for accommodation quality and that these are enforced.”
3. Recent economic growth has been unexpectedly resilient
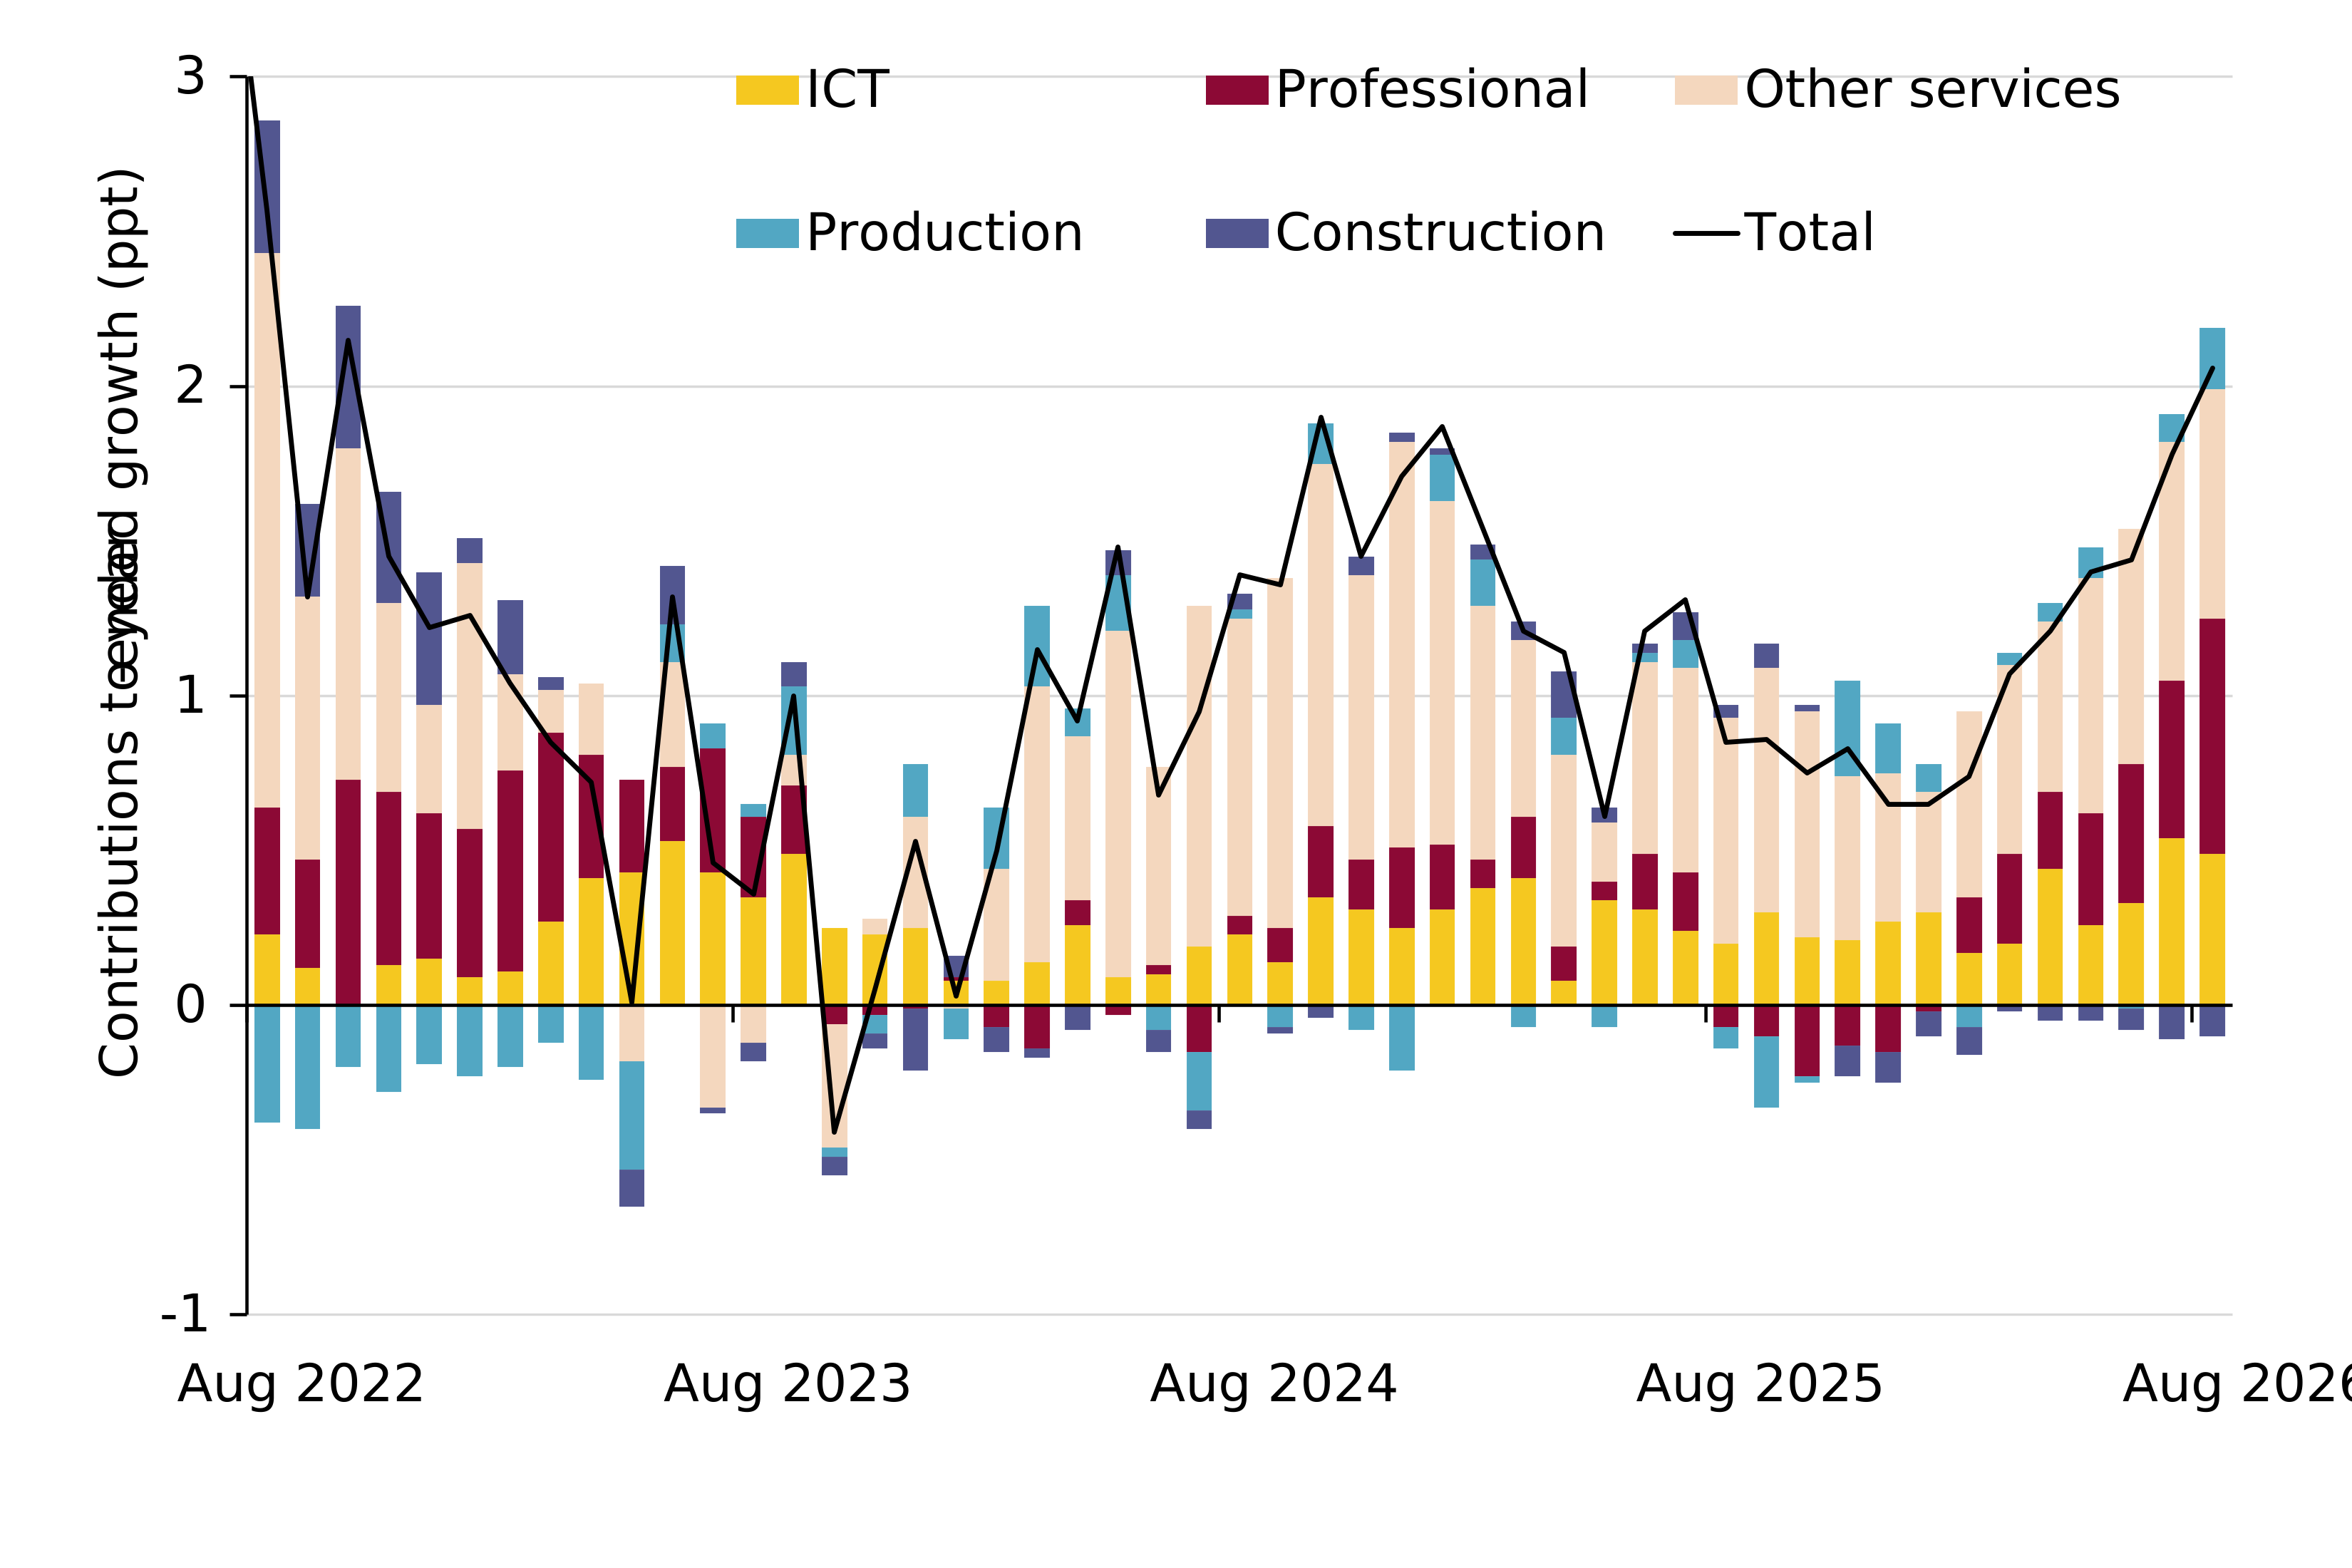
Various organisations, including the IMF and the Bank of England, have described the UK’s current economic growth as “resilient”. Monthly GDP growth reached 2.1 per cent in the year to August 2026. The Professional & Business Services sector and Information & Communication sector were key drivers of this growth.
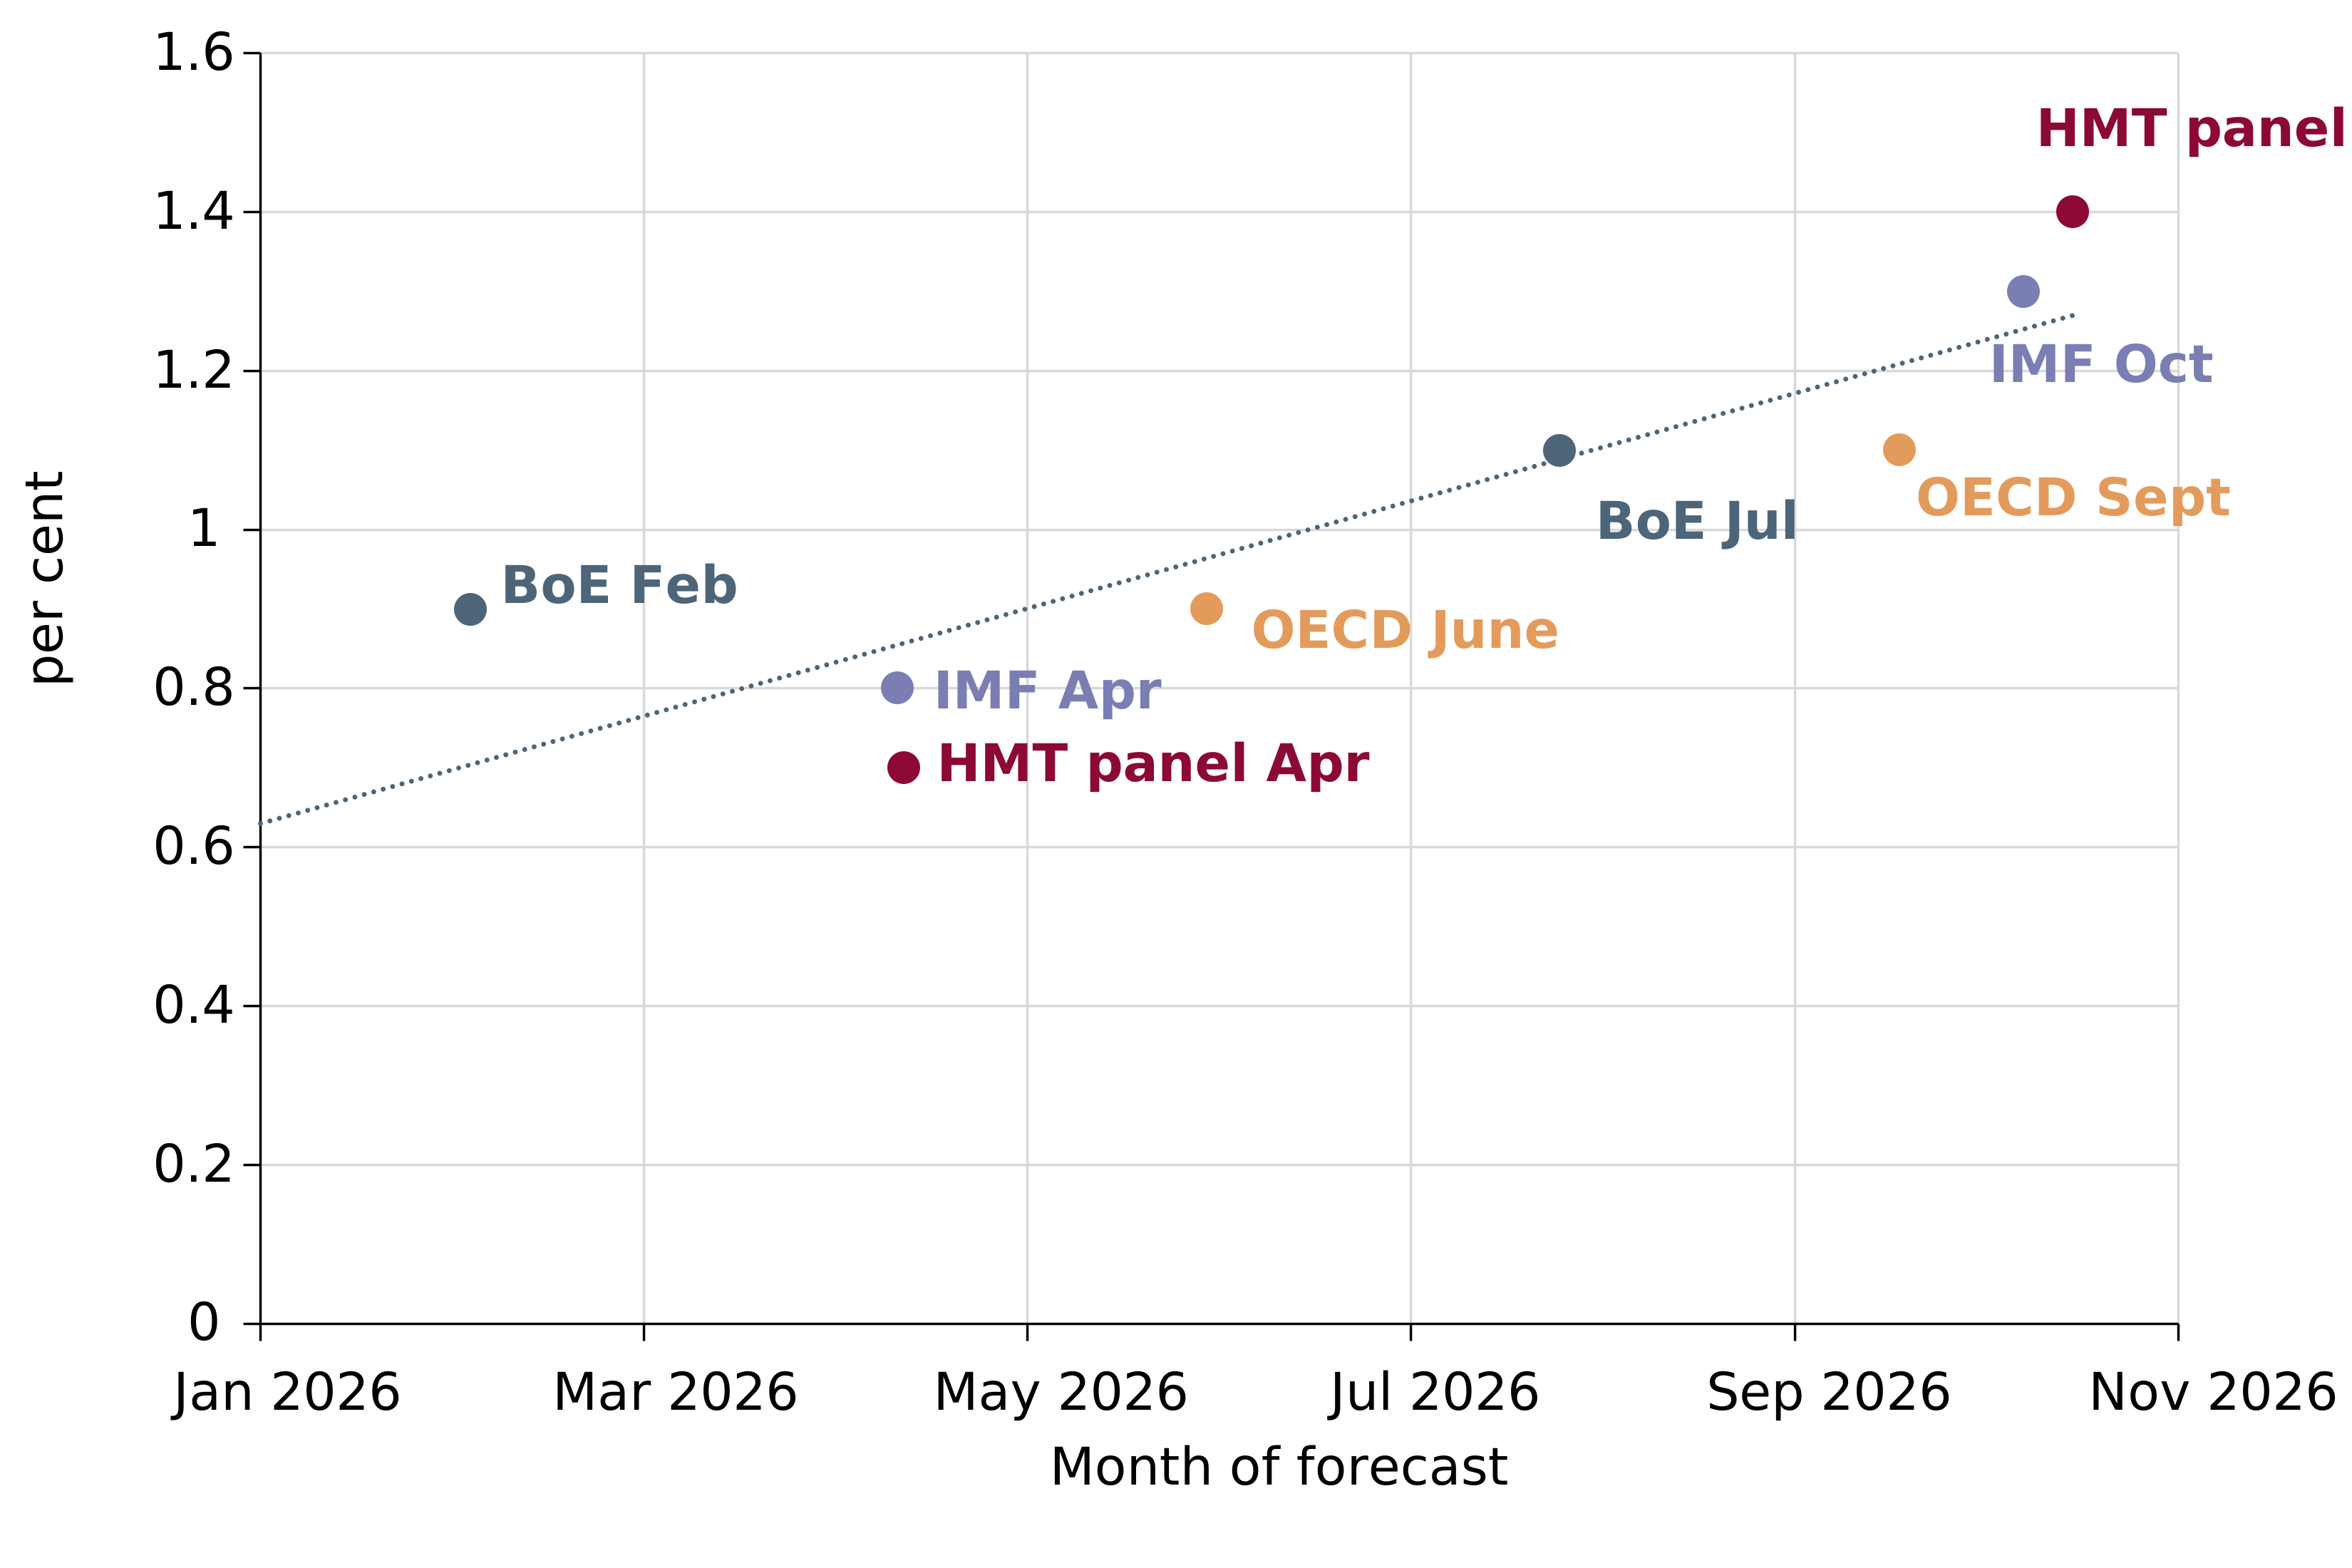
Following the performance recorded over 2026, forecasters upgraded their expectations for the year. For example, in the spring, the median forecast for GDP growth in the HM Treasury panel of economic forecasters was 0.7 per cent. By October, when Commissioners were deciding what minimum wage rates to recommend, this had risen to 1.4 per cent.
3.1 Contributions to year-ended monthly GVA growth, UK, 2022-2026
3.2 2026 GDP growth forecasts, by month of forecast
4. GDP growth has not been even across the economy
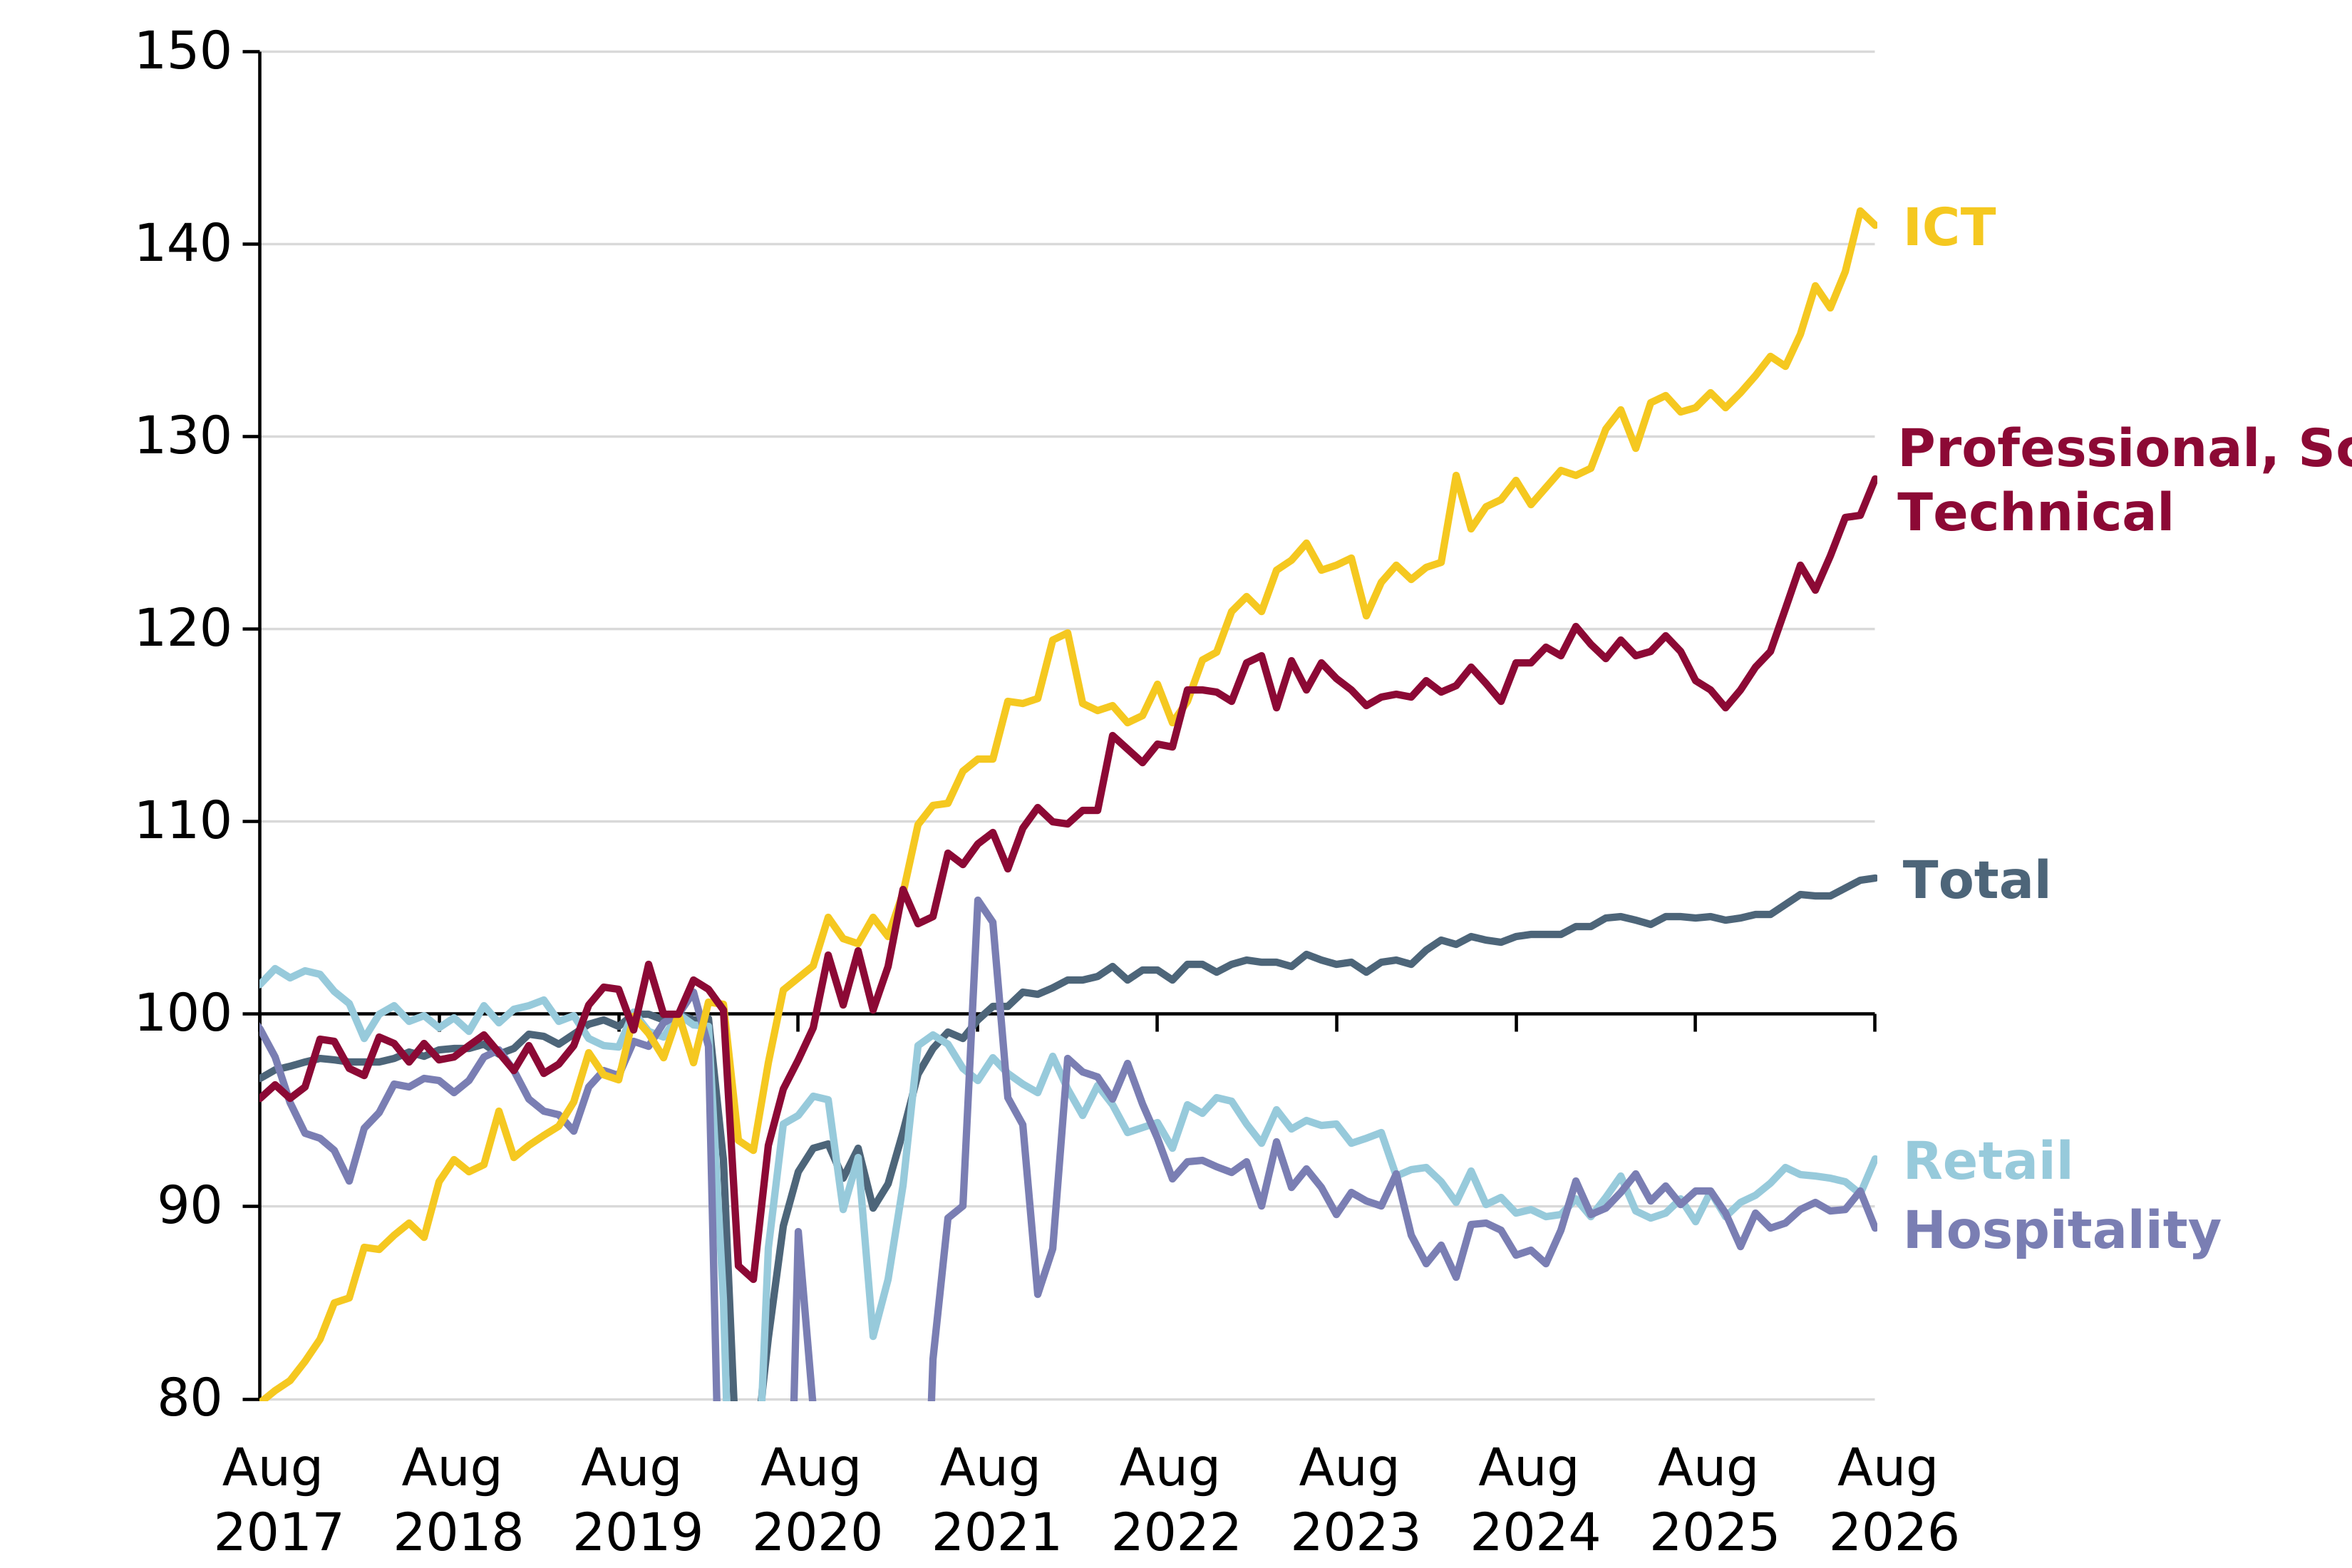
However, GDP growth has not been even across the economy. The first chart shows that output is up by 28 per cent and 41 per cent respectively in the professional services and ICT sectors since December 2019. By contrast, output in consumer-facing services, like retail and hospitality – where many low-paid workers work – is yet to recover to pre-pandemic norms.
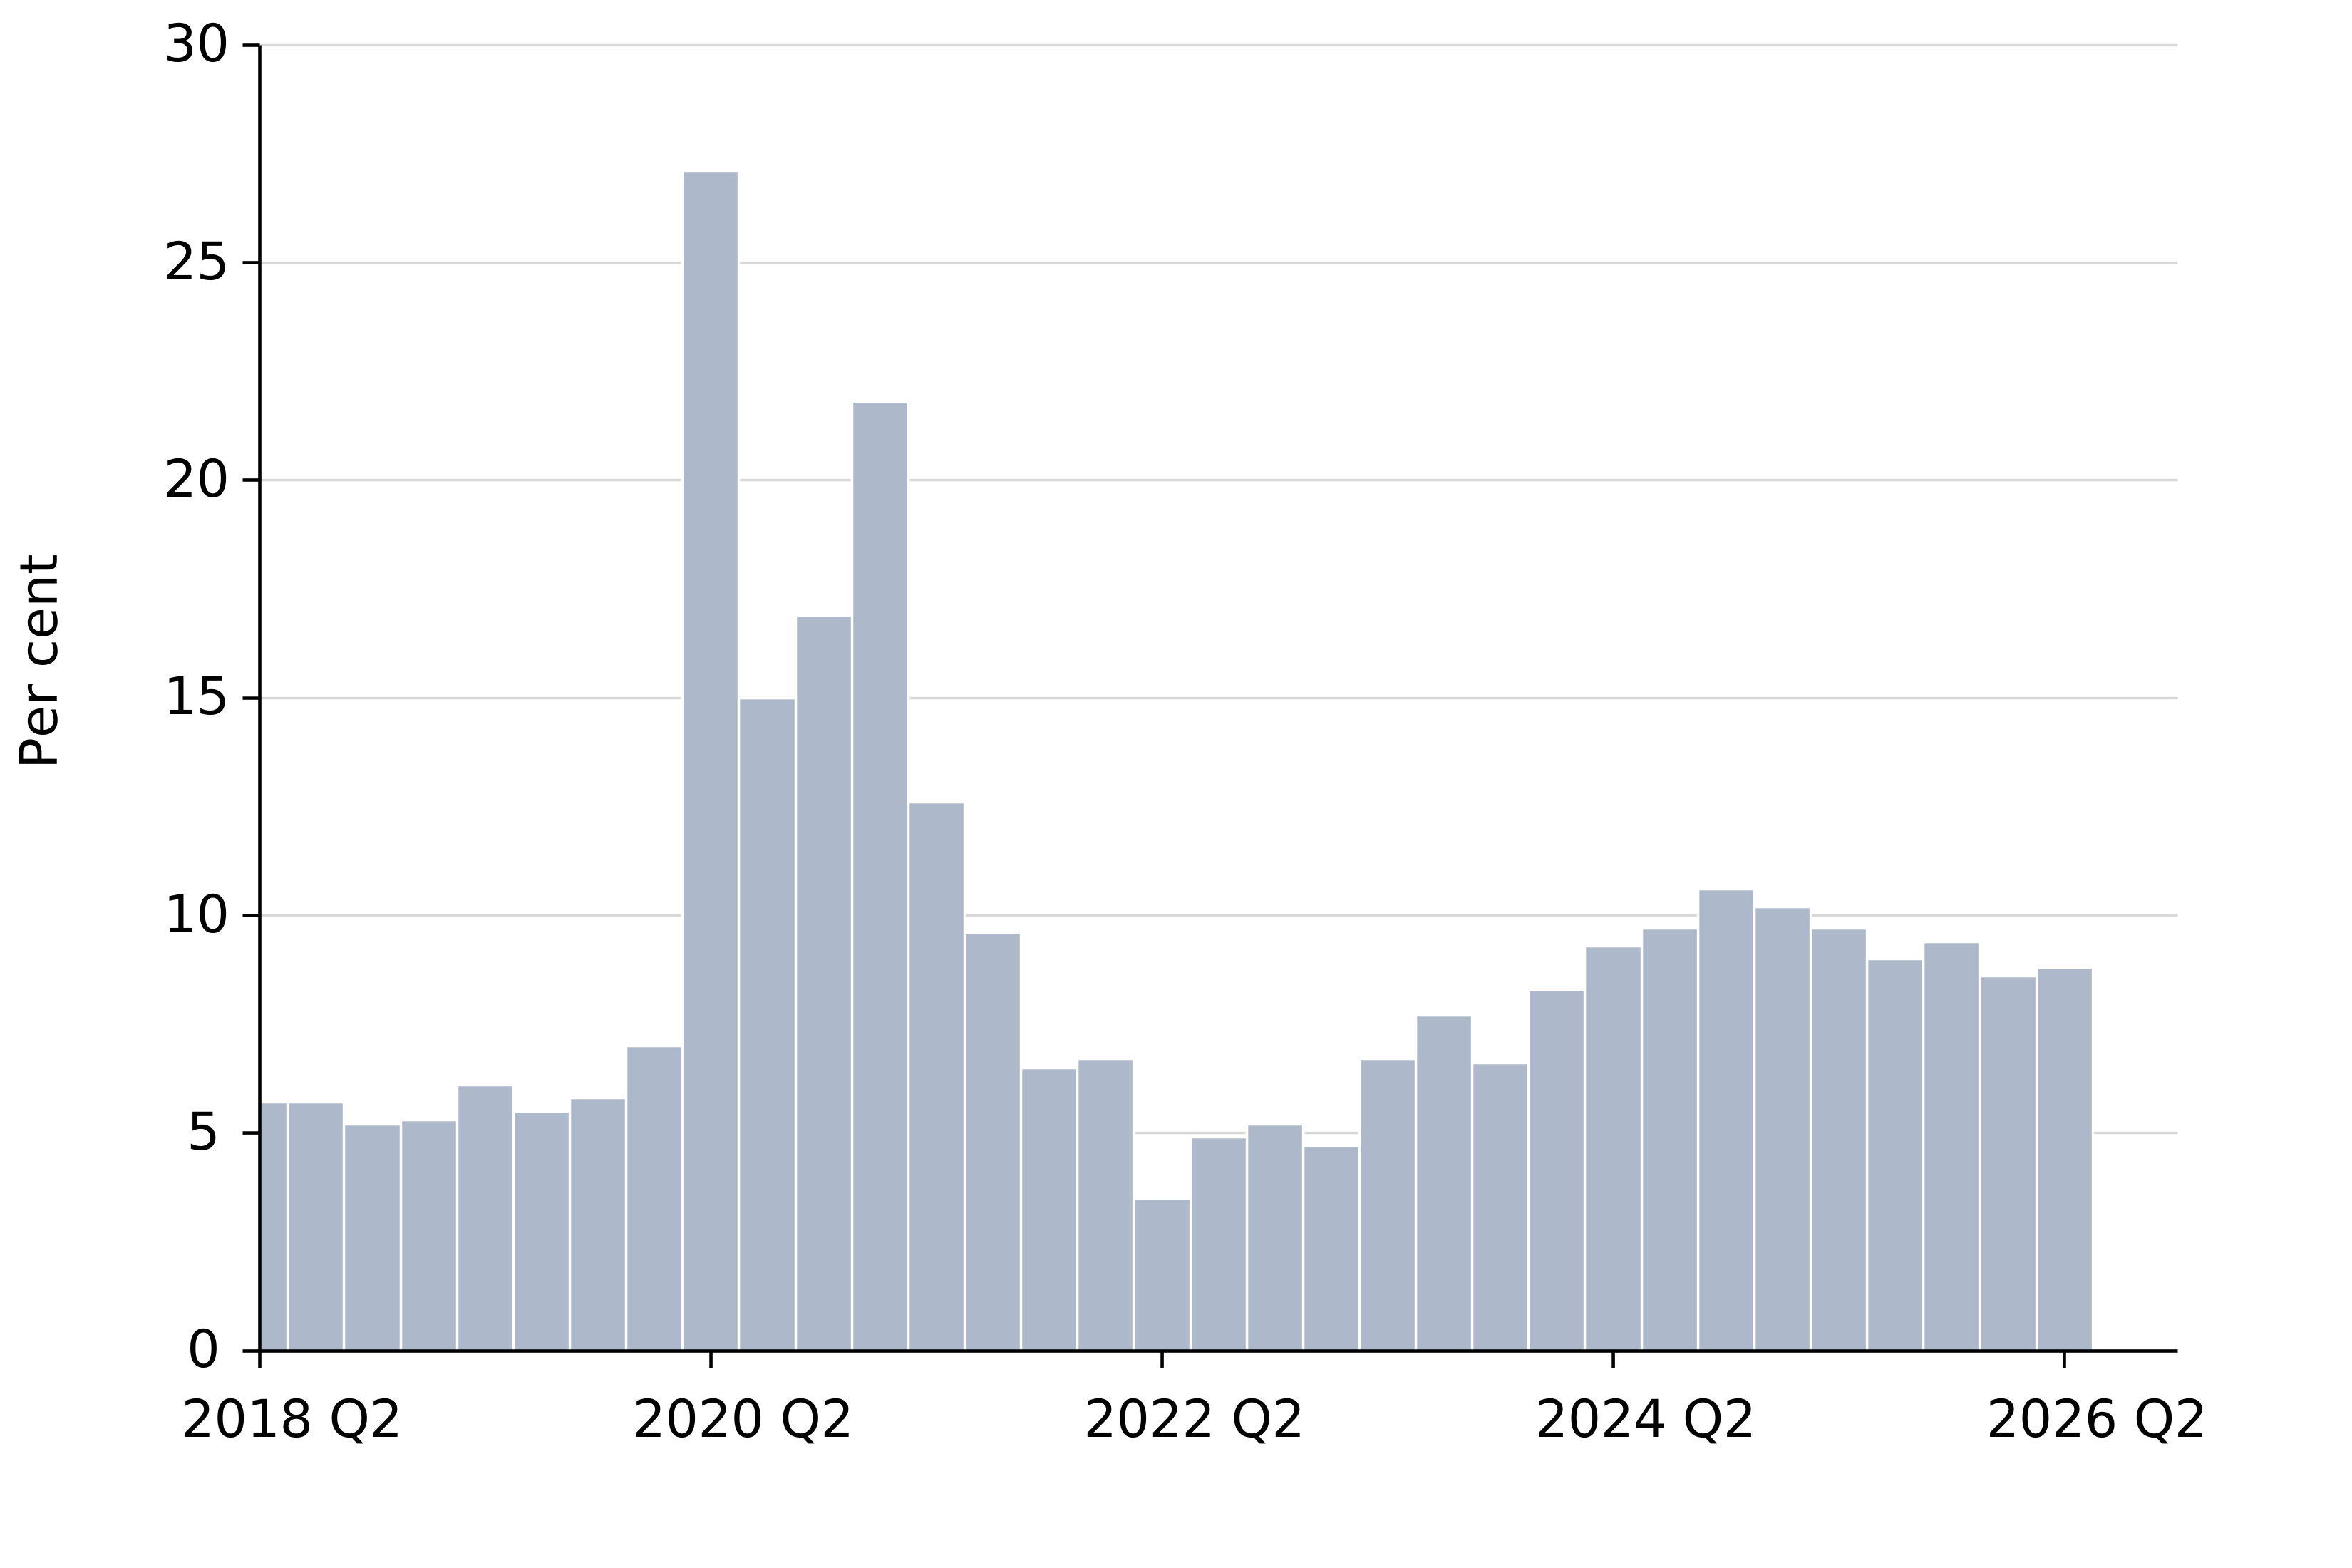
Consumer spending improved over the summer, with some growth in retail sales, but overall consumers are still saving at elevated levels. The second chart shows that the savings ratio (saving as a share of GDP) is still elevated at just below 9 per cent, compared to the pre-pandemic norm of around 5 per cent. However, not all consumers or households are able to save or draw on savings, instead they are accruing more debt.
4.1 Monthly GVA by industry, UK, 2017-2026 (December 2019 = 100)
4.2 Household saving ratio (per cent of GDP), 2018-2026
5. Higher than expected growth is not translating into hiring
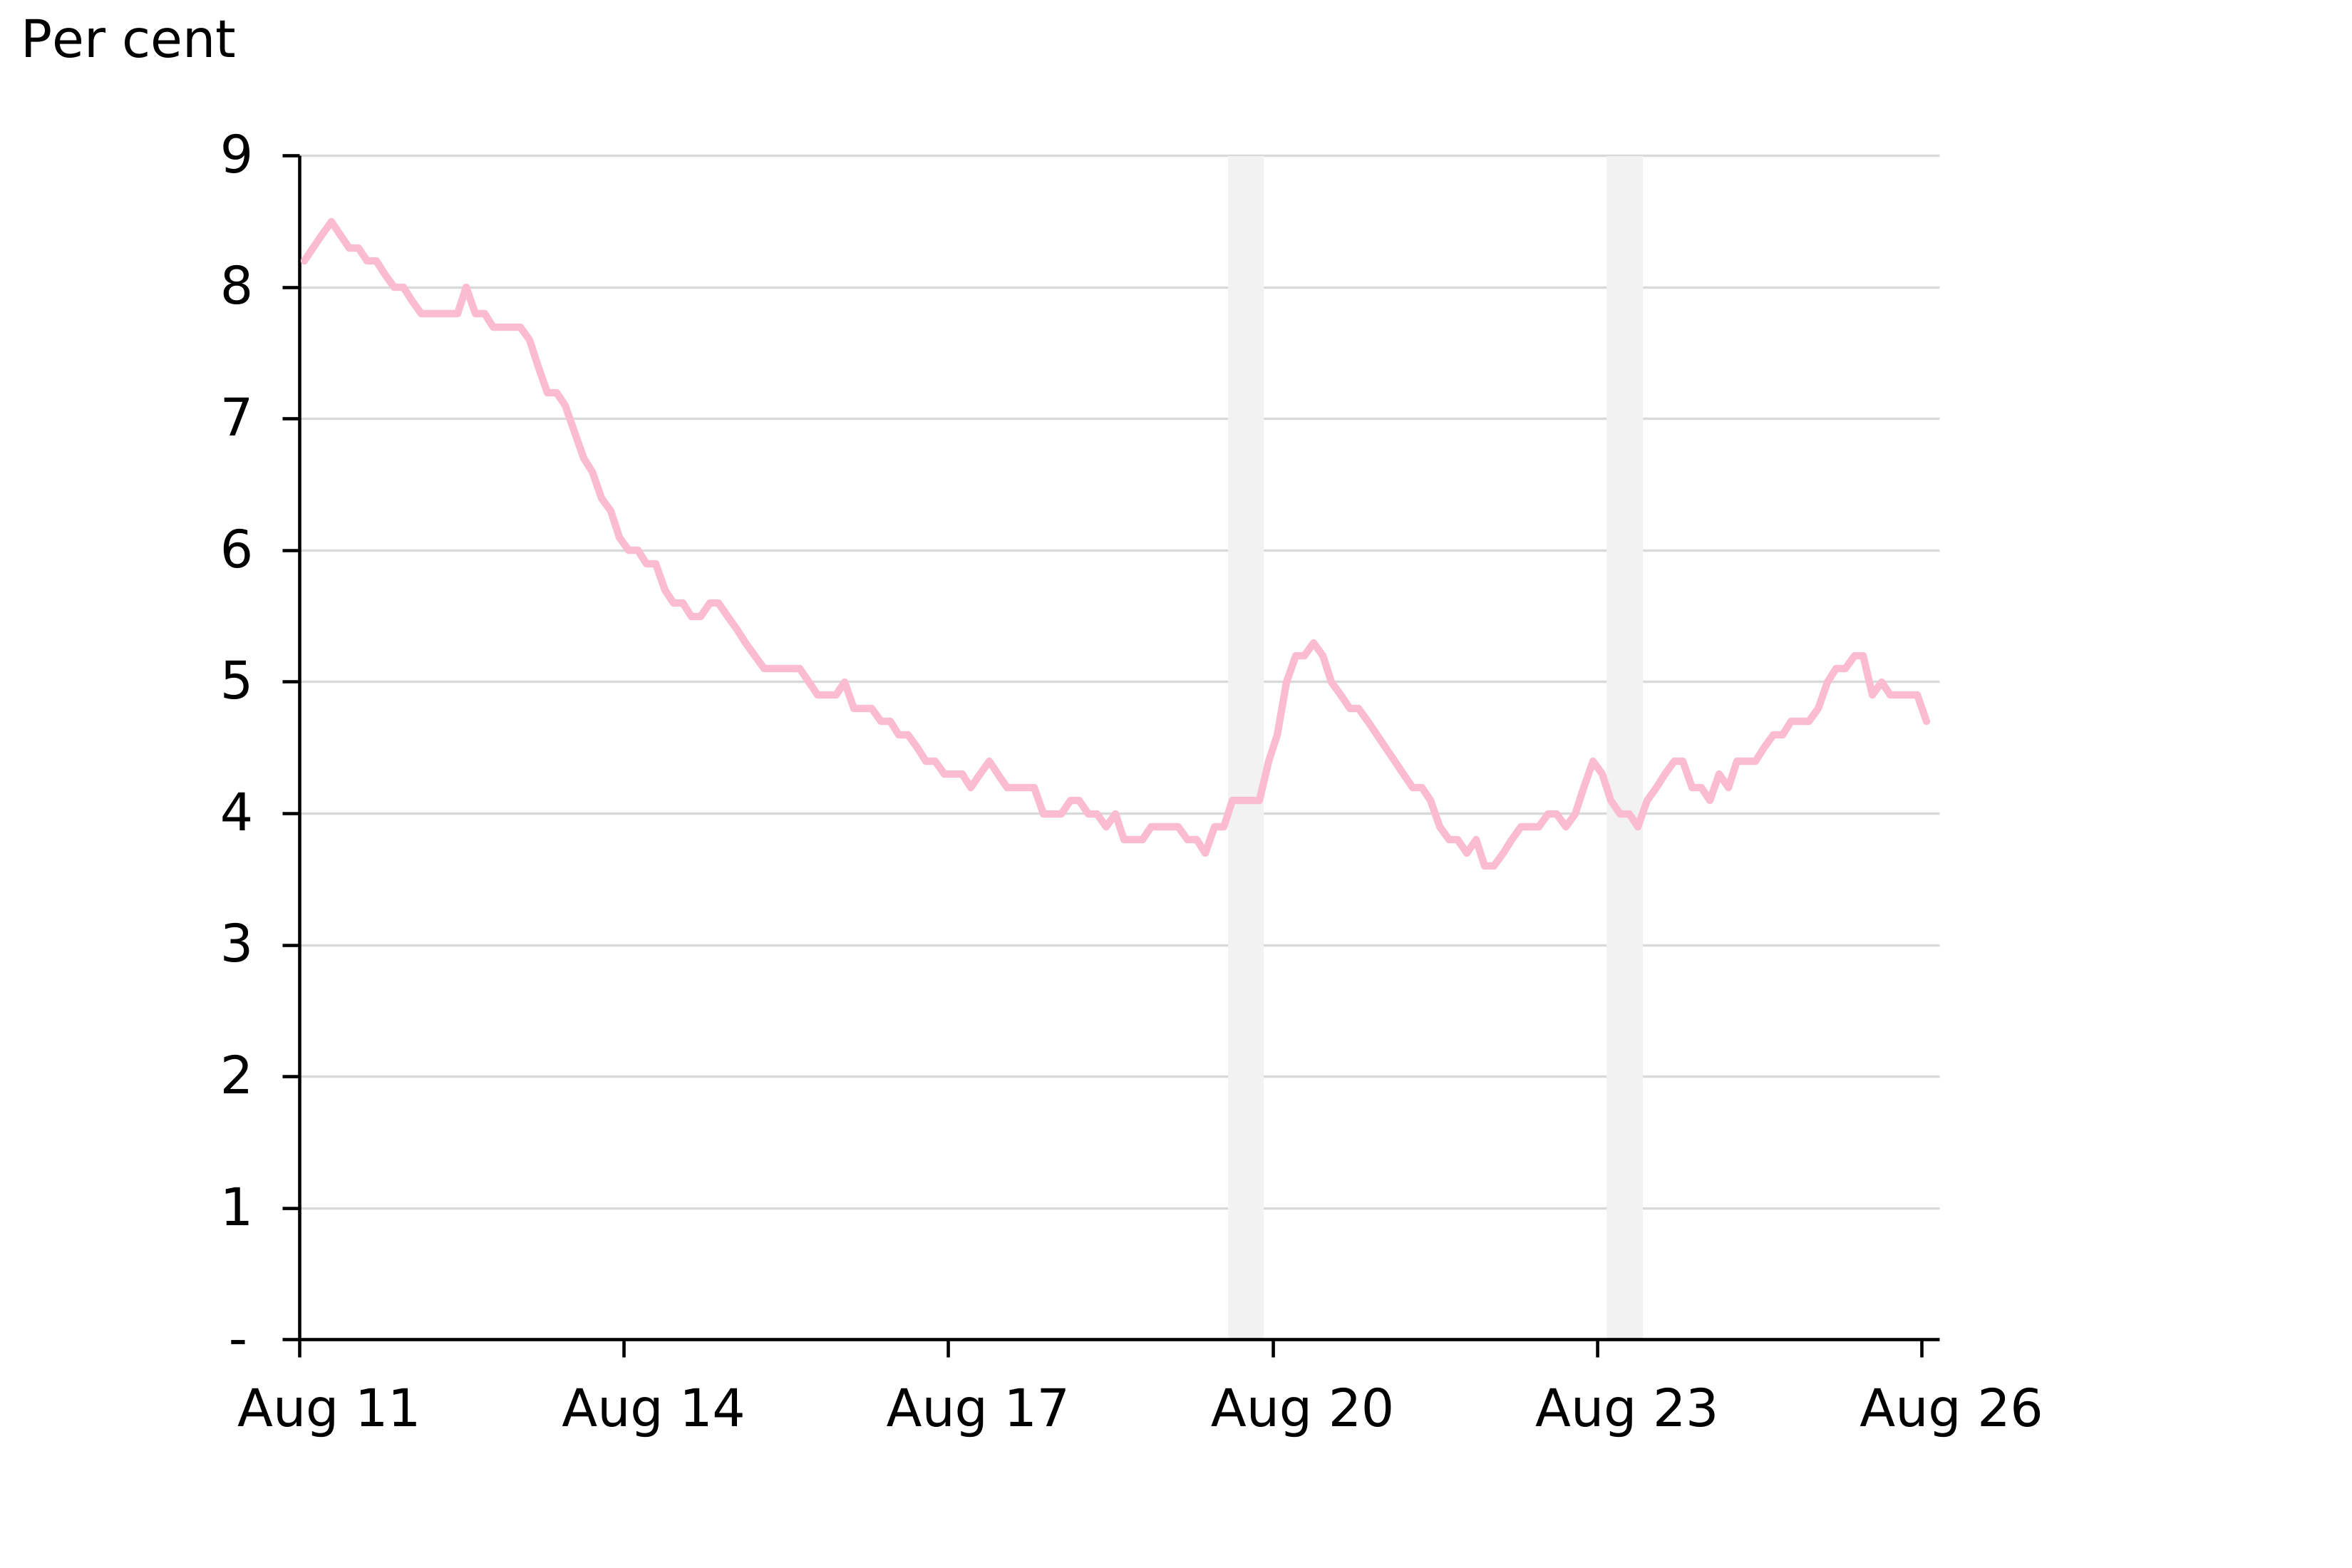
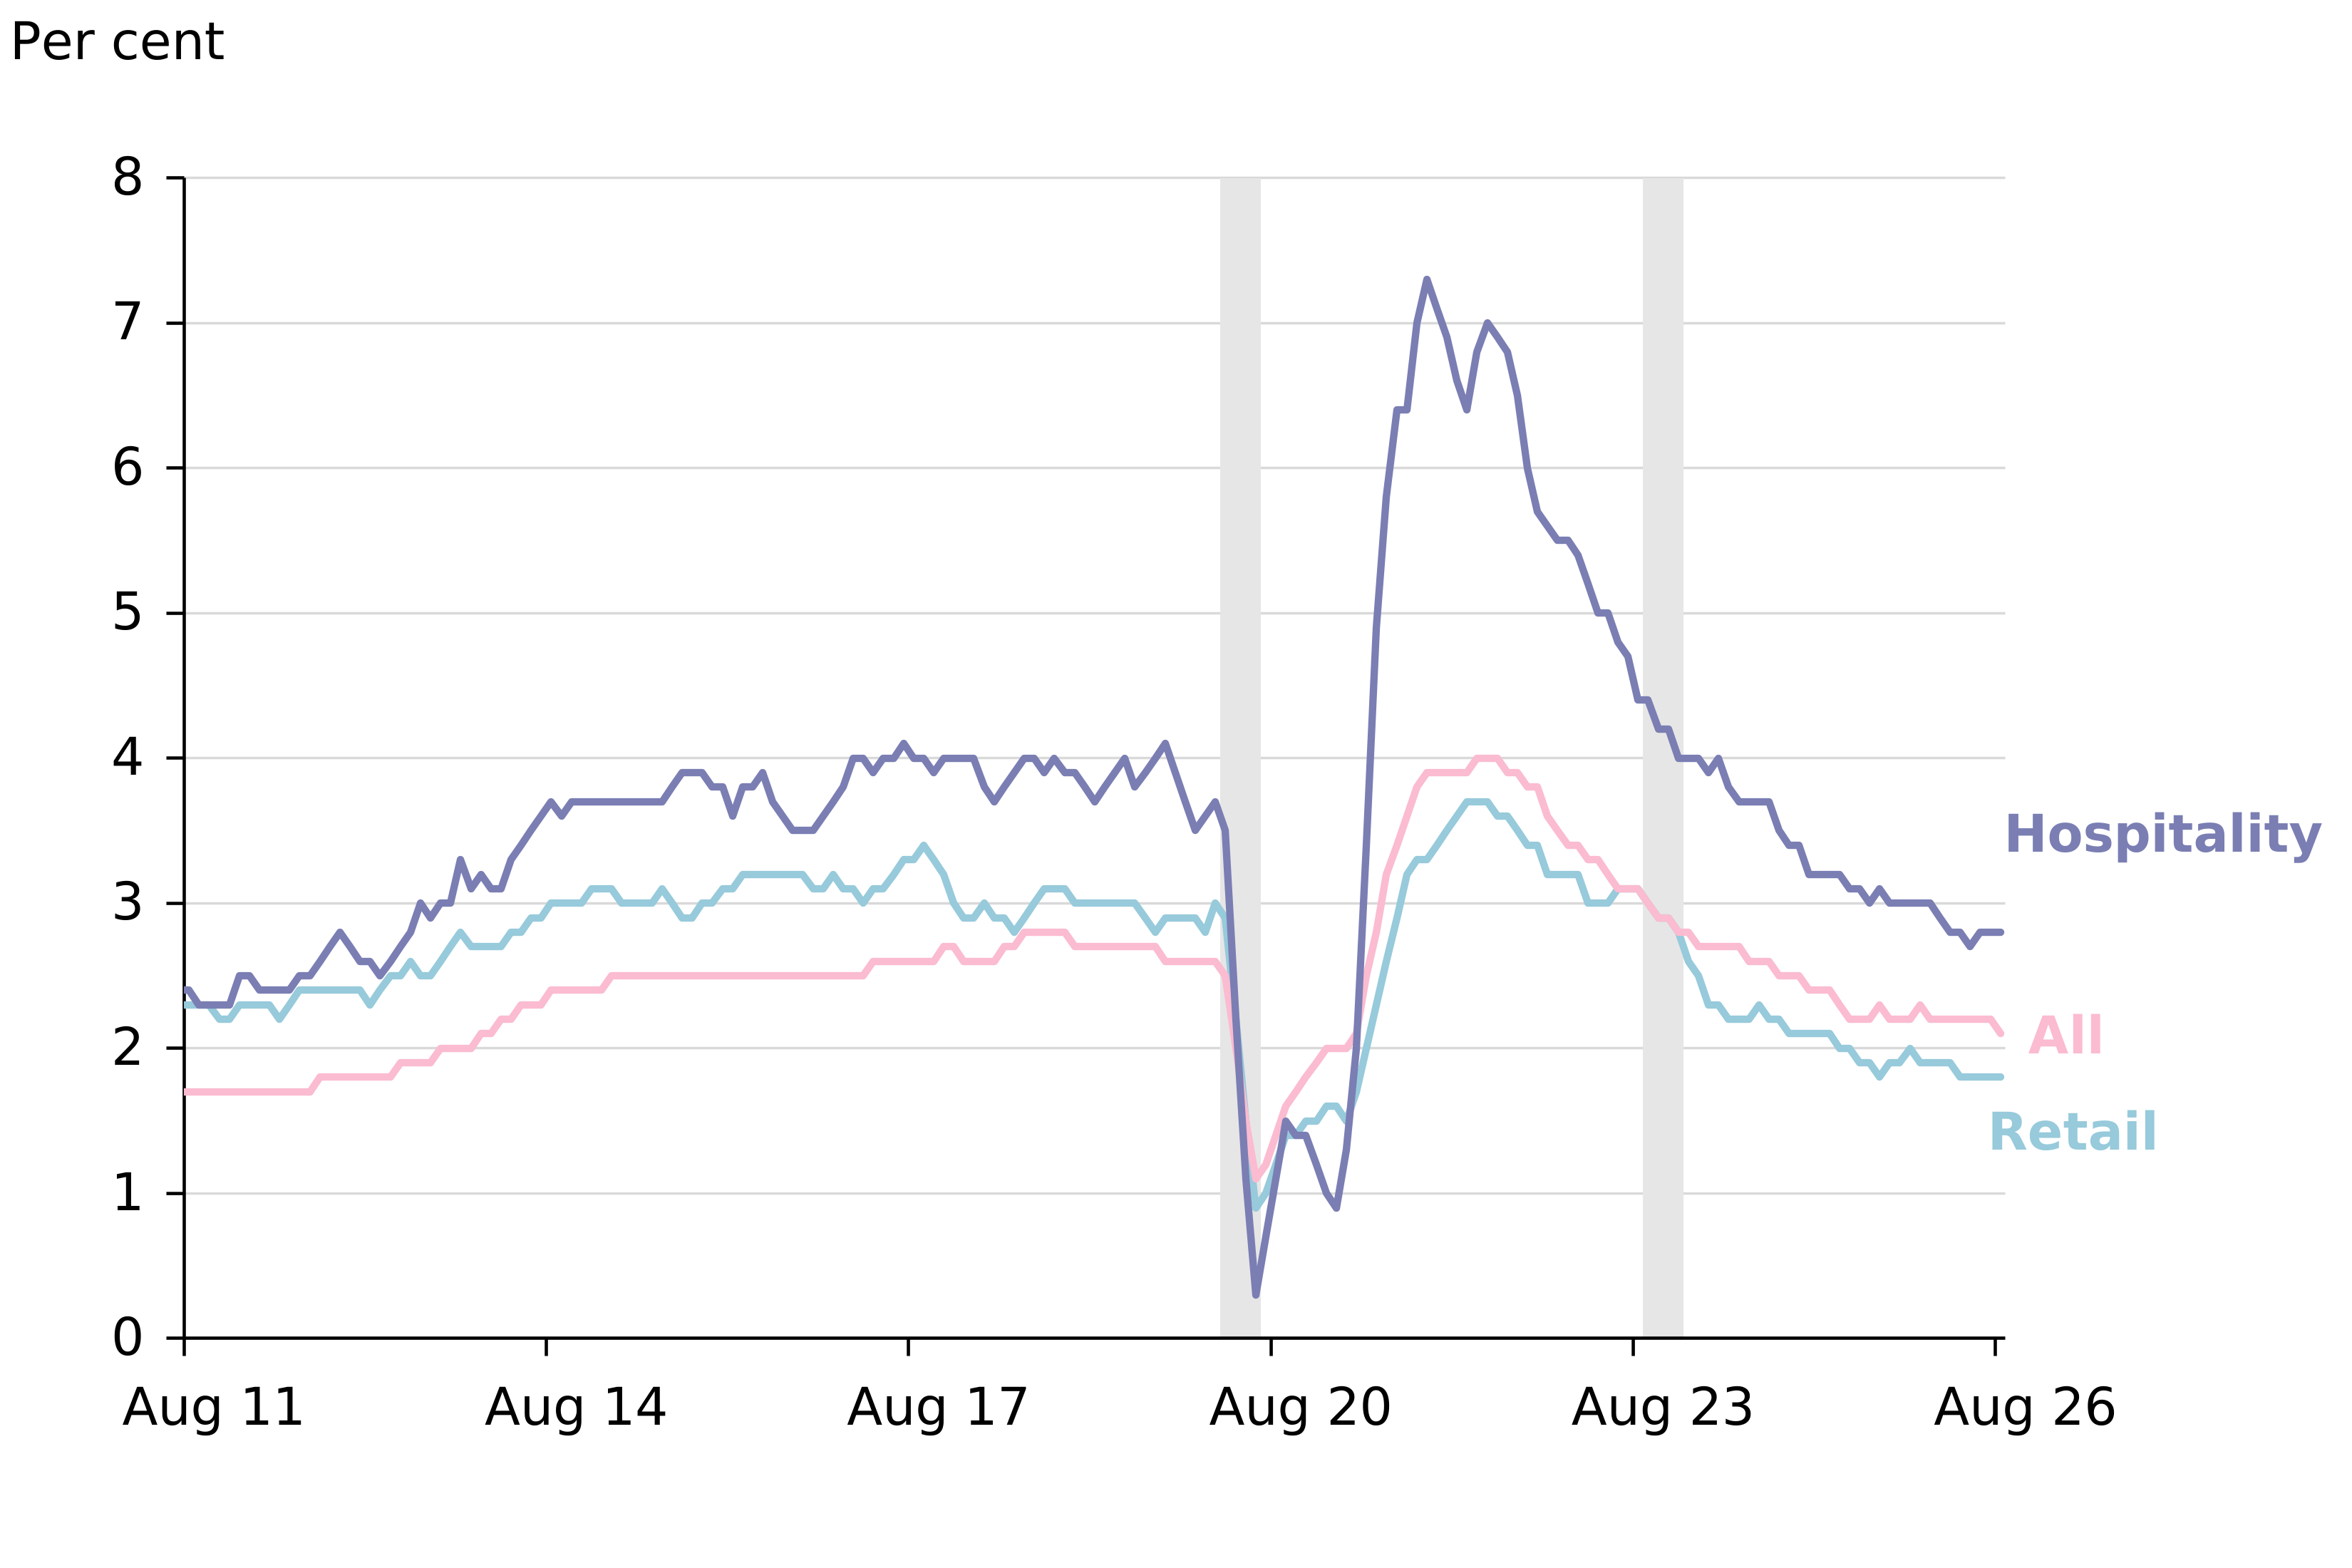
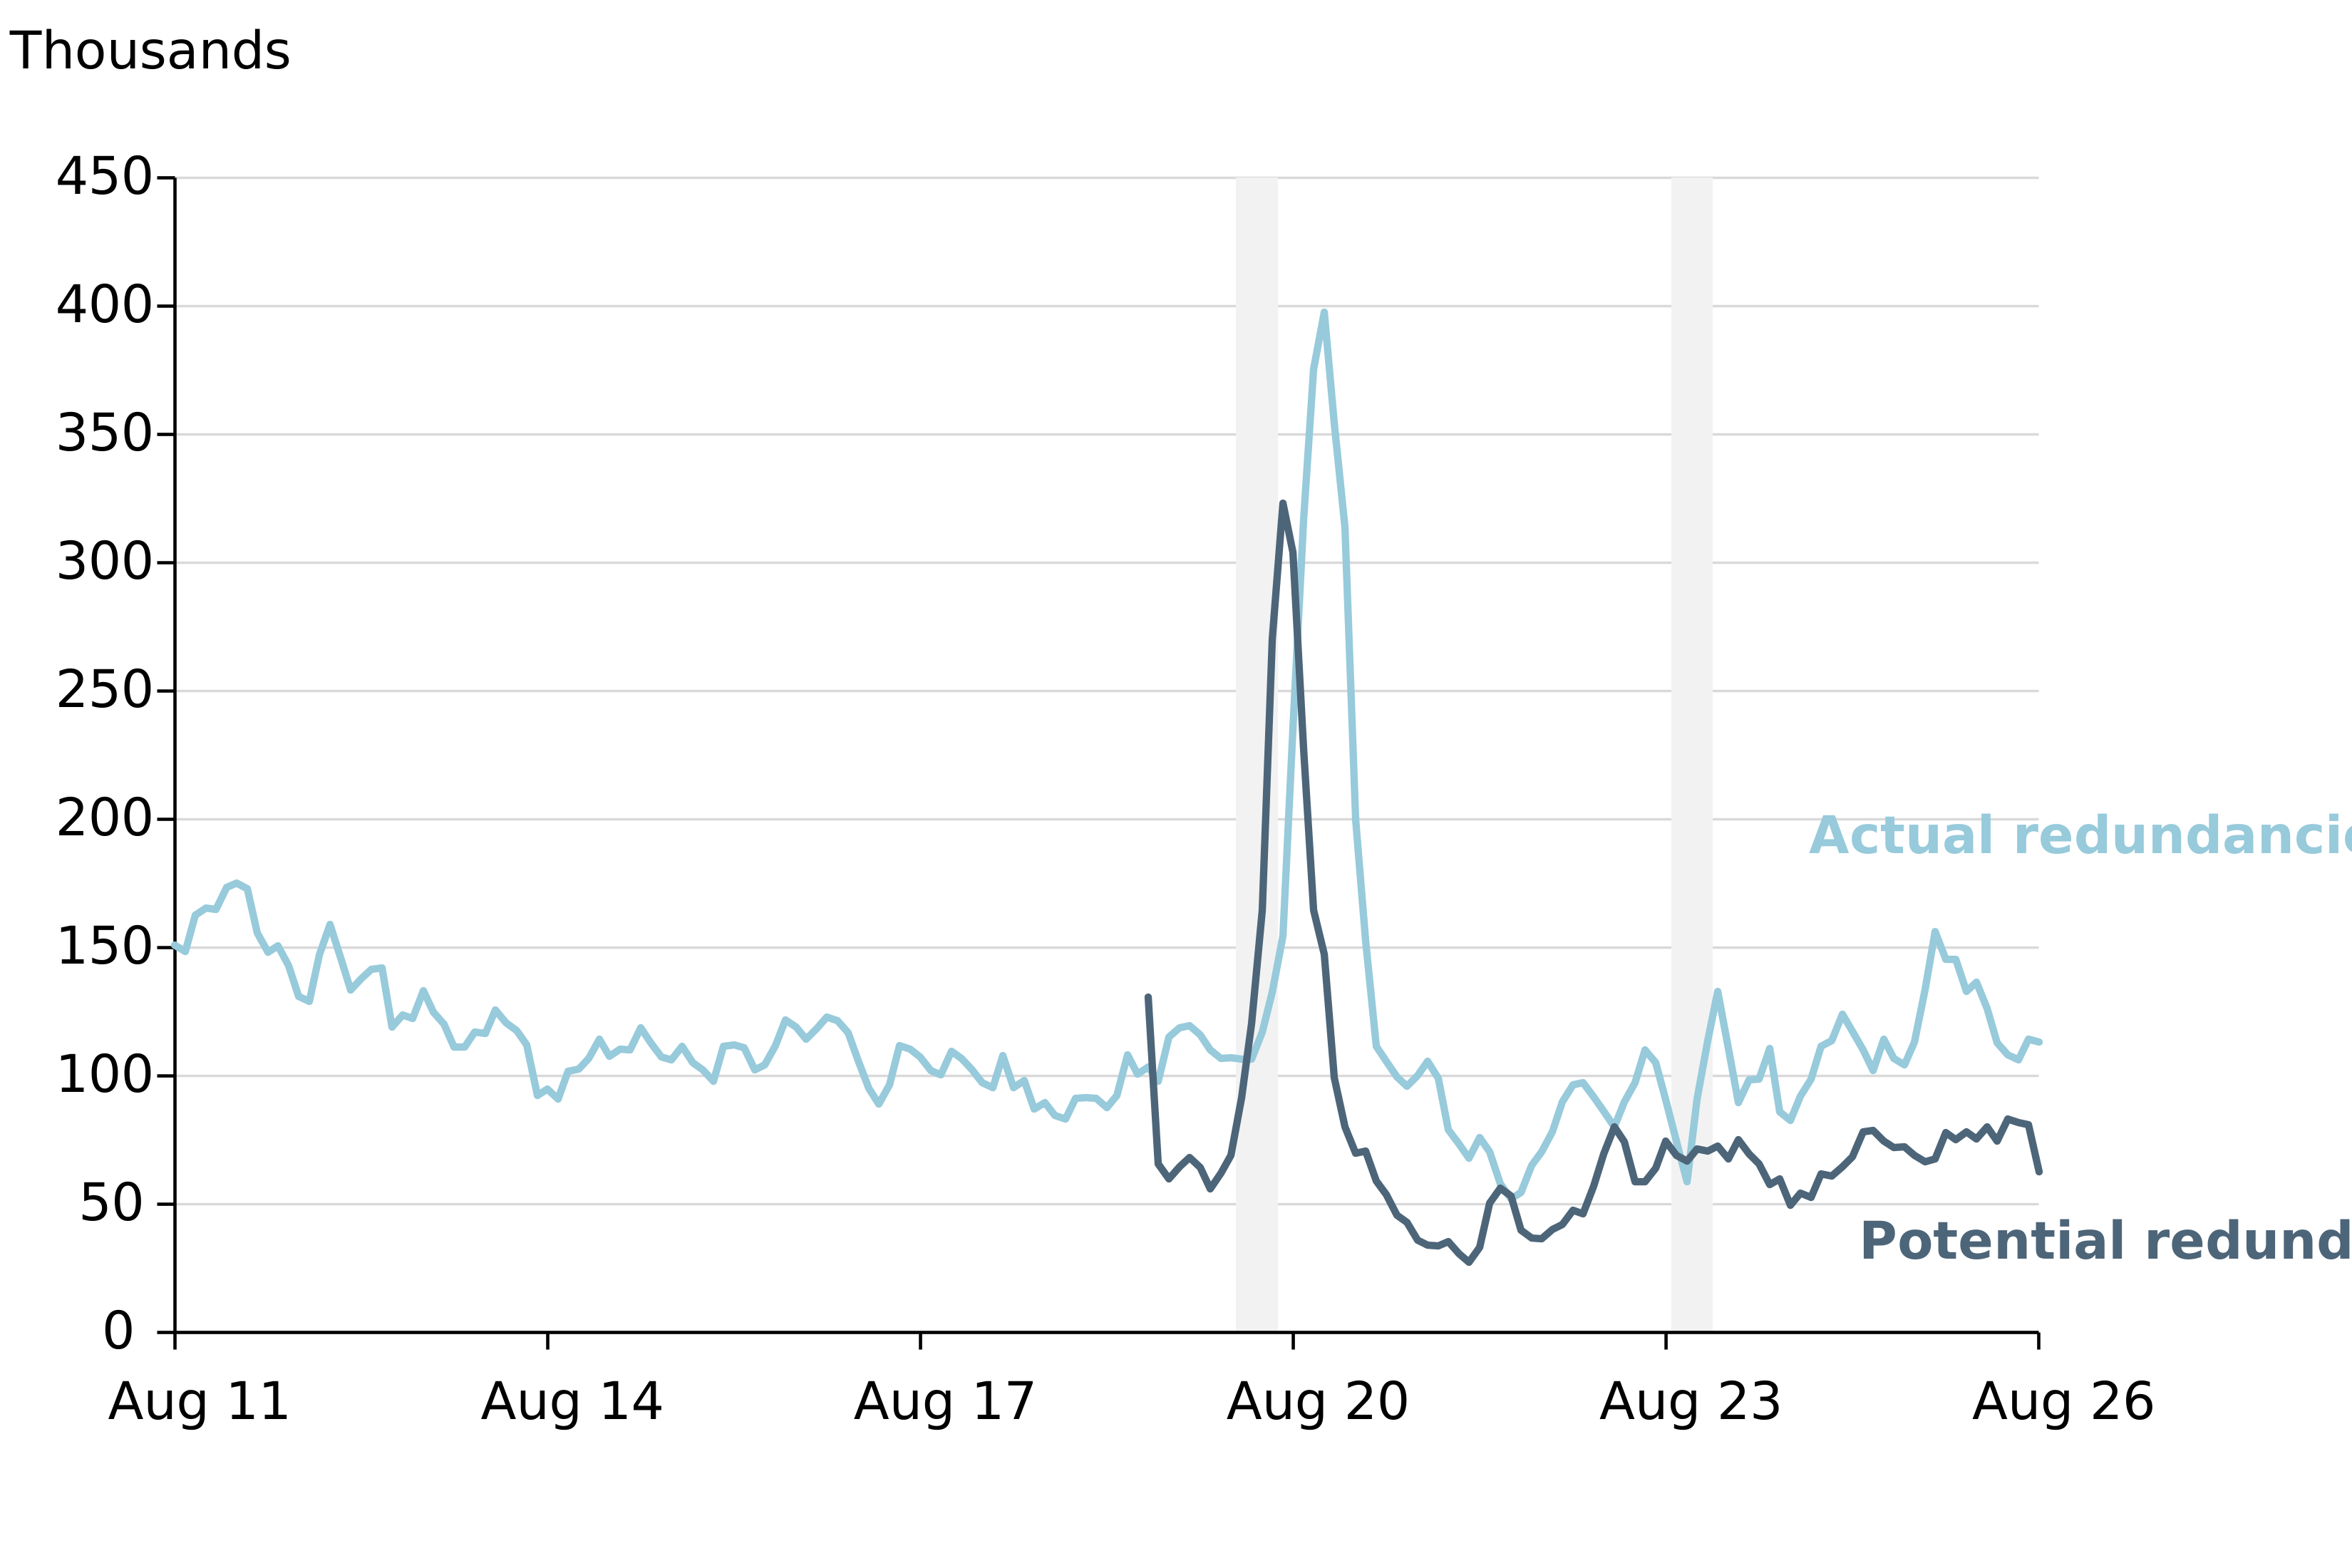
This higher-than-expected output growth does not seem to be translating into increased hiring or employment growth. Instead, the “low hire, low fire” labour market has continued into 2026. While unemployment has seen a small decline since the turn of the year, both vacancy rates and levels are at their lowest – outside of the pandemic – since 2014. Hiring in retail and hospitality is particularly weak, and more broadly the level of redundancies has increased moderately since the end of the pandemic, but fallen over 2026.
5.1 Unemployment rate, 16+, 2011-2026
5.2 Job vacancy rate, 2011-2026
5.3 Potential redundancies (HR1s) & actual redundancies (LFS), 2011-2026
6. Stakeholders are concerned about economic risks on the horizon
Our stakeholders are concerned about the risks stemming from the ongoing global conflicts, including the Middle East and Ukraine. There is potential for an energy cost shock that would hit business costs and prices, affecting household spending power and adding to inflation in the rest of the economy. In response, the Bank of England may lift interest rates, further squeezing firms and households.
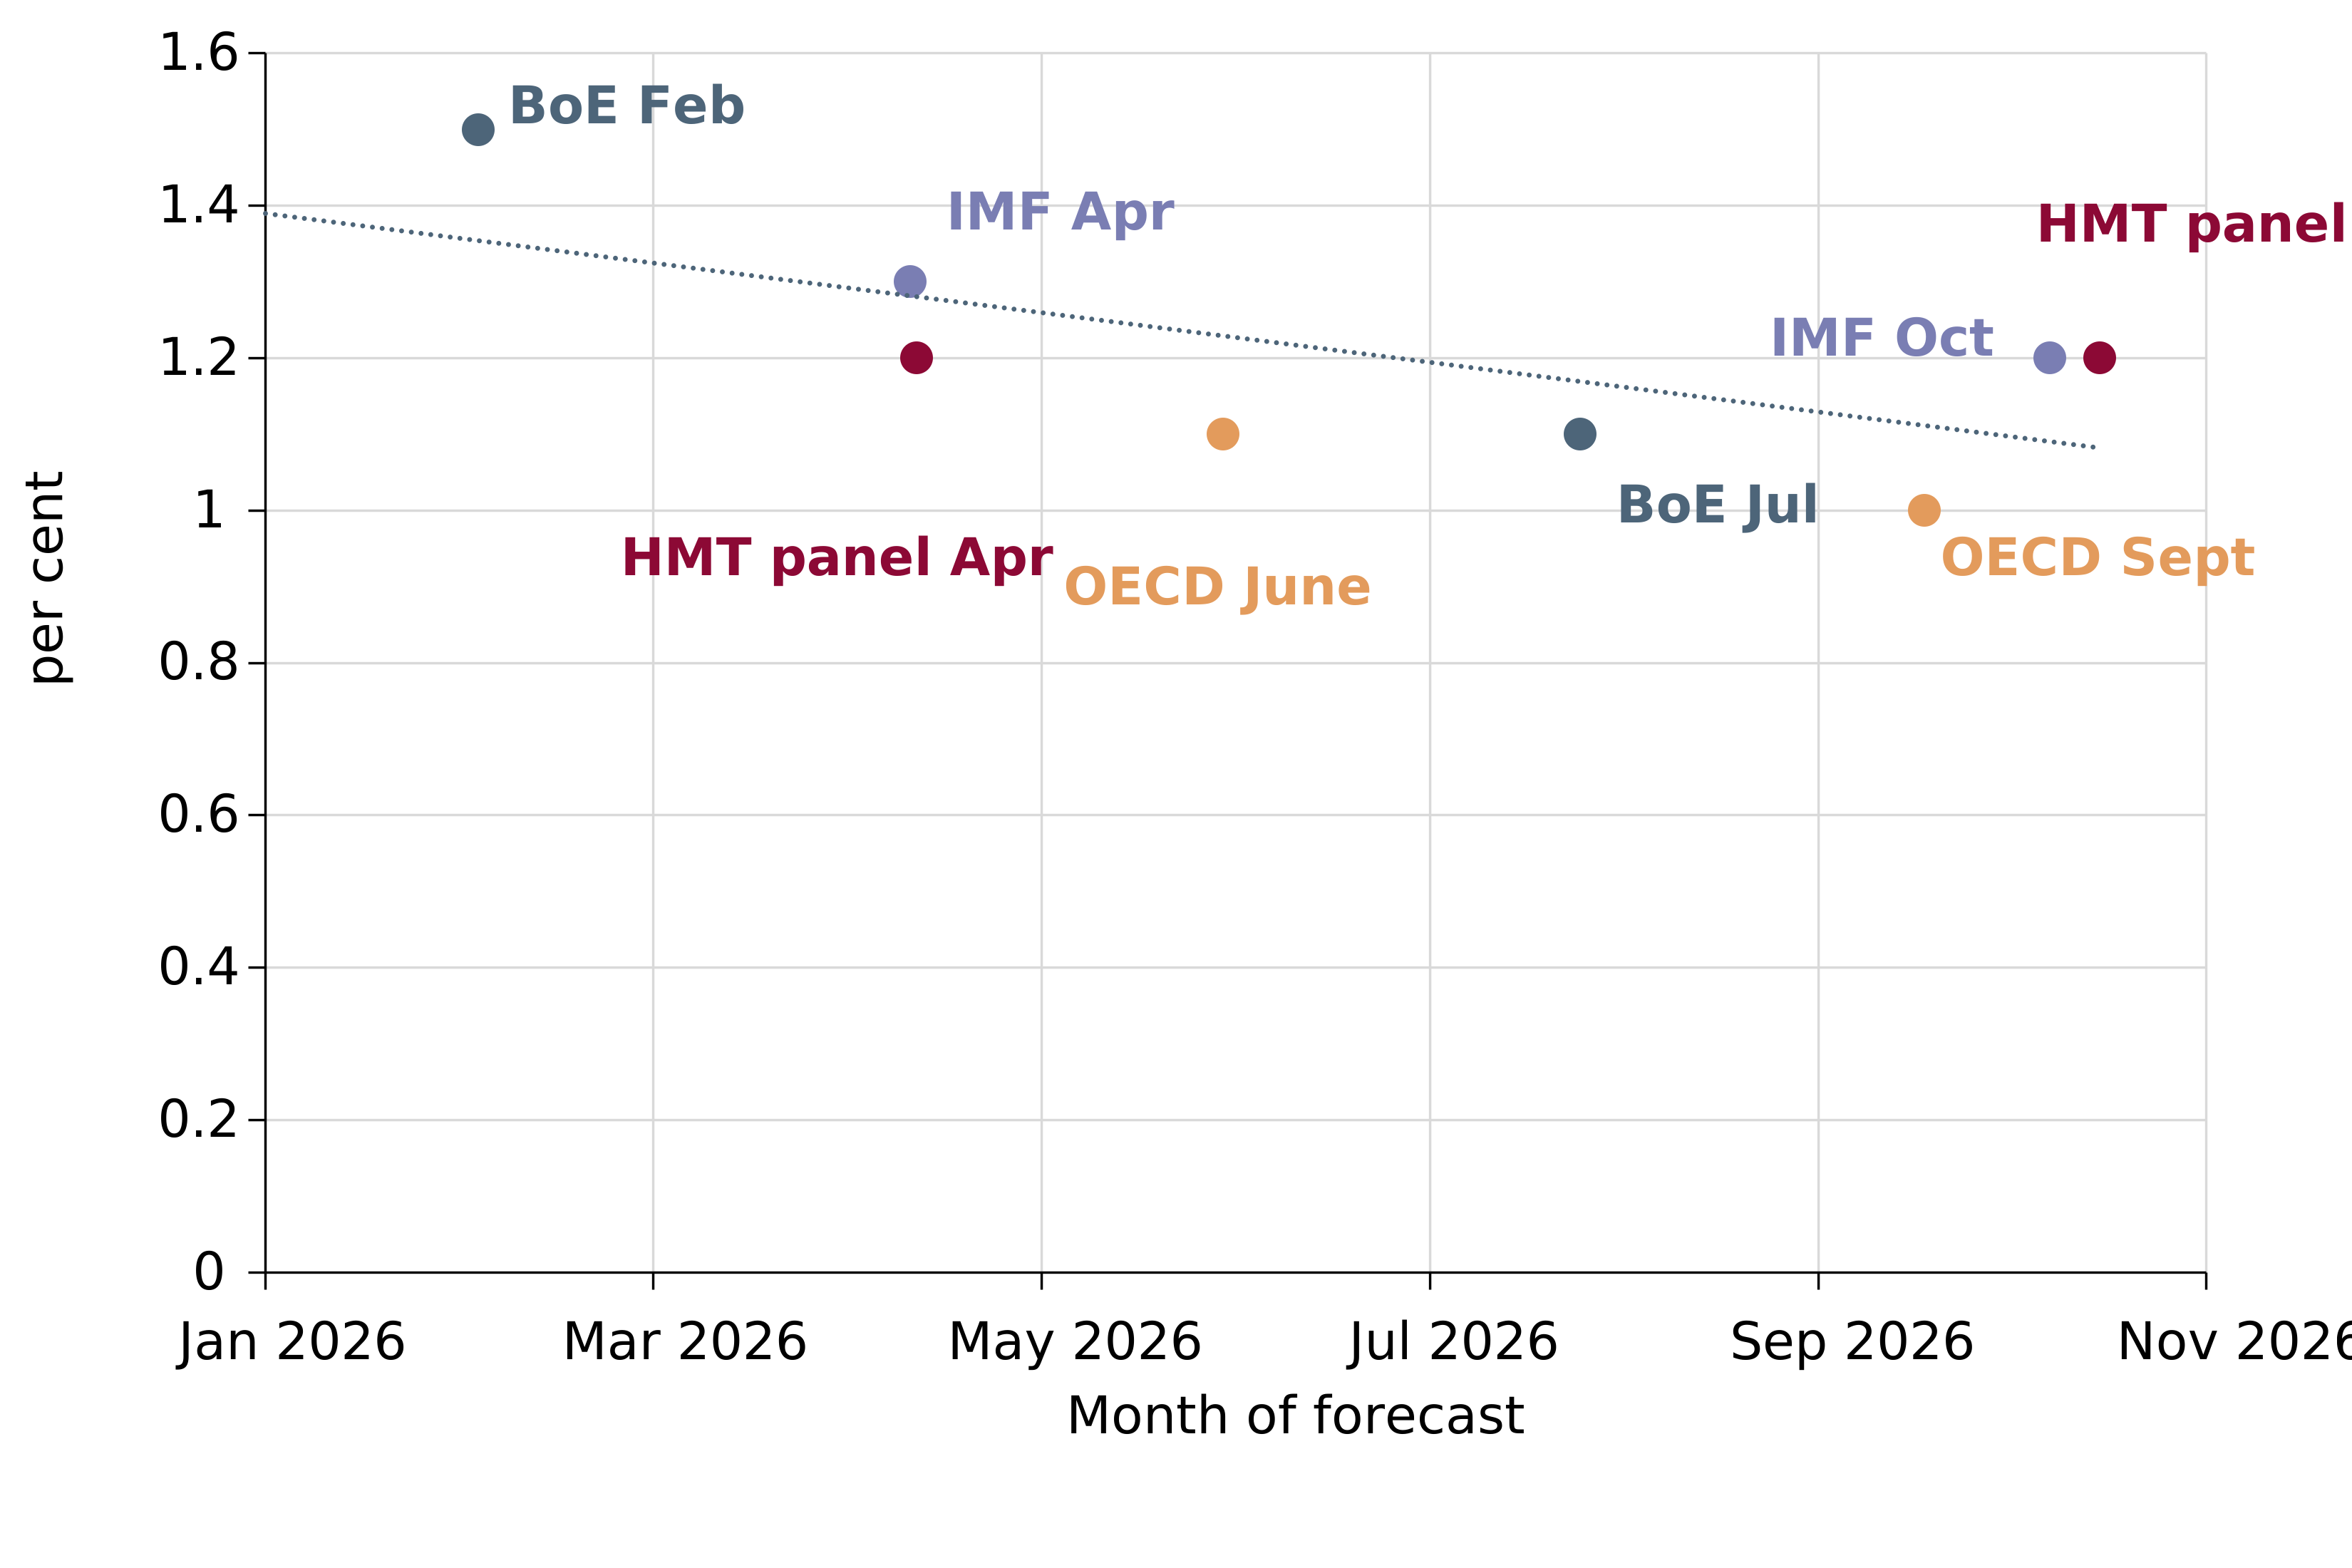
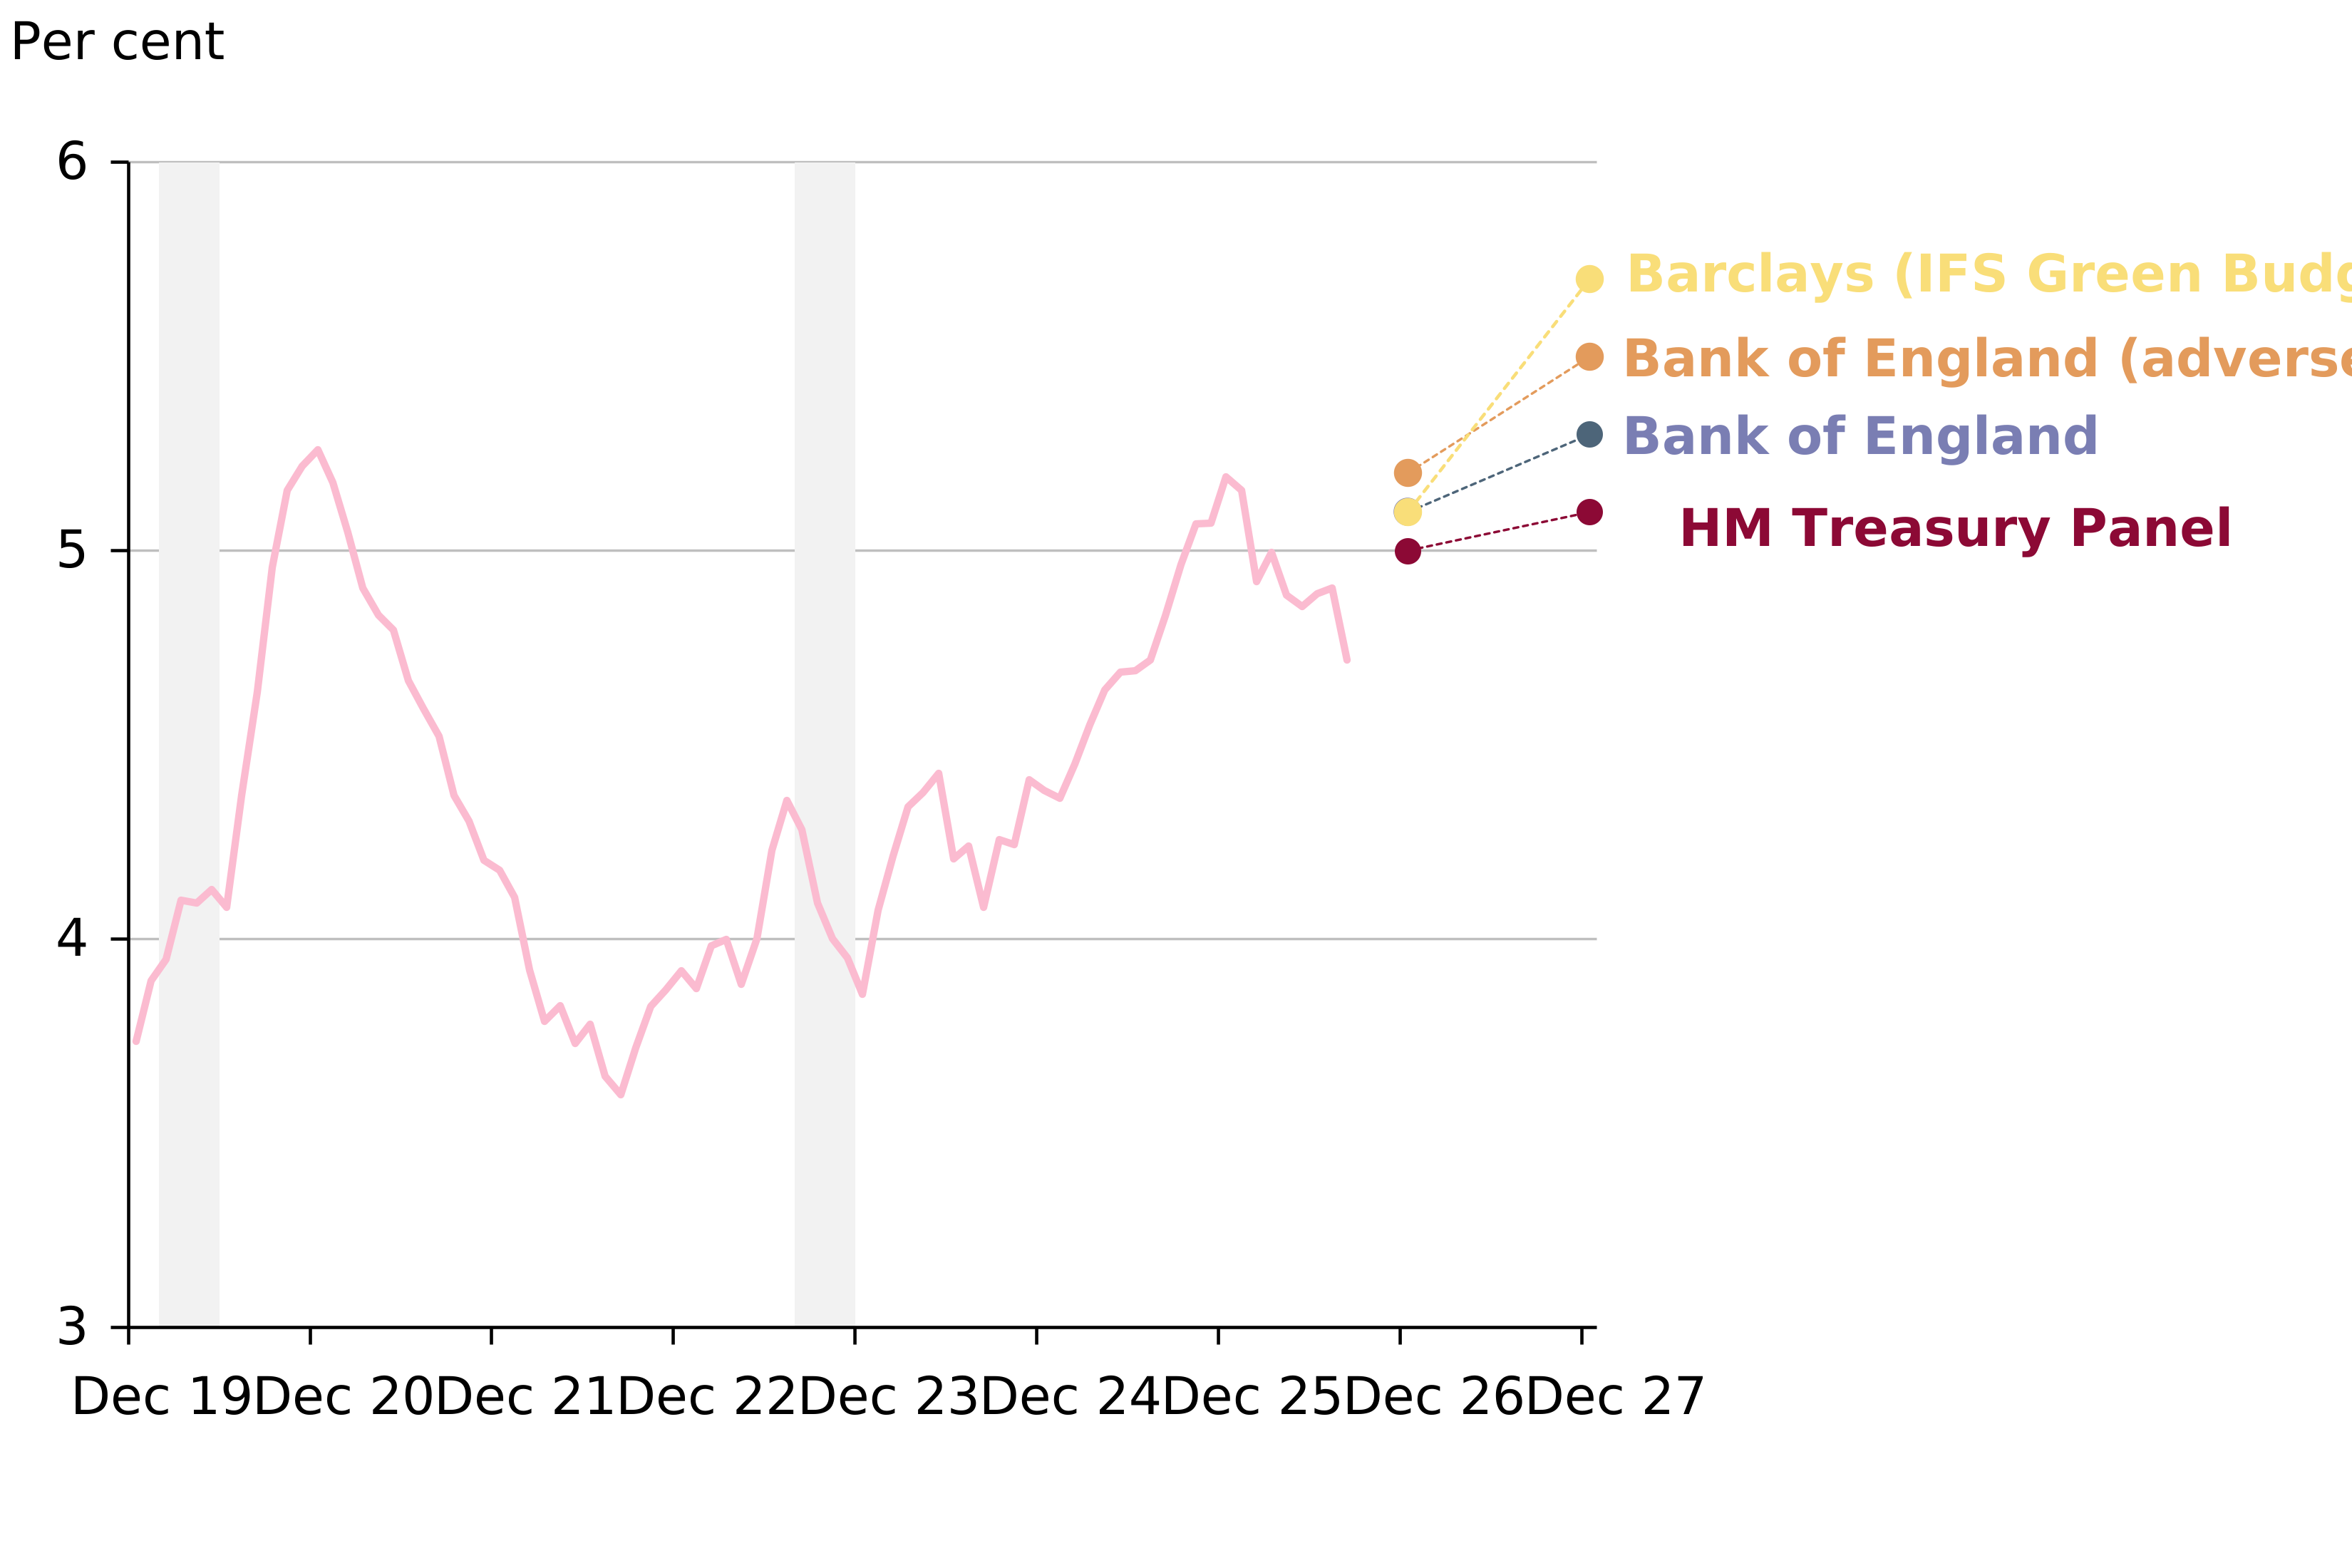
While forecasters have revised up their expectations for economic growth in 2026, they have tended to revise them down for 2027. Also, forecasters expect unemployment to rise over the next two years (chart 6.2).
Representatives of business and workers expressed their concerns about the impact on those they represent.
The TUC told us of their concerns for low-paid workers: ”The energy price cap is set to rise, and significant increases are expected in the price of food. This is likely to have bigger impacts on the poorest households as a higher proportion of their income is spent on essentials.”
Similarly, on the business side, the BRC said “Renewed inflationary pressure will keep interest rates higher for longer, weighing on the recovery of private consumption, with profound implications for the health of retail spending.”
6.1 2027 GDP growth forecasts, by month of forecast
6.2 Unemployment rate (16+) outturn and (selected) forecasts
7. Wage growth is falling but has still exceeded expectations
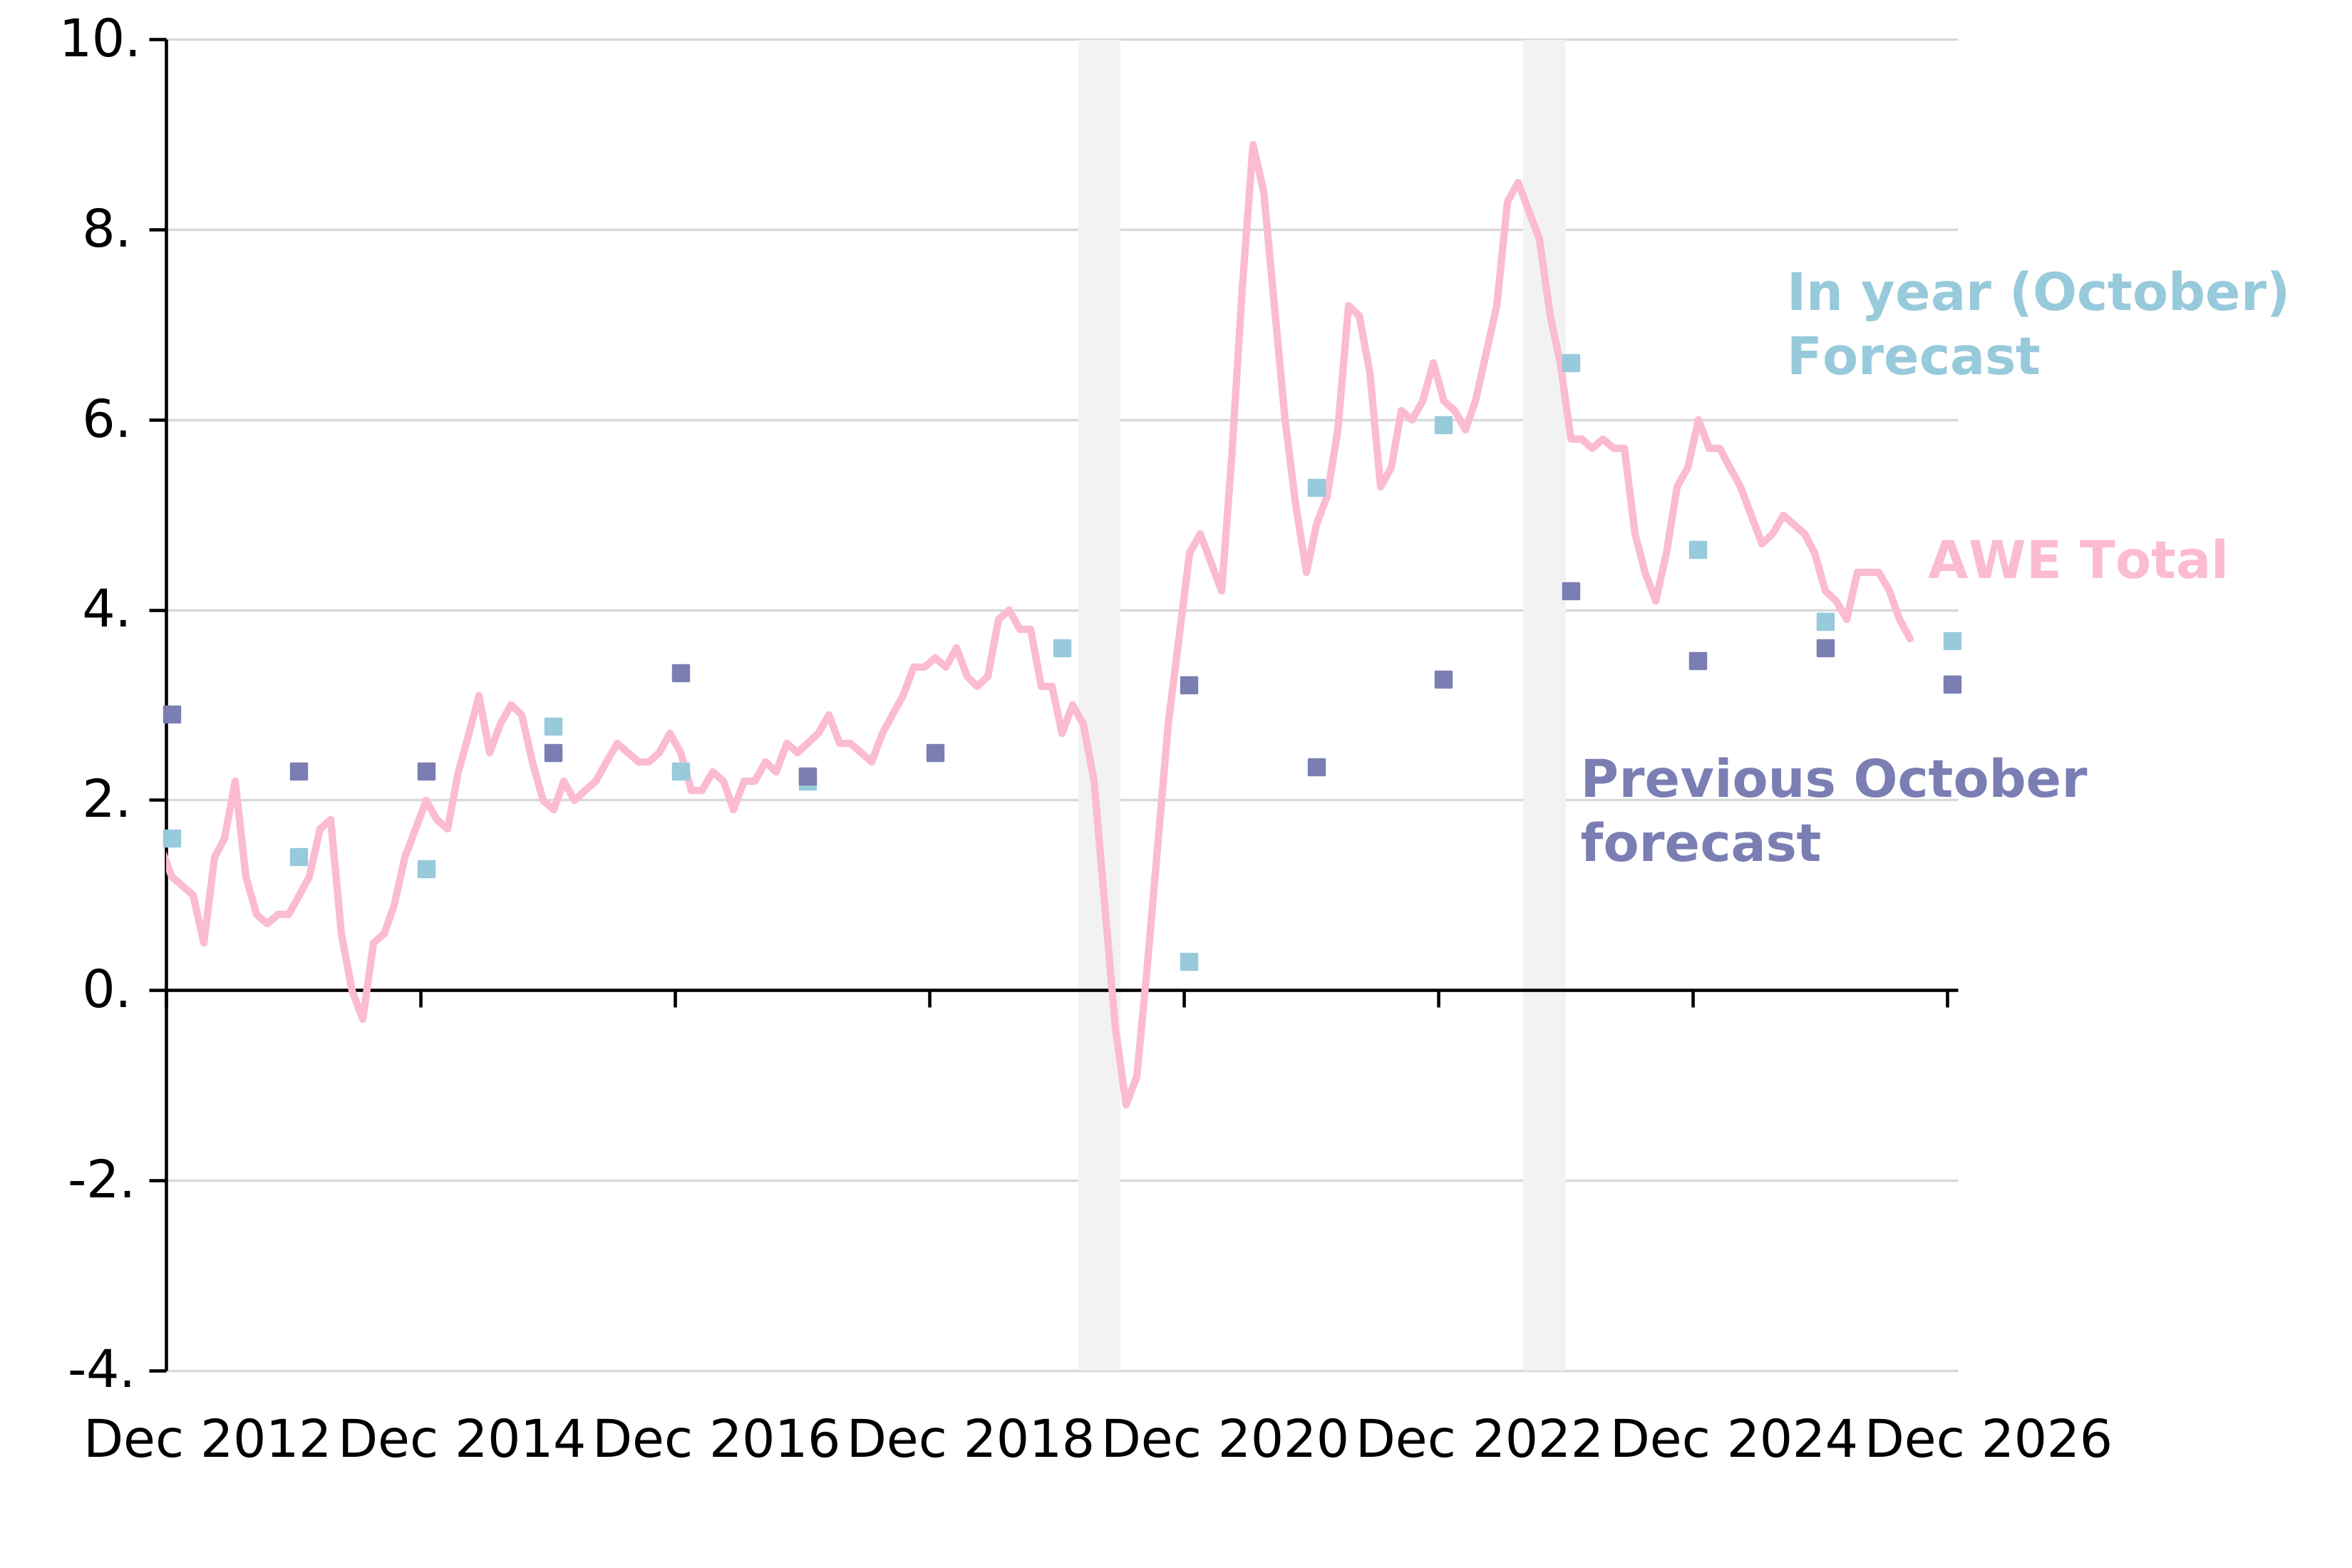
In line with the loosening labour market, wage growth has been falling for around 3 years. Average weekly earnings’ most recent peak was 8.5 per cent in the summer of 2023. It has since fallen to 3.7 per cent in August 2026.
However, despite falling in recent years, wage growth has still outstripped forecasts. On chart 7.1, the pink line showing measured weekly wage growth is above the blue and purple markers of forecast weekly wage growth.
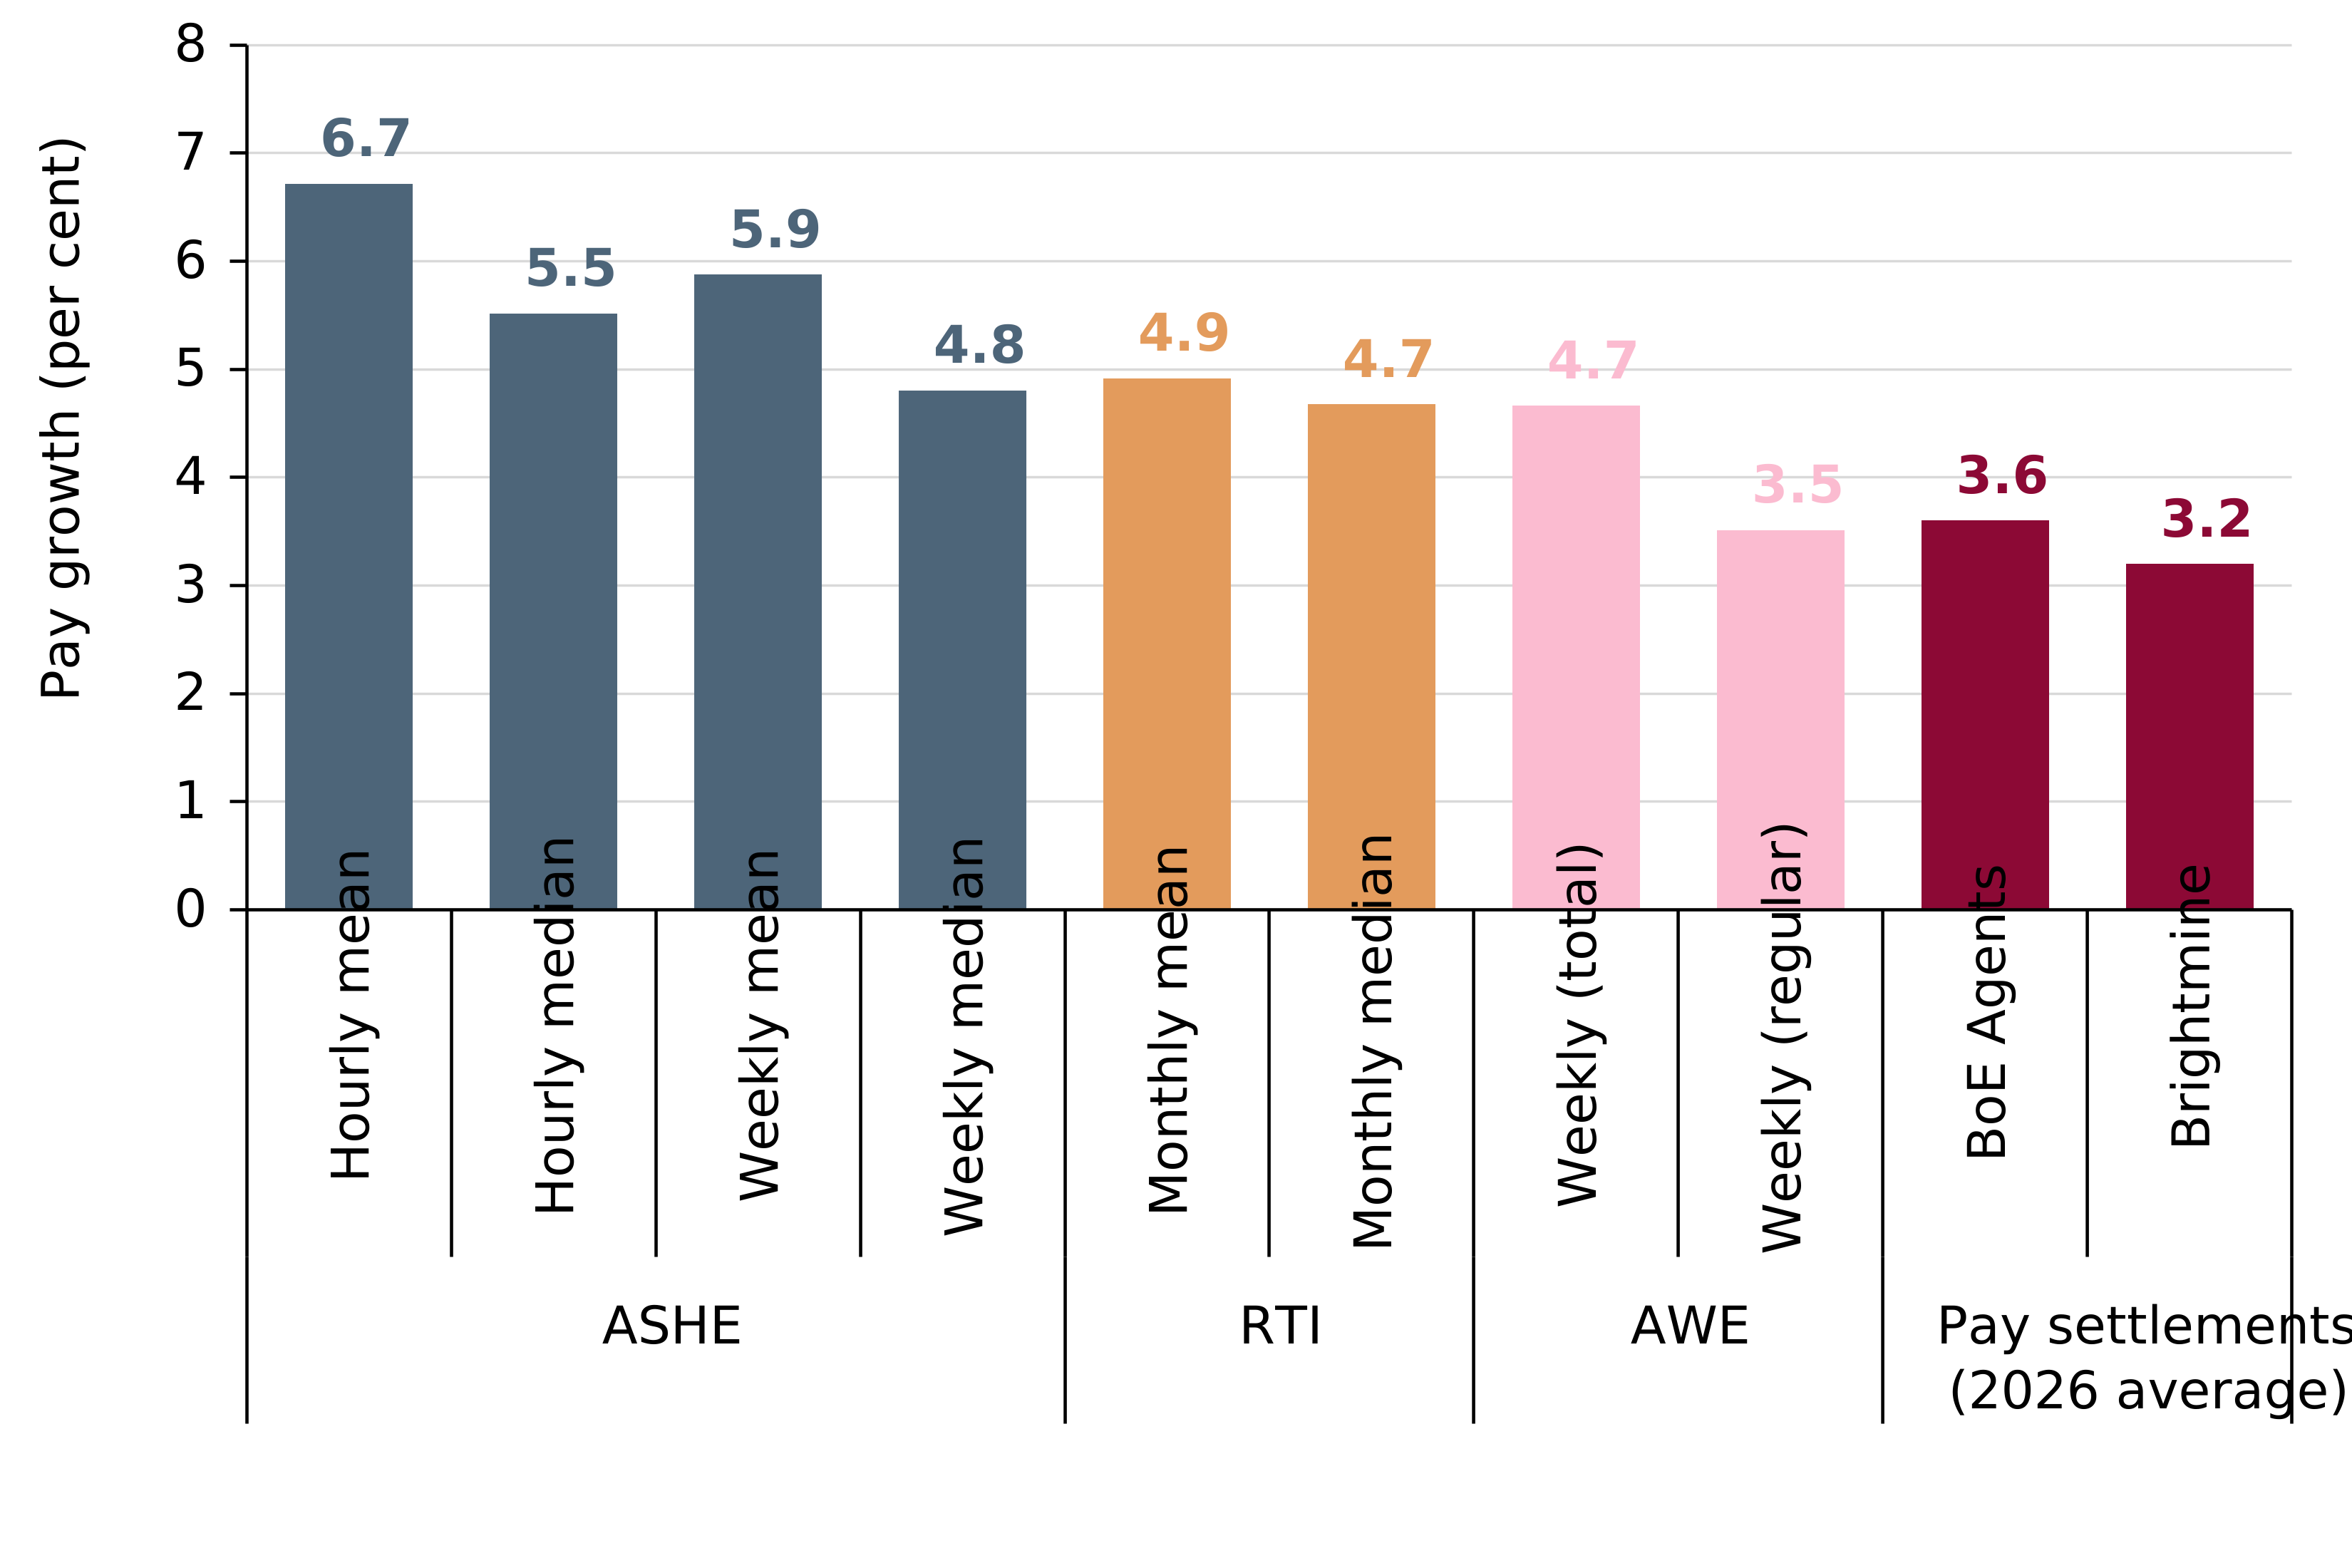
Growth in our key source of median hourly pay data (the Annual Survey of Hours and Earnings) was also higher than expected and higher than other measures of wage growth (chart 7.2 below).
This has implications for our calculation of the NLW rate needed to reach the key reference point of two thirds of median earnings.
7.1 Pay growth v forecast from the same year and previous year
7.2 Pay growth across a range of measures, April 2025-April 2026
8. The NLW bite fell in 2026, but we anticipate it rising again following our recommendation for 2027
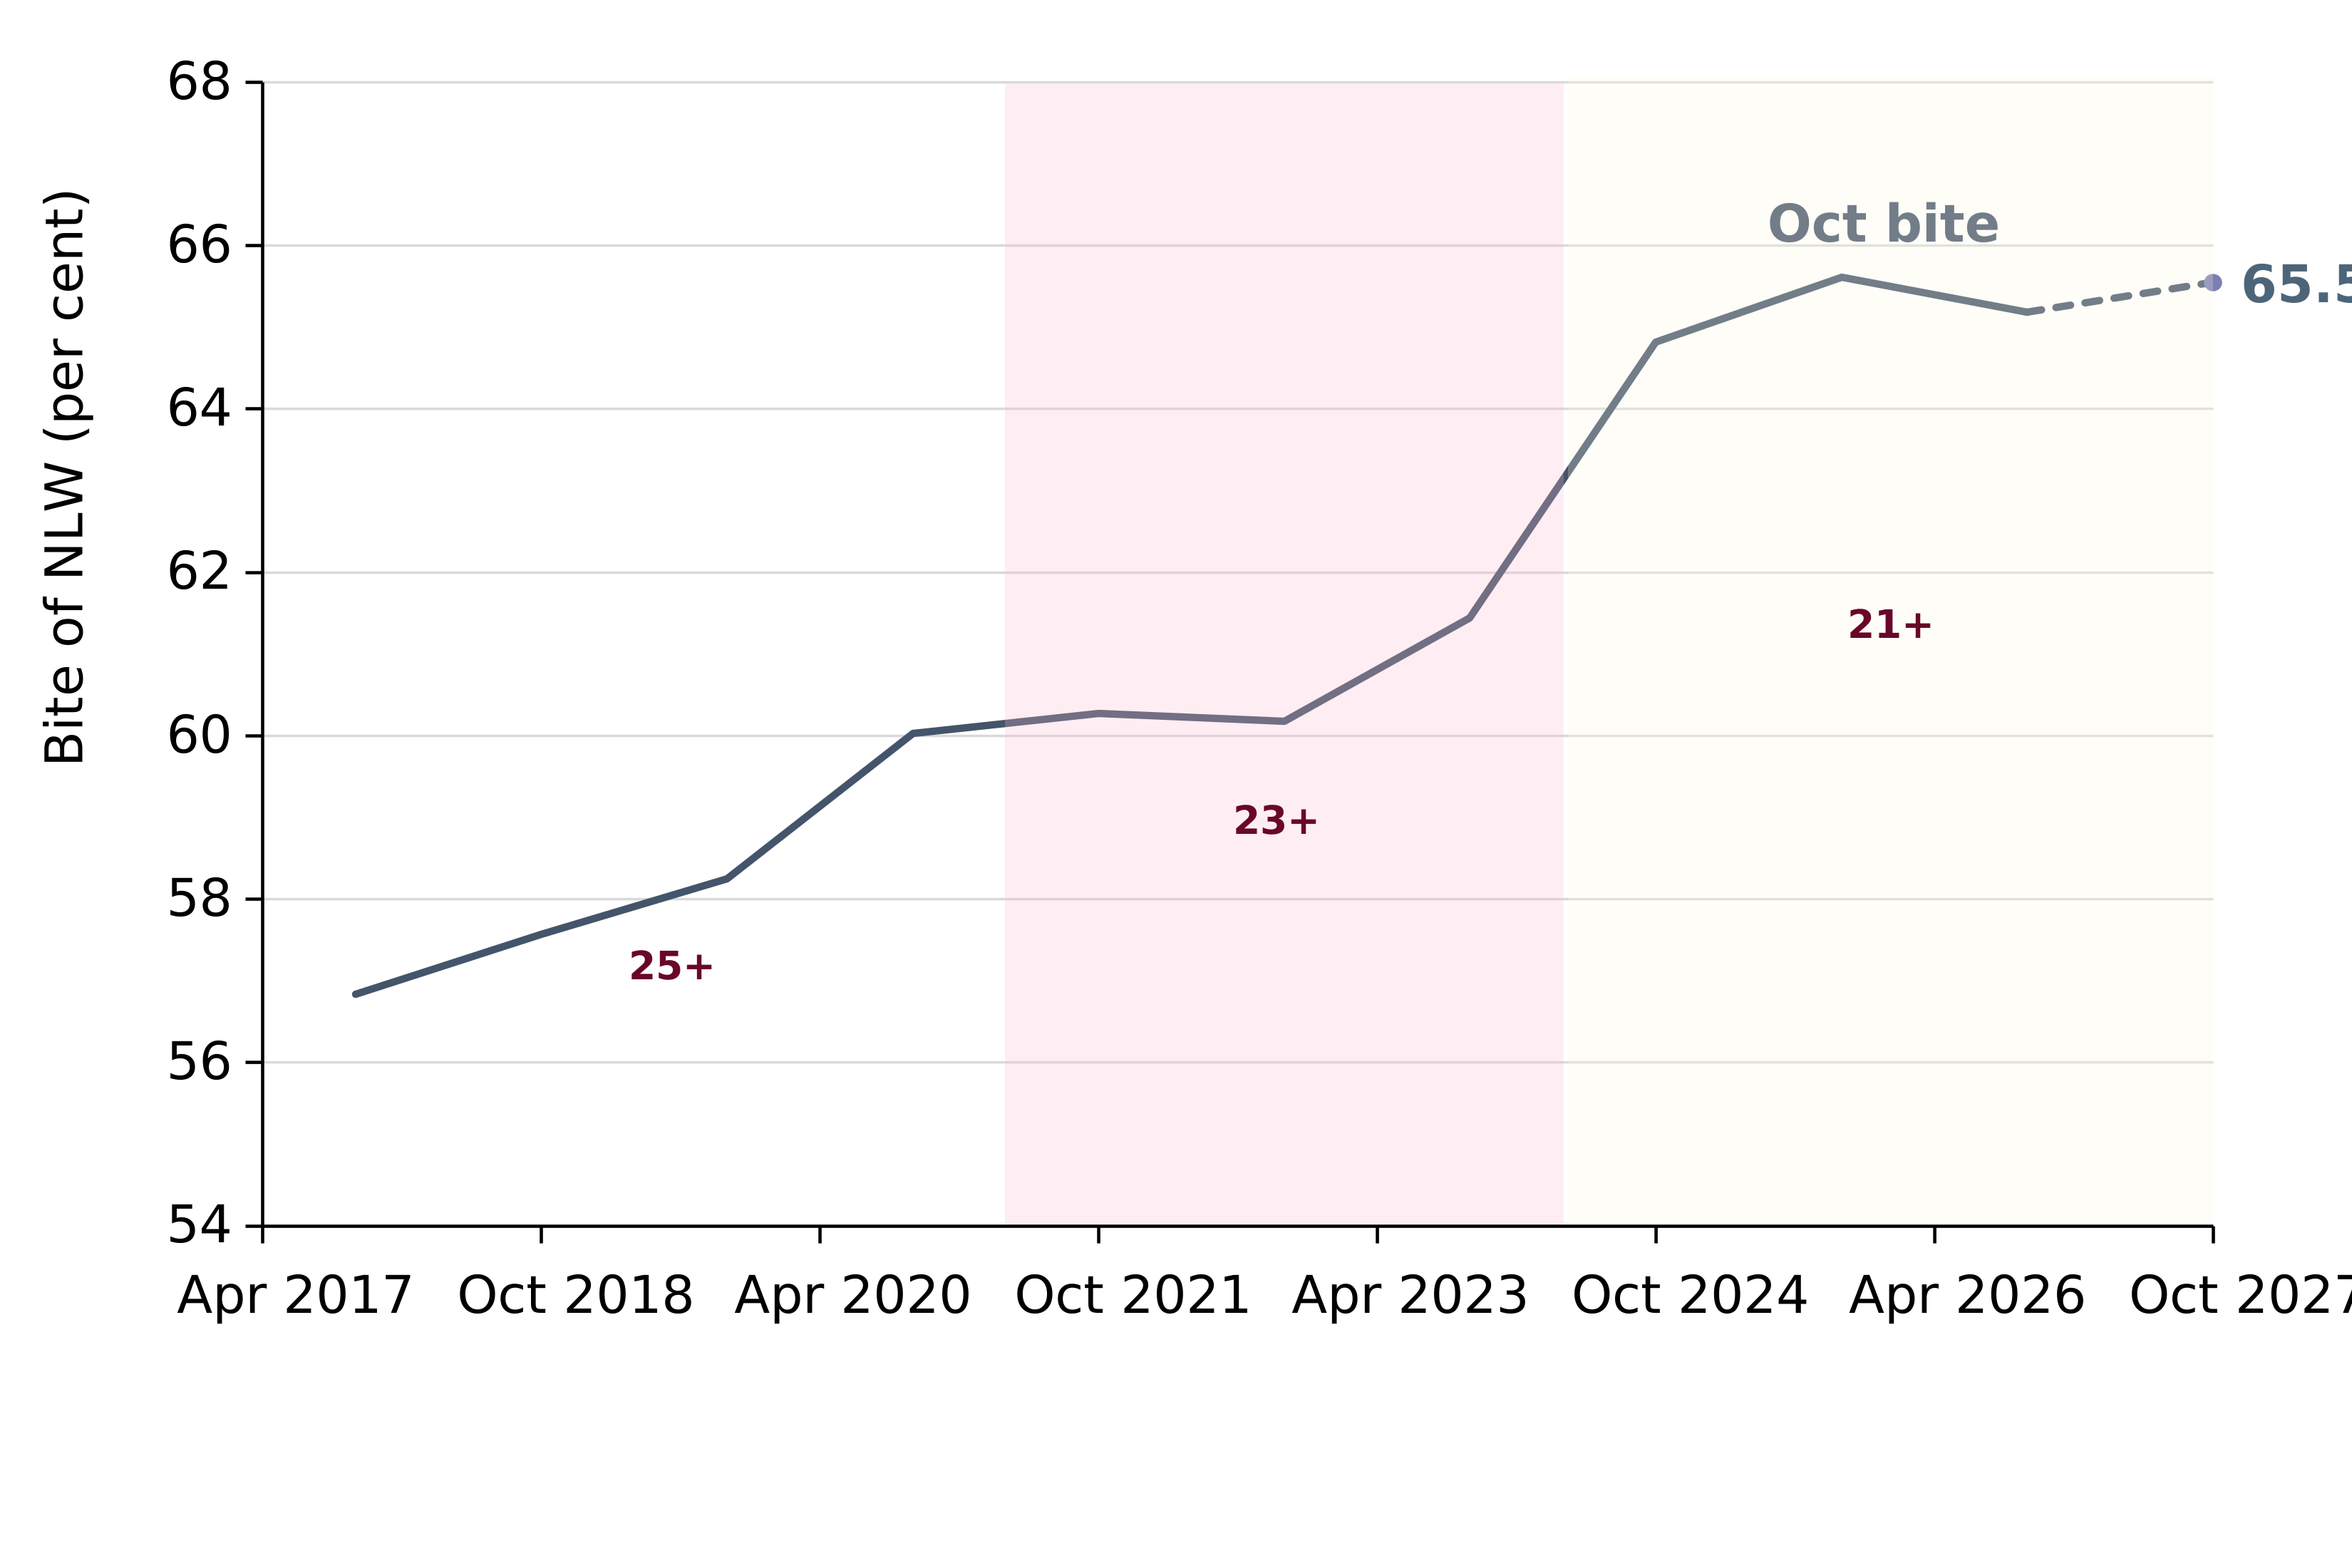
The NLW increase was smaller than the increase in median hourly wages this year. As a result, the bite (the ratio of the NLW to median hourly earnings) of the NLW fell this year.
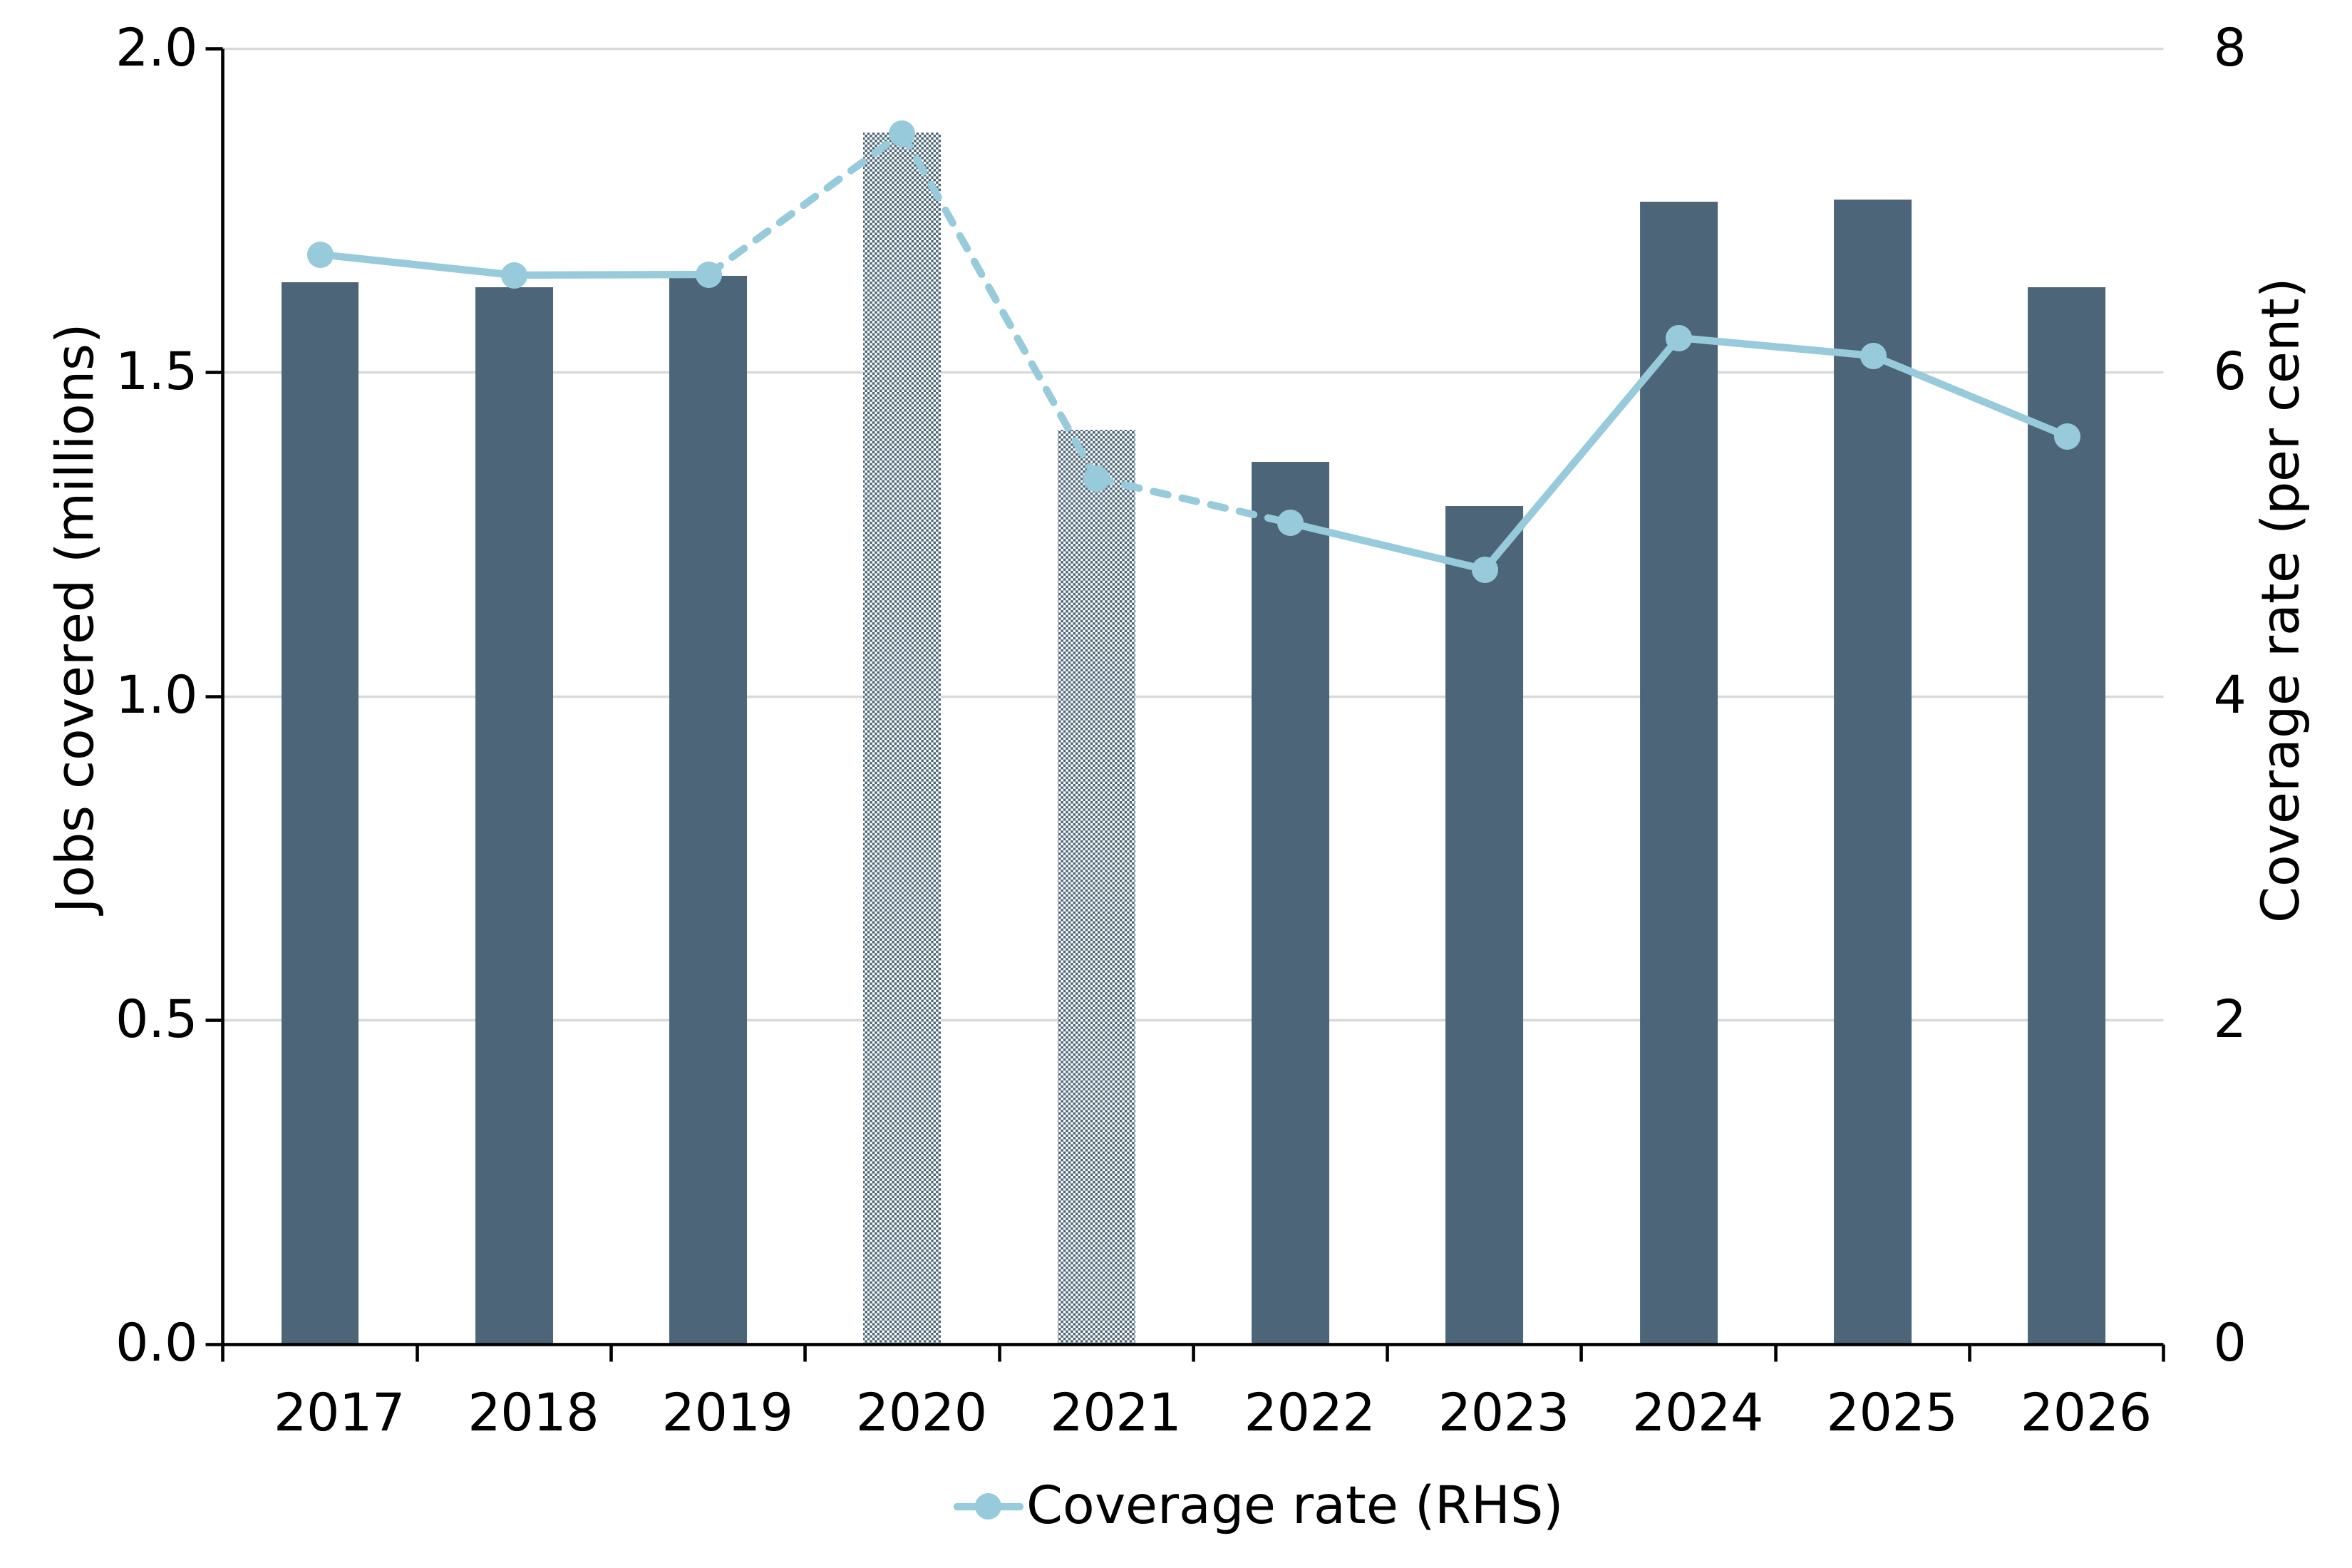
Coverage of the NLW, which is the share of employee jobs paid up to 5 pence above the NLW, also decreased.
However, while economy-wide wage growth was stronger than expected, wage growth in many low-paying industries was slower than last year, consistent with the slowdown in the labour market.
The relatively smaller increase in the NLW means that in aggregate the NLW increase did not seem to generate spillovers to the pay of non-minimum wage workers.
Similarly, this year we observed less wage compression in aggregate than we did last year, including among many low-paying industries.
While these phenomena may be true in aggregate, it is likely that some firms still felt the need to give higher wages to other workers and / or compress their wage structures as a result of the NLW increase.
Although our 3.9 per cent recommendation will not reach the two thirds of median earnings reference point, it still makes progress towards it. Commissioners remain committed to reaching the remit’s key reference point of two thirds of median earnings when economic conditions allow.
8.1 NLW coverage, UK, 2017-2026
8.2 NLW bite, UK, 2017-2027
9. We have not seen robust evidence that NLW increases have hurt employment
This year, the strength in wage growth across the economy makes it difficult to isolate the impact of the minimum wage.
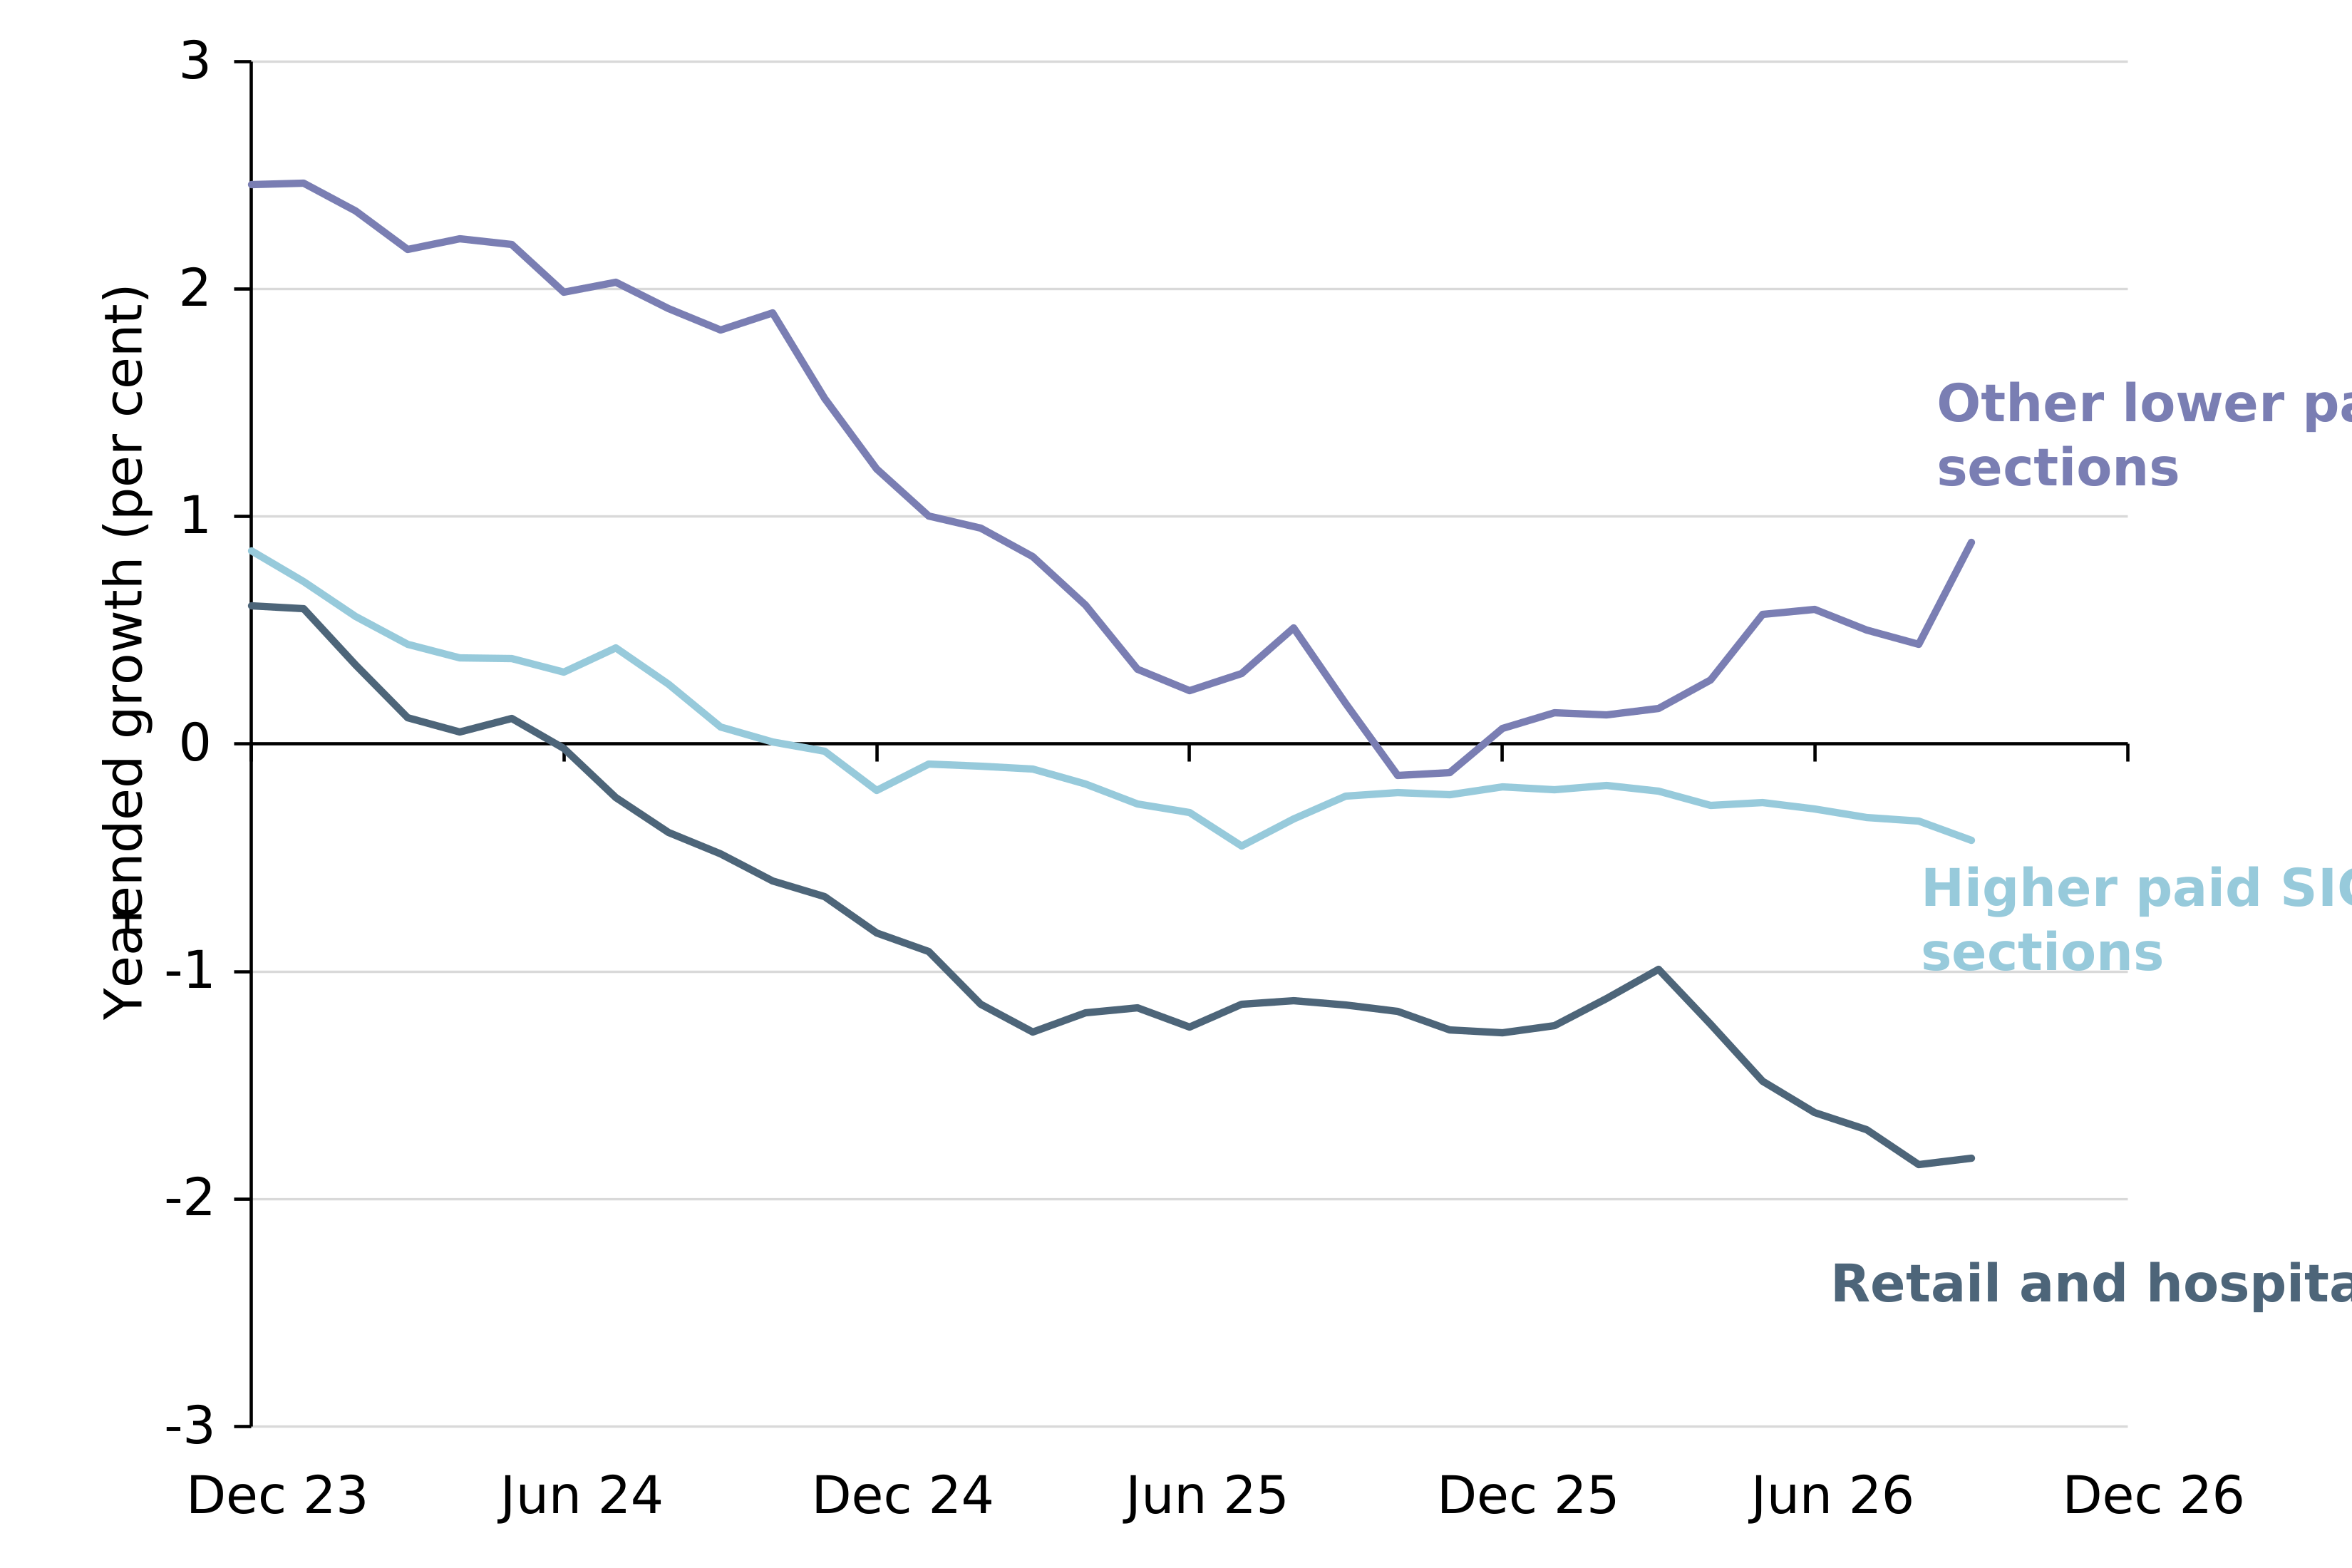
While it is clear that some low-paying industries are struggling, we have not found robust evidence to suggest that the NLW has added to these struggles. When looking across low-paying industries we see divergent trends in labour market outcomes. RTI employment in lower paid industries outside of hospitality and retail has increased a little over the past year. In comparison employment in the highest paid industries has fallen slightly.
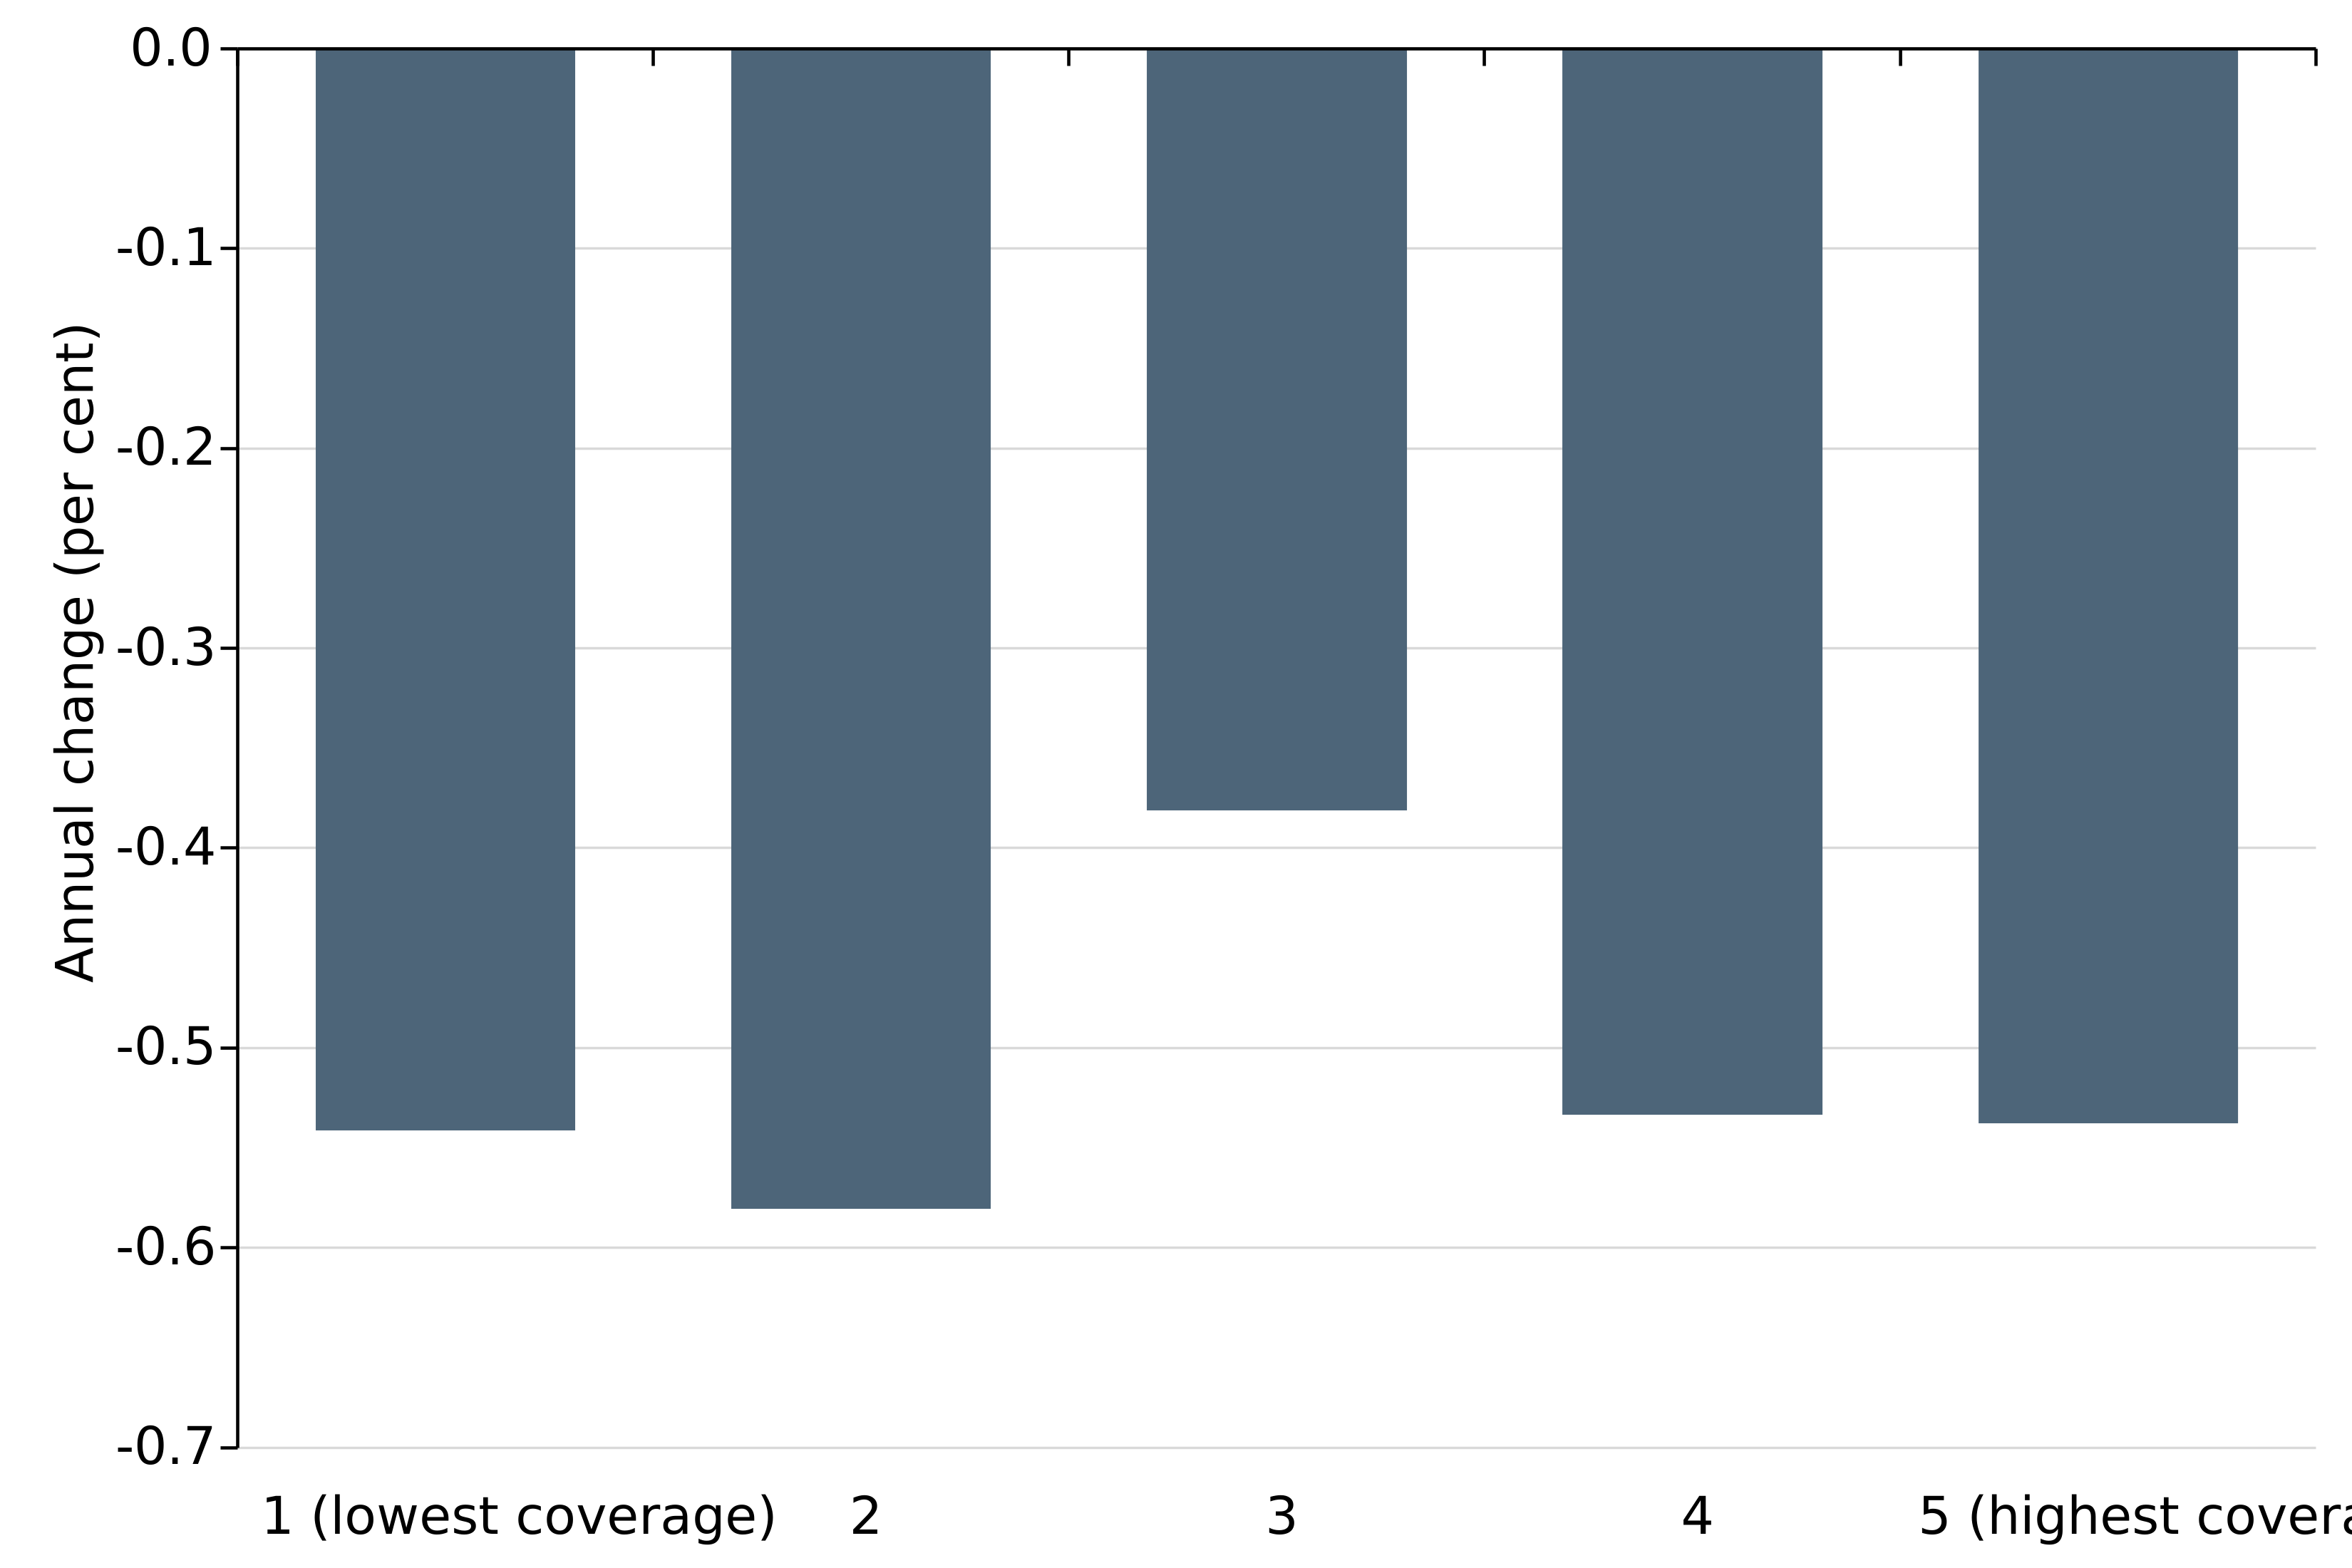
Similarly, although employment across the UK has fallen overall, places with high minimum wage use have not suffered by more than other places.
Also, our research using the Bank of England’s Decision Maker Panel does not find robust evidence of an employment impact.
9.1 Change in RTI employment growth by SIC section industry, UK, 2023-2026
9.2 Change in RTI employment by coverage quintile, GB, August 2025 – August 2026
10. Workers are struggling despite above-inflation NLW increases
Deciding what to recommend this year has been a huge challenge for the Commission, with very good arguments on both sides. Many workers are struggling and many businesses are feeling pressured.
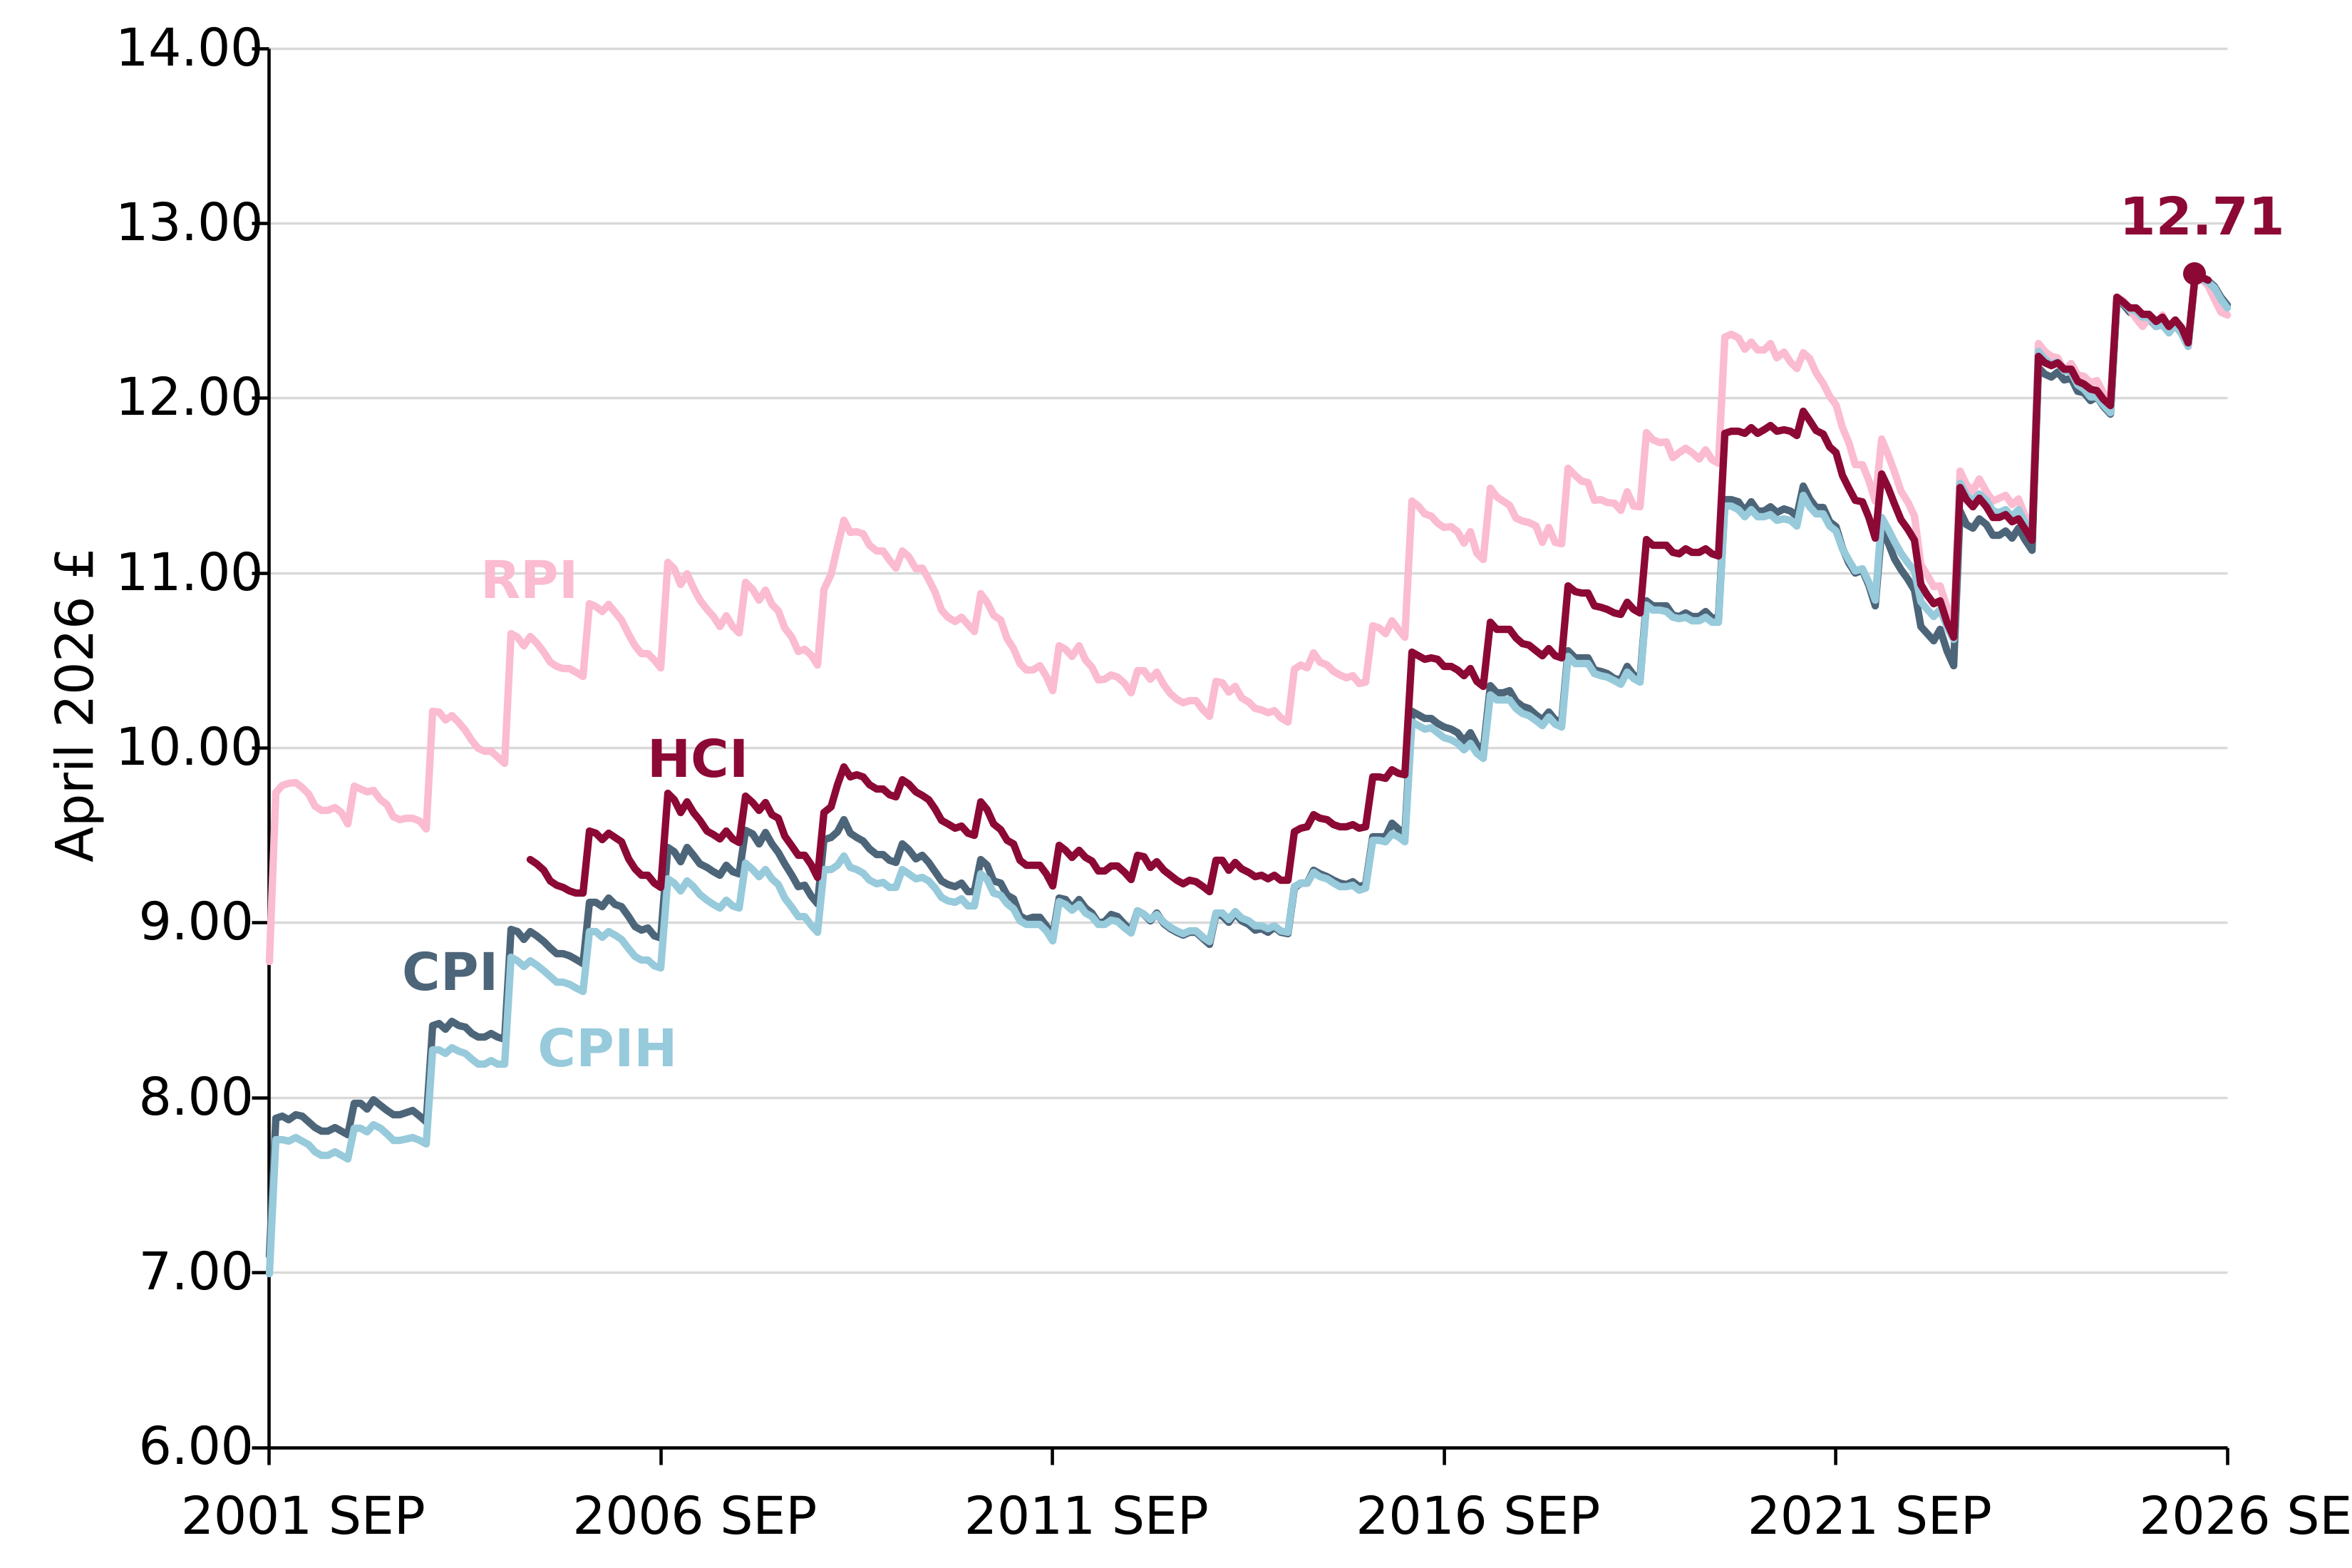
The NLW has seen substantial real-terms increases in recent years. Nevertheless, it was clear that some workers are struggling substantially, and many households have yet to fully recover from the previous inflation shock. The TUC found workers are “skipping meals, cutting back on essentials, going into debt, and avoiding putting on their heating”. Usdaw’s poll of its members found 41% had struggled to pay everyday bills and had resorted to borrowing, 34% had missed loan repayments or were falling behind, while only 4% said they were comfortably managing repayments.
10.1 Real value of the NLW, April 2026 prices
11. Alongside hourly wages, hours of work and employment opportunities are key for living standards
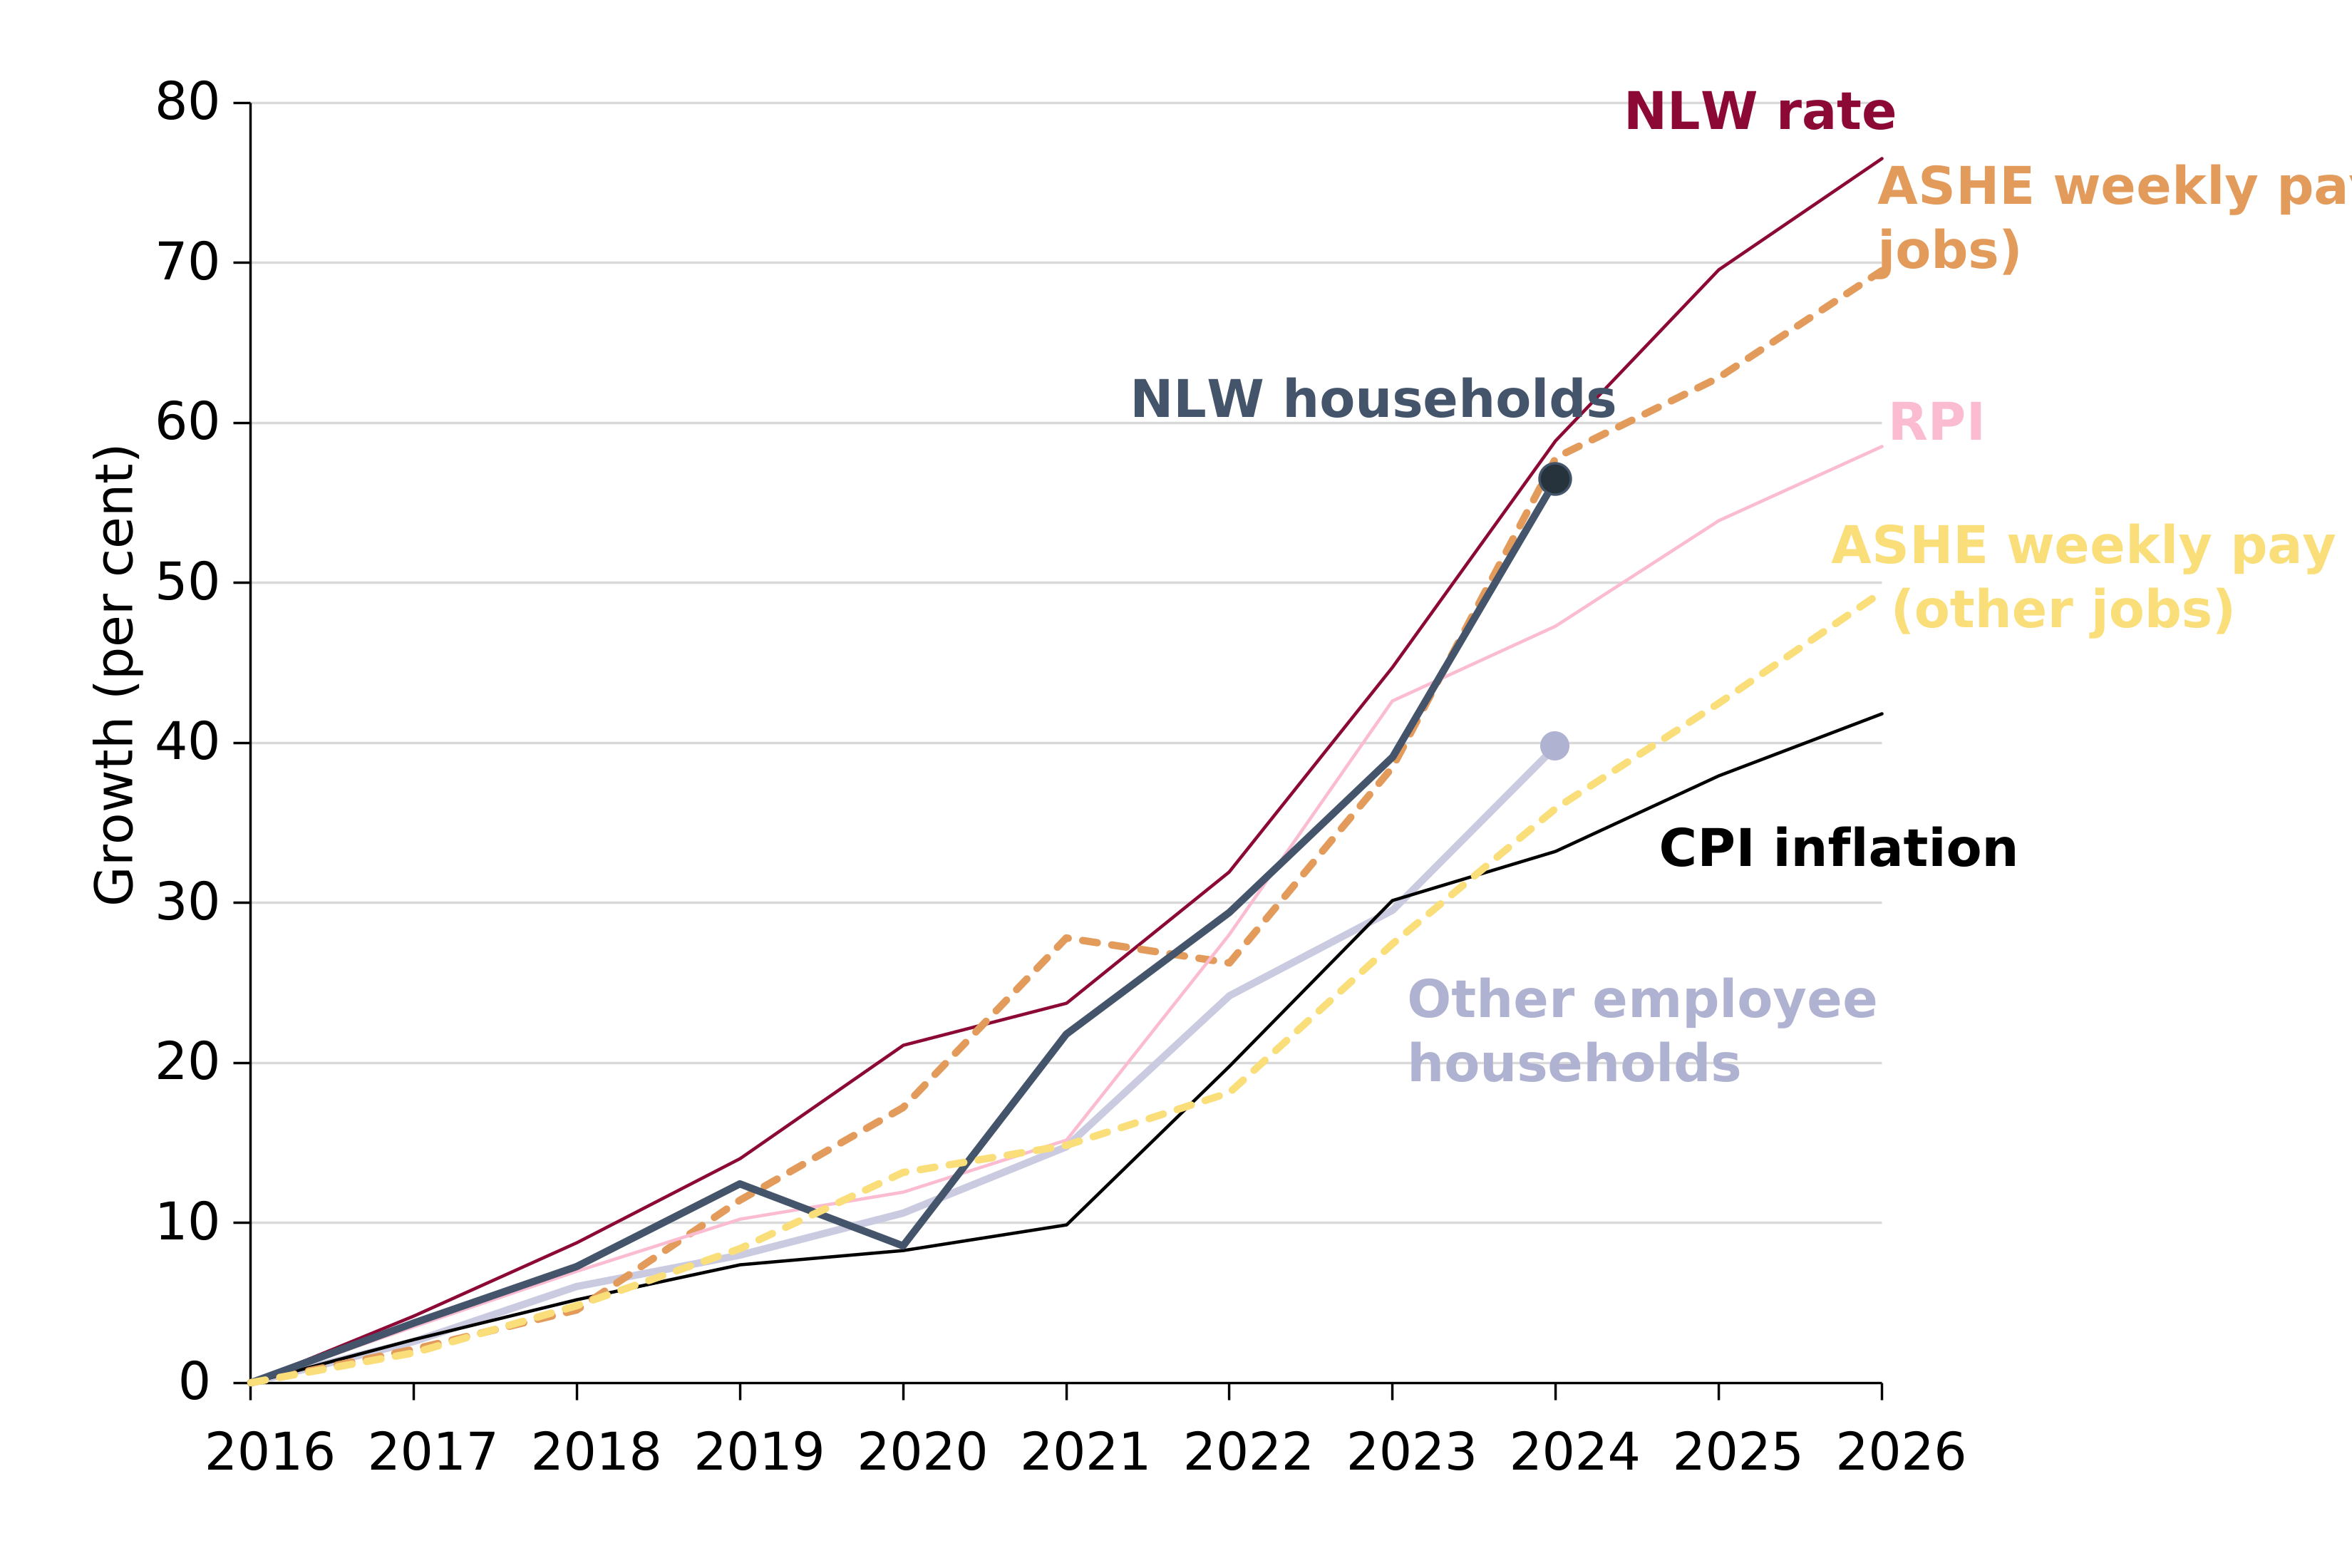
The real increases in the NLW have fed through into the weekly pay of NLW jobs and, in turn, the income of households with NLW workers. The first chart shows that household income has risen faster in households with an NLW worker. It also shows that weekly pay among NLW workers has risen faster than weekly pay in other jobs. Both have risen faster than measures of inflation.
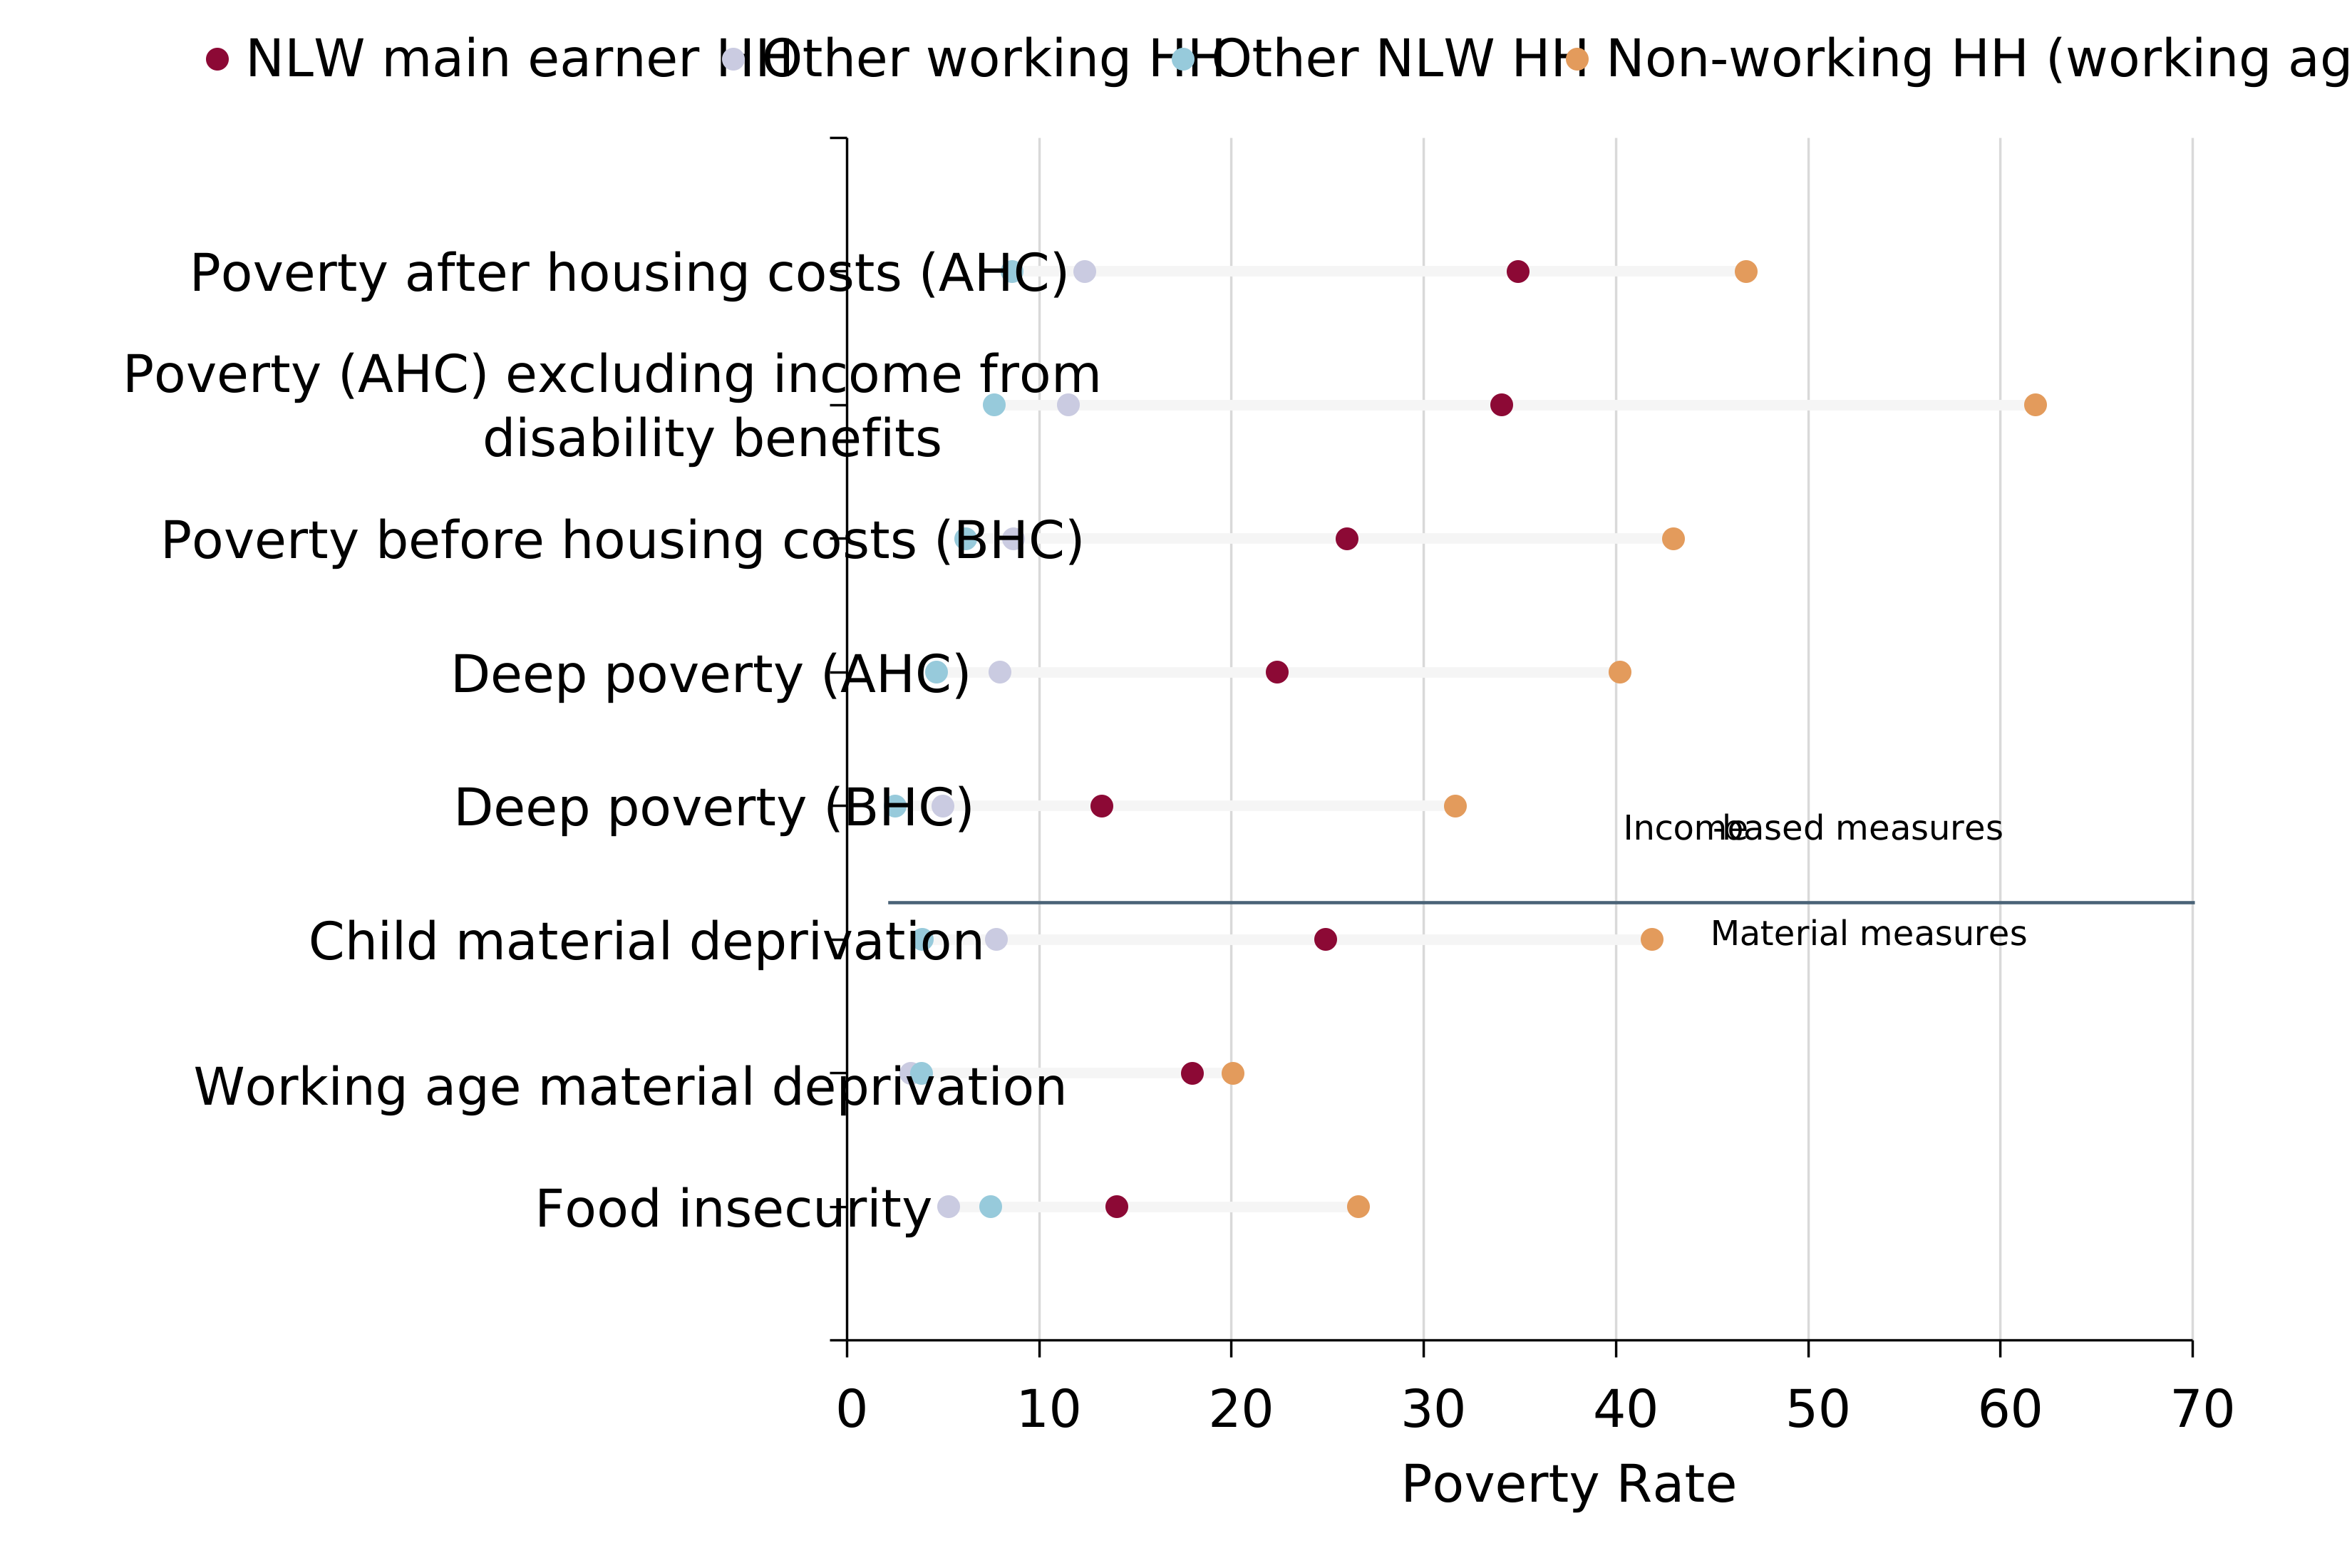
Despite this, the second chart shows that households where the NLW worker is the main earner have higher poverty rates. This illustrates that hourly pay is not the sole determinant of household circumstances. Hours of work also matter. However, workers continue to tell us that the availability and volatility of hours exacerbates financial struggles, along with transport and childcare costs.
The number of job opportunities is also important for living standards. Strong employment growth to 2024 meant more workers per household, contributing to higher household incomes and falls in poverty for NLW workers.
11.1 Cumulative growth in median equivalised household income, 2016/17 - 2024/25
11.2 Living standards measures by household type, 2024-25
12. Employers are concerned about the cumulative increases in costs, particularly National Insurance Contributions
Employers are concerned about economic and business conditions, particularly what they describe as the cumulative burden of costs. For example, the FSB say:
“It is becoming a major structural issue within small firms where the costs of employment, including the NLW, employer national insurance contributions, and auto-enrolment, makes it harder for a small business owner to make sufficient profit to pay themselves a living wage”
UK Hospitality said:
“Hospitality employers have absorbed substantial increases in statutory wage rates alongside major changes to employer National Insurance contributions and a succession of other regulatory and employment costs. At the same time, the labour market has weakened, unemployment has risen and the employment prospects of younger people have deteriorated..”
And the BCC noted:
“The evidence is clear that the cumulative impact of recent rises in the National Living Wage (NLW), along with other employment cost rises such as employer NI contributions, is a significant cost pressure on businesses.”
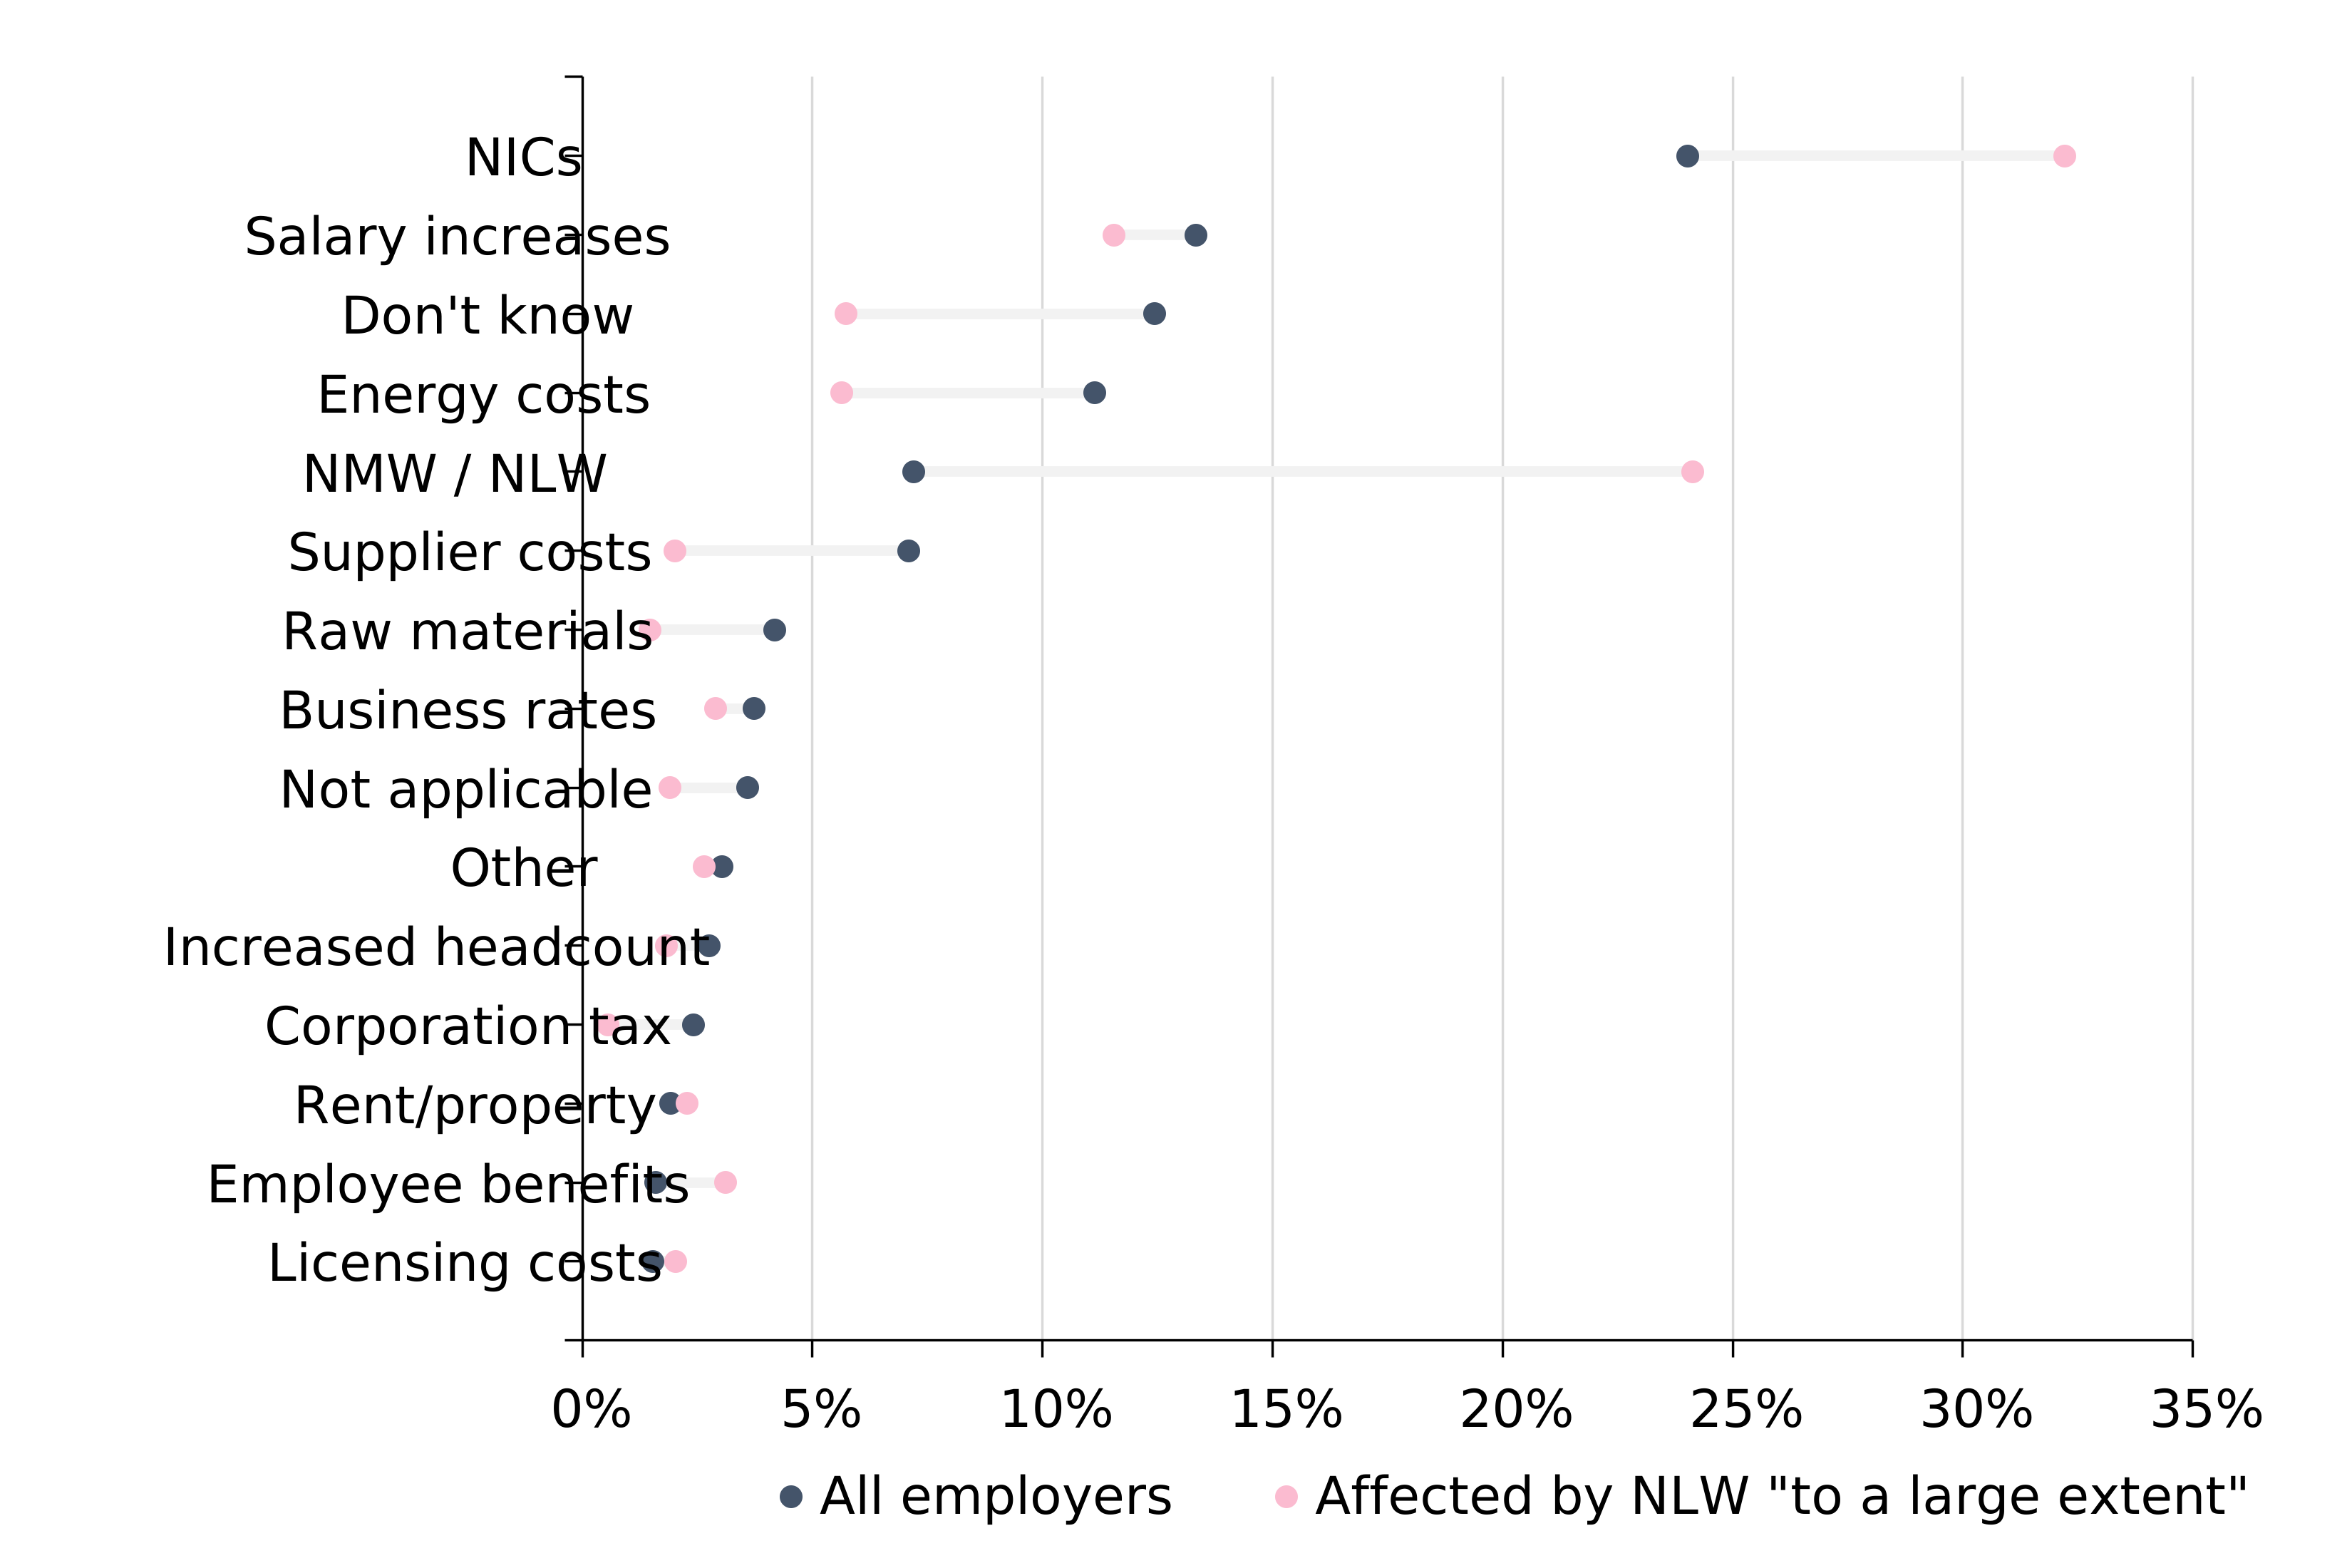
The CIPD’s survey of 2,017 employers found that the recent rise in employer National Insurance bills is still cited as the cost with the biggest impact by more employers than any other cost. This is even true among just those employers who say the NLW has a “significant” impact on their wage bill.
12.1 CIPD Survey “Which cost, if any, had the biggest impact on your costs in the last 12 months?” (n=2,017)
13. Employer stakeholder positions have hardened this year
For the first time, several employer representative bodies called for below-inflation rate increases, not because they believe that’s the right level for their workers, but because many employers are on the edge.
British Chambers of Commerce
“The NLW should rise no faster than CPI inflation to avoid additional strain on employers and the labour market….using the BCC’s recent forecast data for CPI inflation of 2.3% in 2027, the NLW should increase from its current rate of £12.71 to approximately £13.00.”
UK Hospitality
“The April 2027 increases in the NLW and NMW should be lower than inflation….A period of restraint is necessary to rebuild employers’ capacity to invest, create jobs and increase working hours, with particular benefits for younger people seeking to enter the labour market.”
CBI
“Setting next year’s NLW and NMW increases below inflation to encourage investment and improve the employment prospects of young people.”
FSB
“Given … the large concerns around the cumulative impact of increased labour and business costs, we would suggest an increase of the NLW by no more than three per cent to £13.09 would be a sensible increase.”
14. Worker representatives continued to advocate for ambitious increases to protect living standards
Worker representatives told us how much low paid workers rely on the rates, how they were still struggling with living costs and therefore that they needed further ambitious increases.
Usdaw
“We share concerns raised by the TUC that freezing the bite at 66% of median hourly earnings for another year would risk the minimum wage falling behind inflation … and therefore urge the LPC to consider setting it at a rate that moves beyond a 66% bite”
TUC
“A 67⅓ per cent bite would deliver a minimum wage of £13.45 and keep rates on course for £15 within this parliament … the government has explicitly asked the LPC to consider the cost of living and this must be taken seriously”
Unison
“the commission should go further and recommend the transition to a minimum wage set at 75% of average earnings…this would likely entail an increase of approximately 5.8% in 2027”
GMB
“The National Living Wage rate for April 2027 will need to be at least £13.72 an hour to keep up with current forecasts for inflation.”
15. Higher than expected wage growth has implications for the NLW’s key reference point
The Low Pay Commission’s remit asks us to use two thirds of median hourly earnings as “the key reference point” for increases in the NLW.
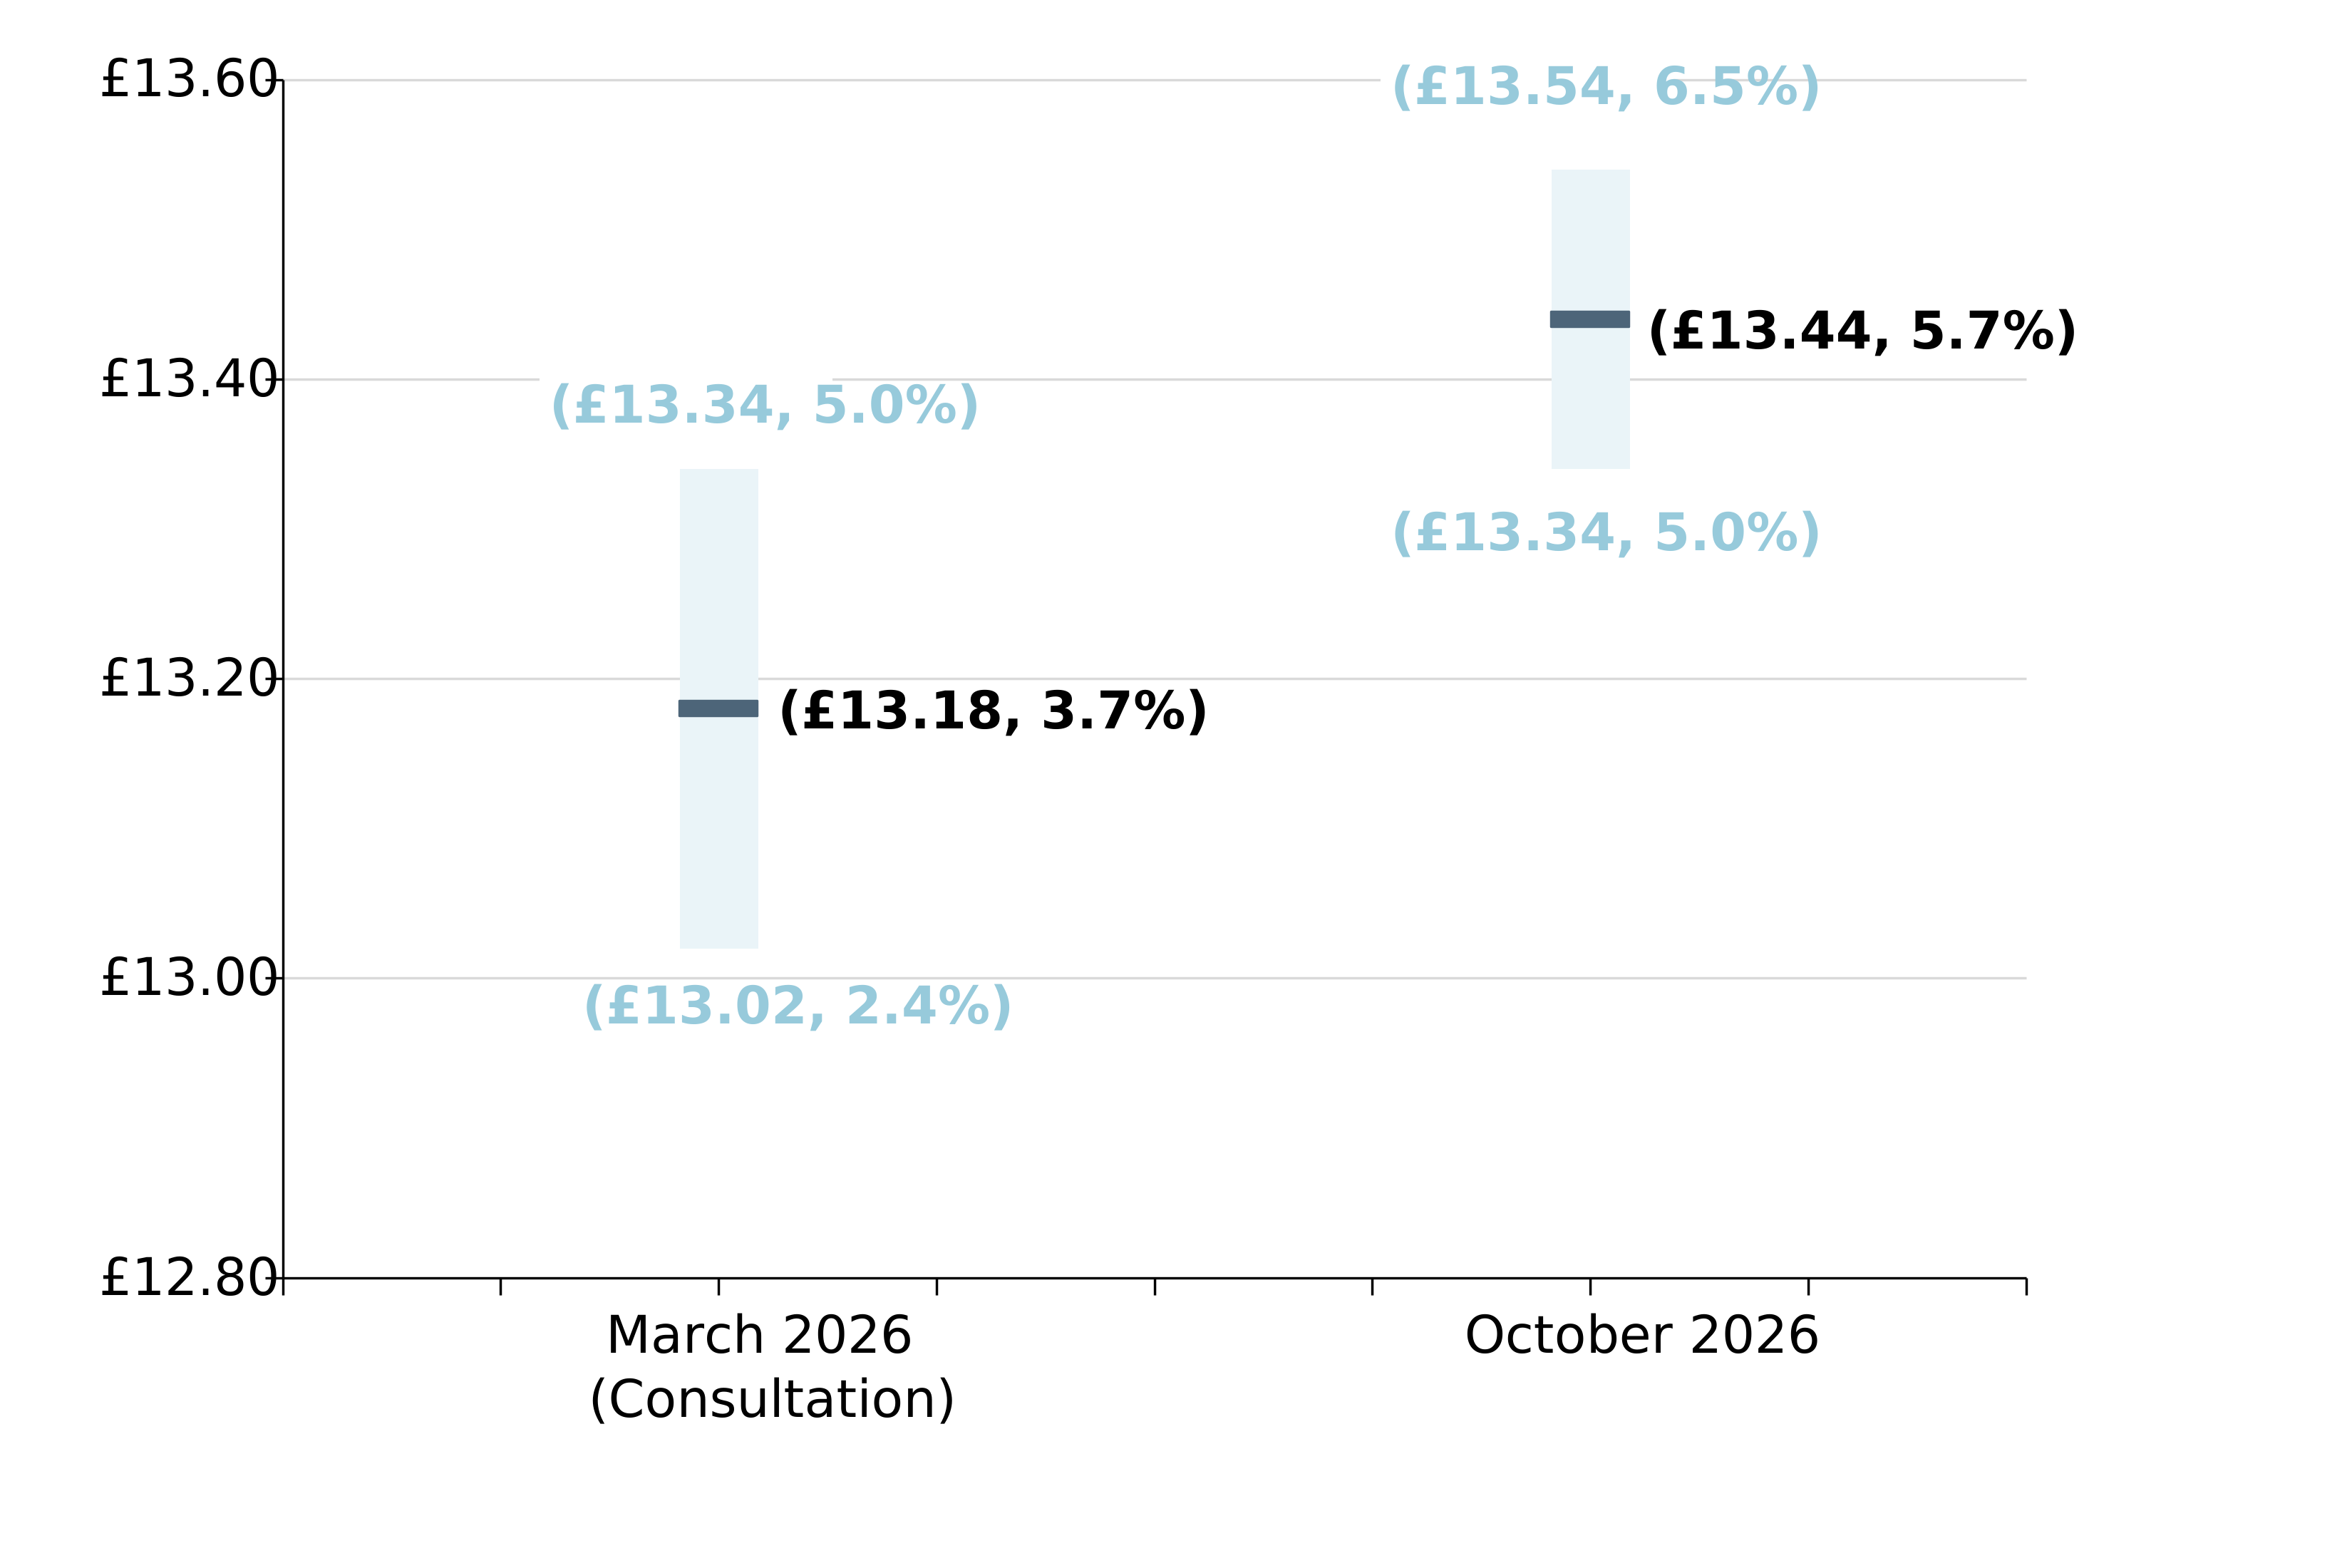
In the spring we estimated a rate of £13.18 (3.7%), within a range of £13.02 to £13.34 (2.4% to 5%), would reach the key reference point.
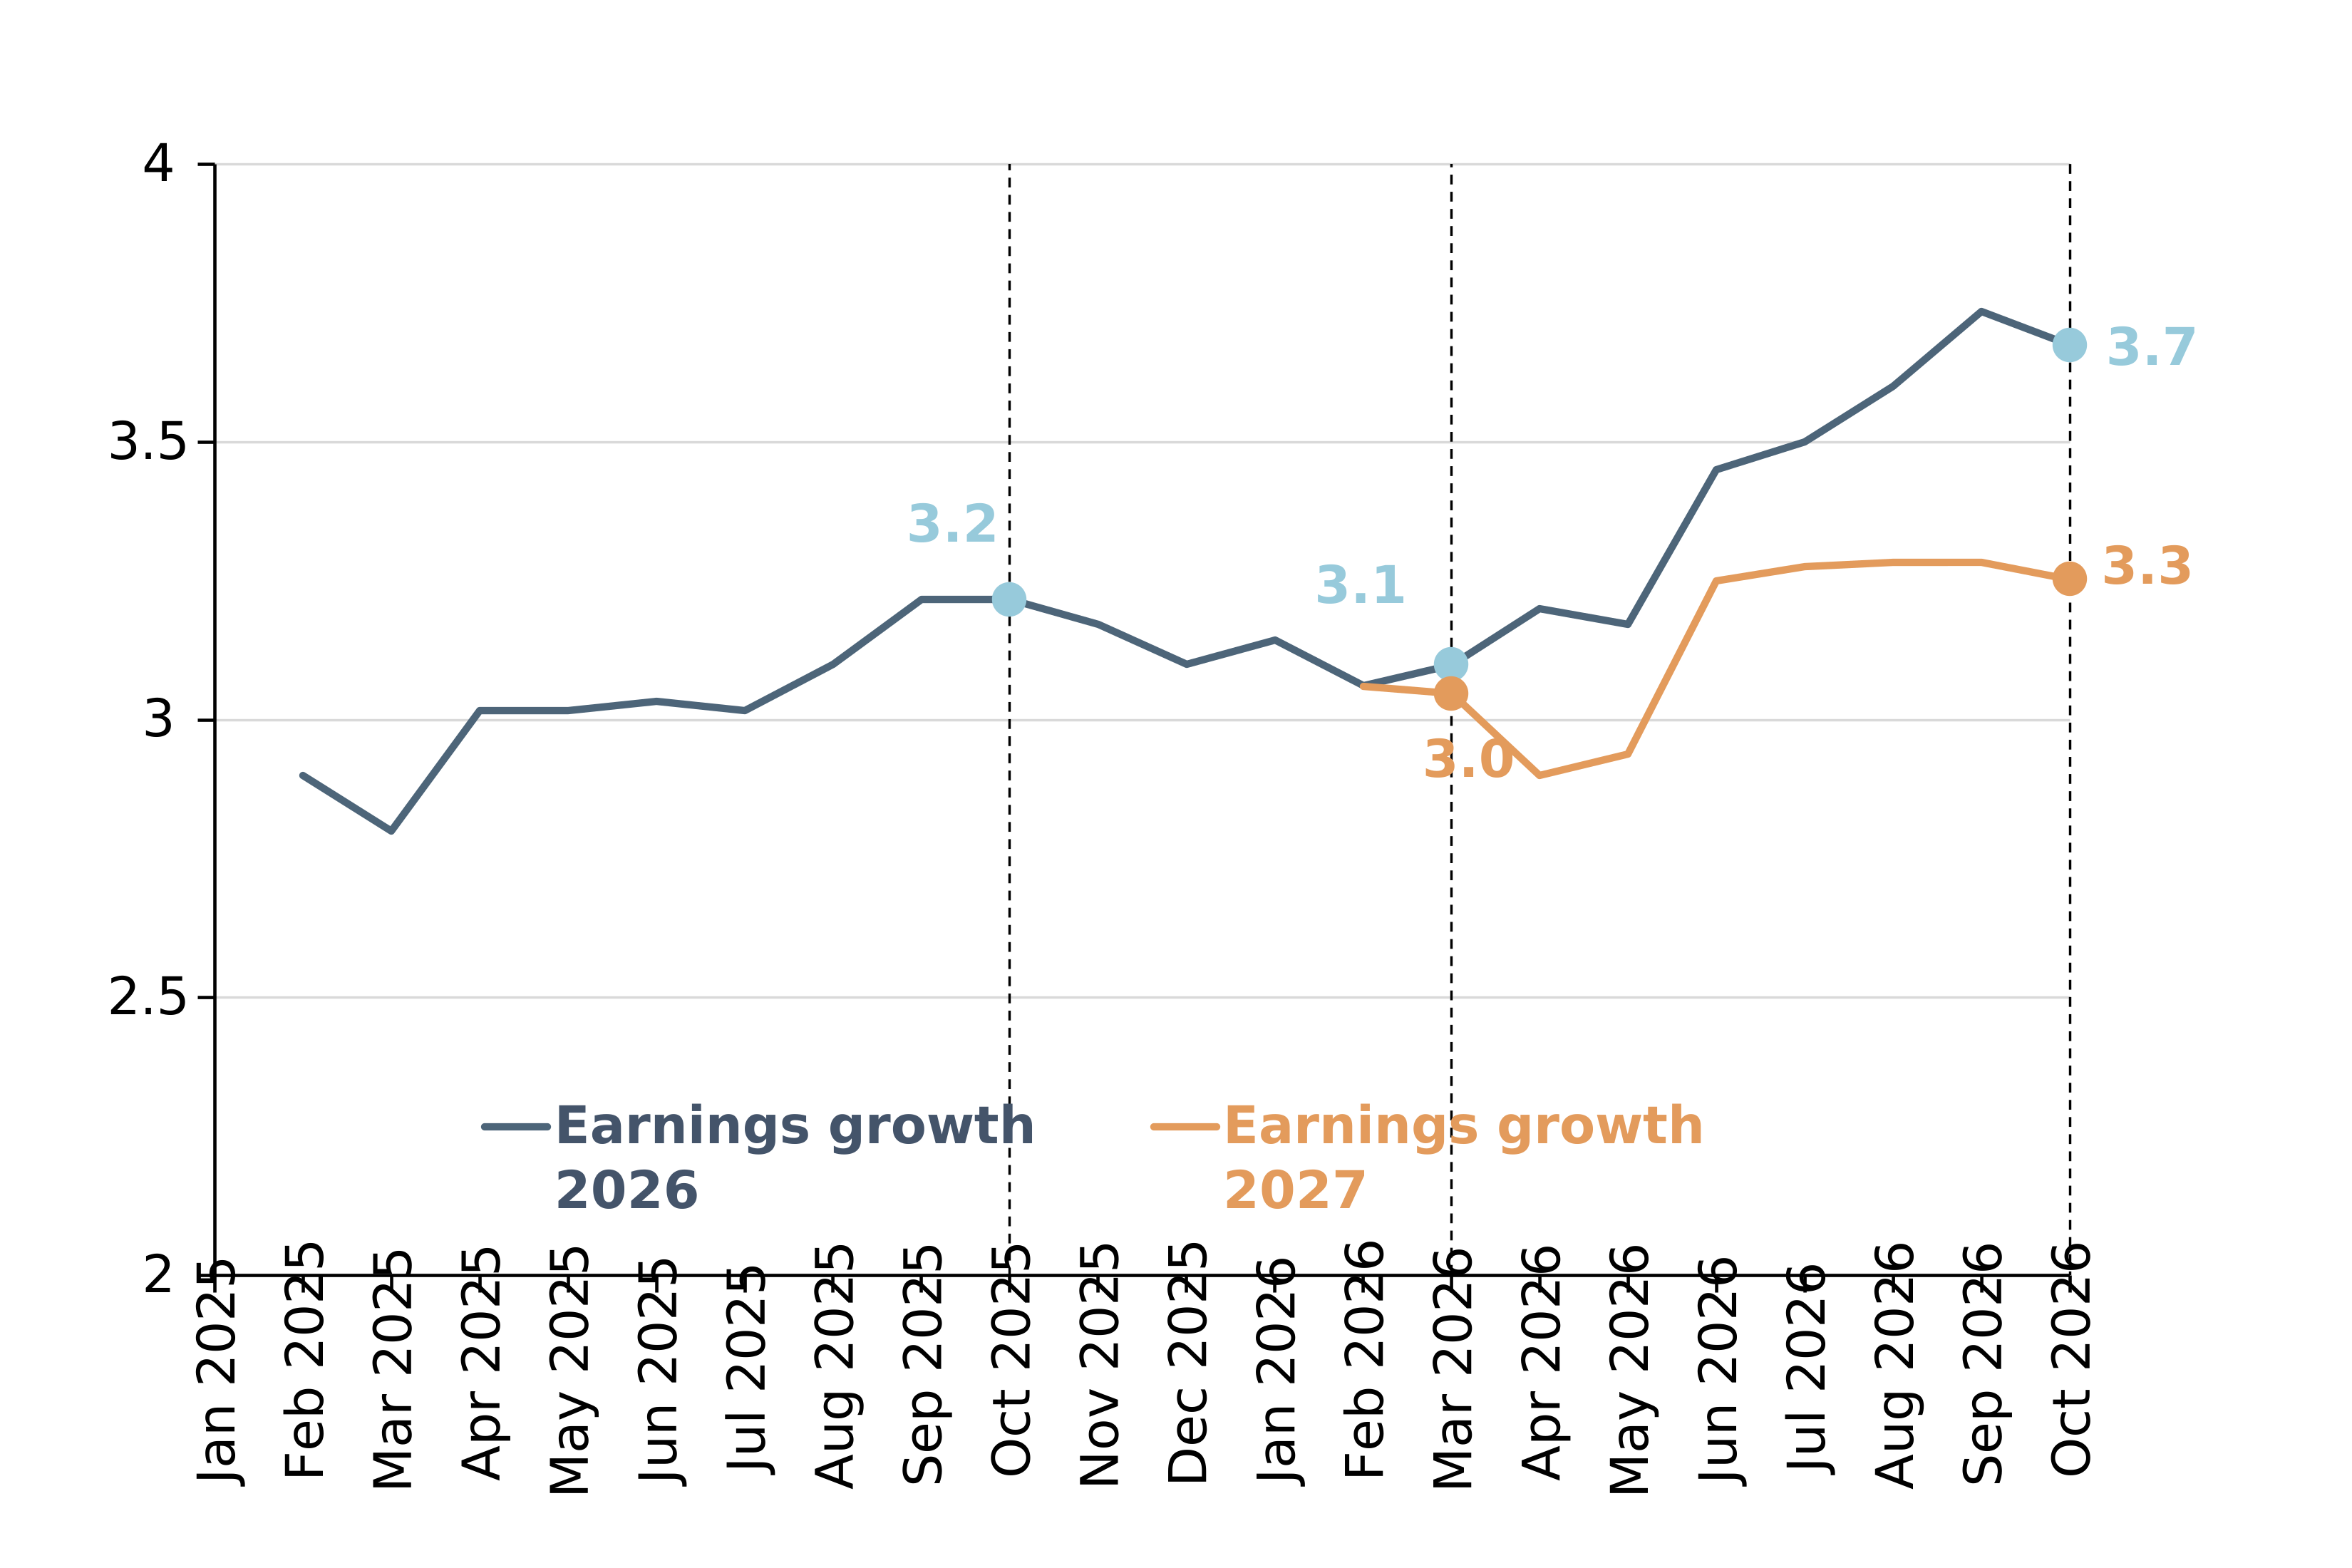
This estimate was based on wage growth and forecasts available to us in the spring. This means that the accuracy of forecasts and any changes in them or wage growth affect the estimate. Page 10 has already shown that wage growth has come in ahead of forecasts. Chart 15.2 on this page shows that, since the spring, forecasters have also raised their expectations for wage growth in both 2026 and 2027. Between March and October forecasters’ expectations for wage growth in 2026 rose from 3.1 to 3.7 per cent while 2027 forecasts increased from 3.0 to 3.3 per cent.
This combination of higher-than-expected wage growth and a change in forecaster expectations changed our estimate of the NLW key reference point rate.
Our estimate of the rate needed to reach the two thirds reference point is now £13.44 (5.7%).
15.1 Estimates of NLW reference point in March and October 2026
15.2 HMT panel forecast for wage growth in 2026 and 2027
16. The NLW recommended rate is above the range of inflation forecasts from April 2027 to March 2028
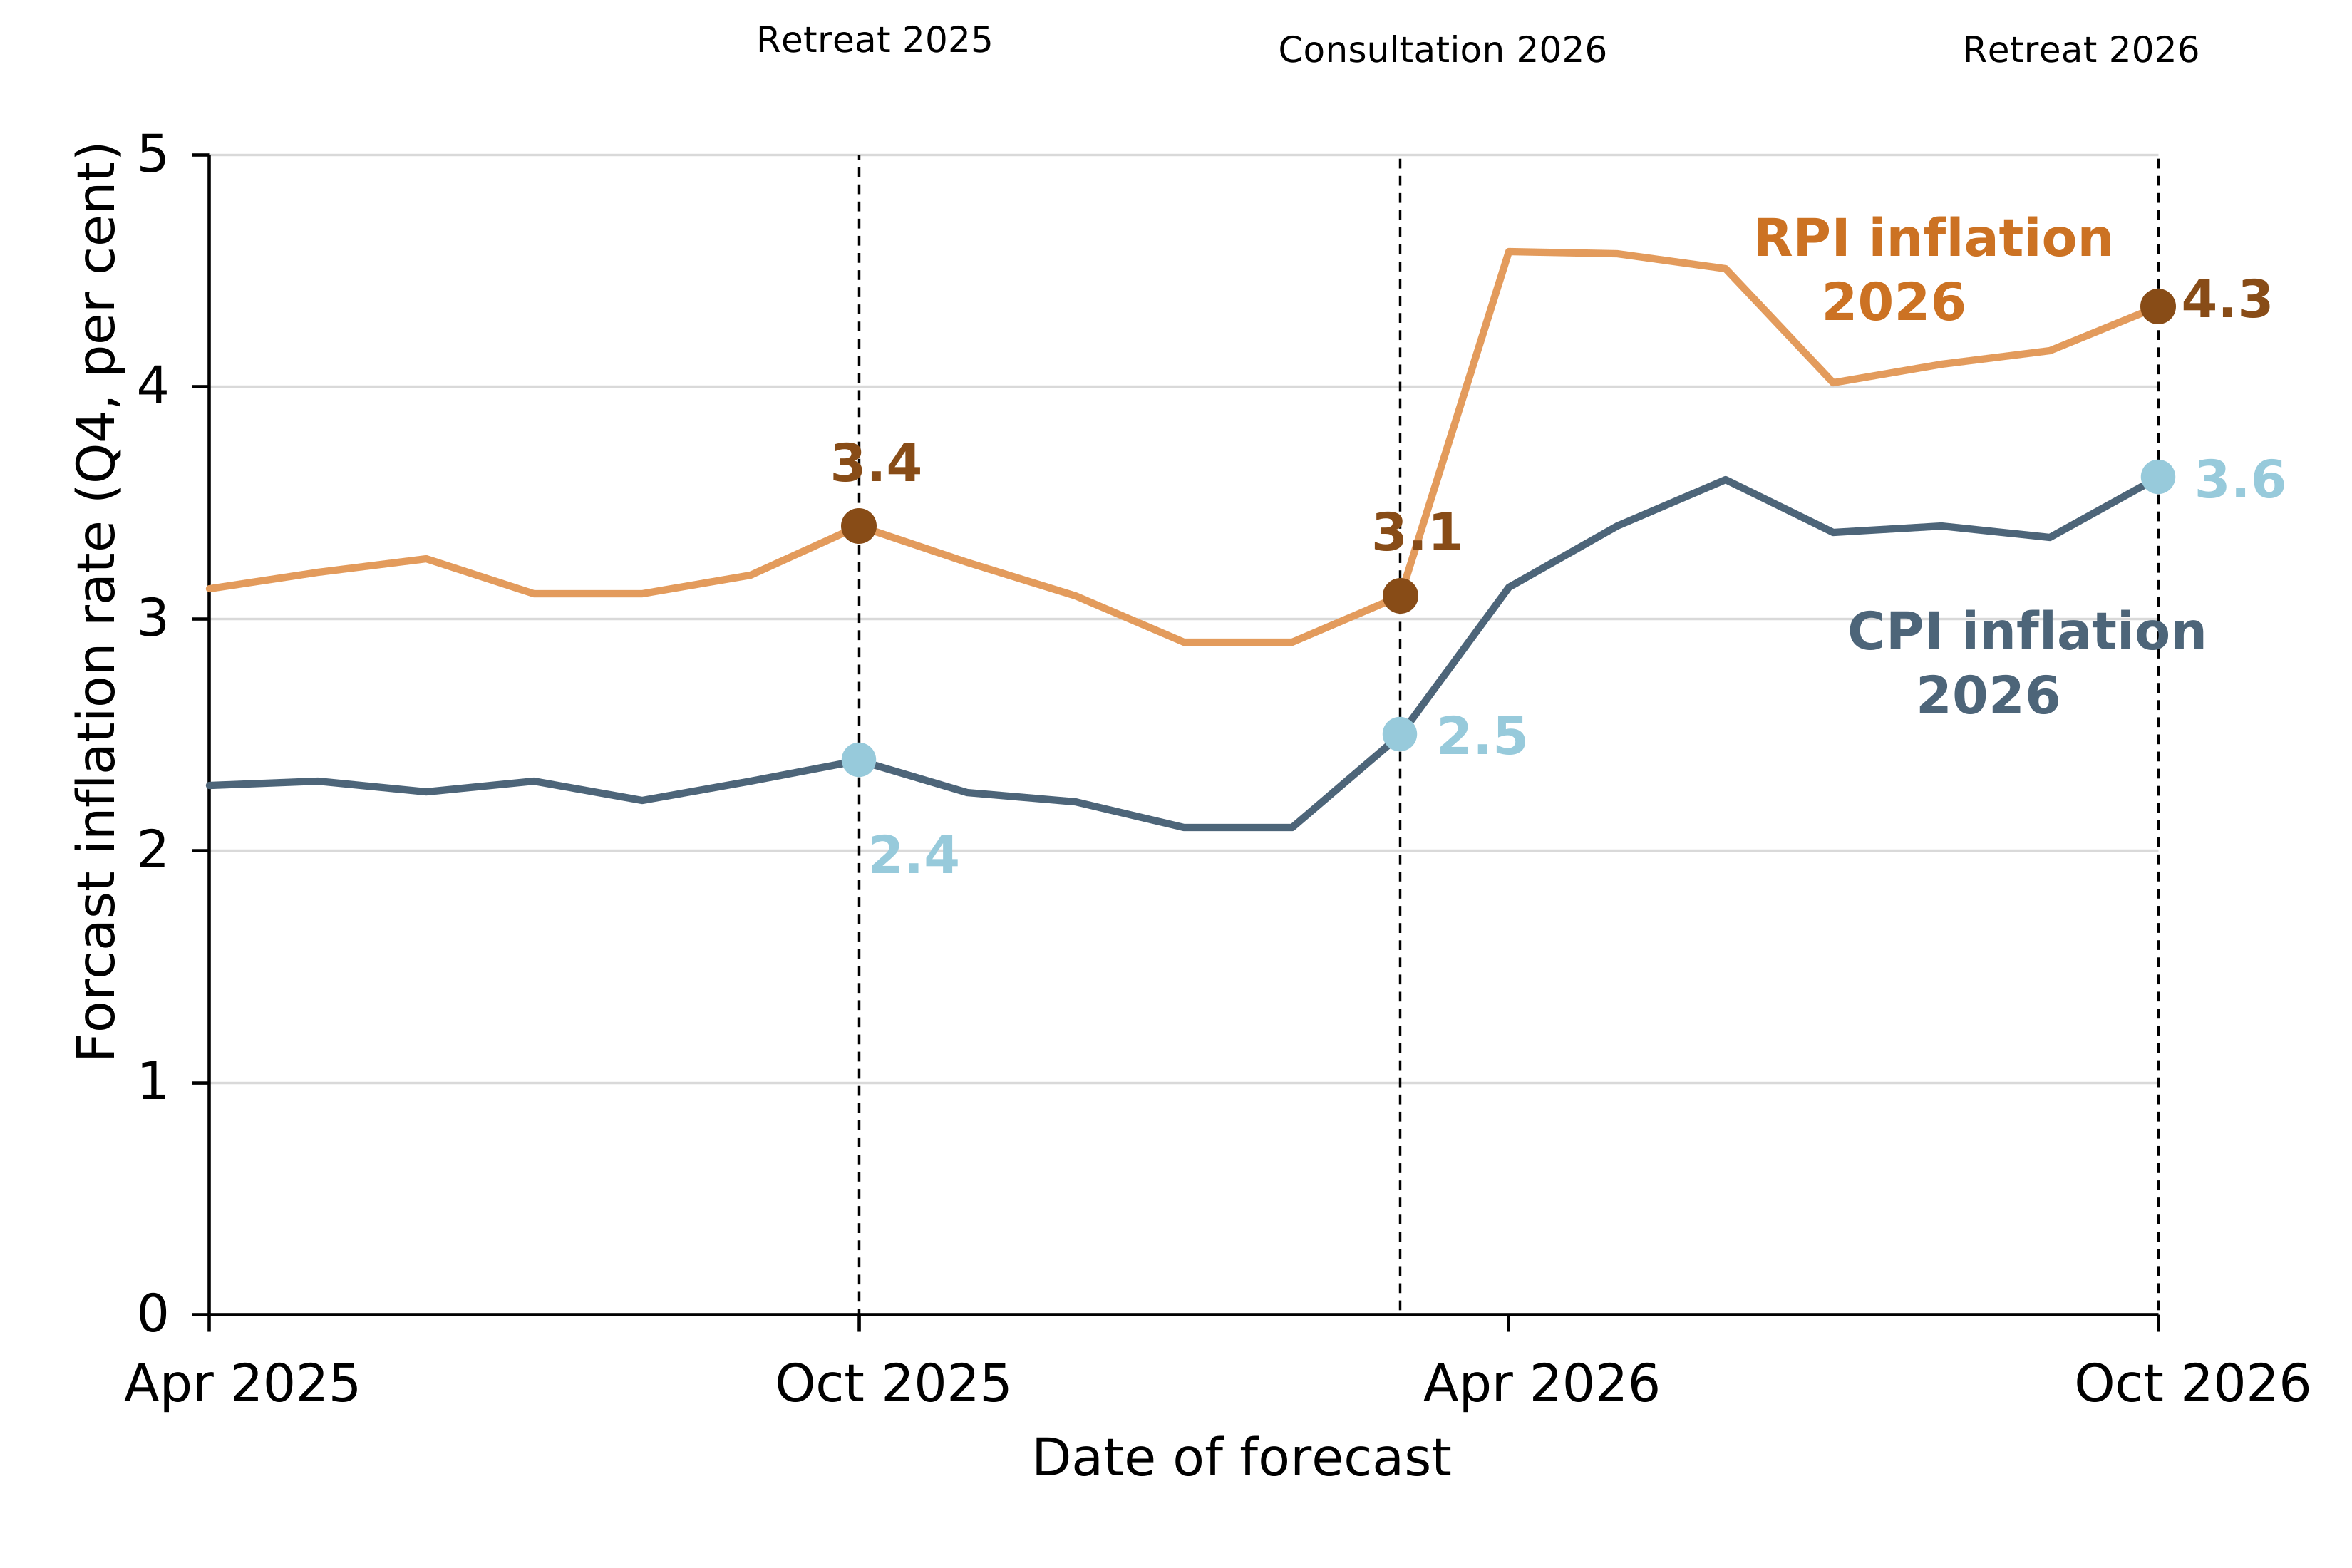
Over the past year, inflation forecasts for 2026 and 2027 have been revised upwards in response to shocks to energy prices. Worker representatives urged us to continue with ambitious increases, noting the struggle of many low-paid workers to make ends meet.
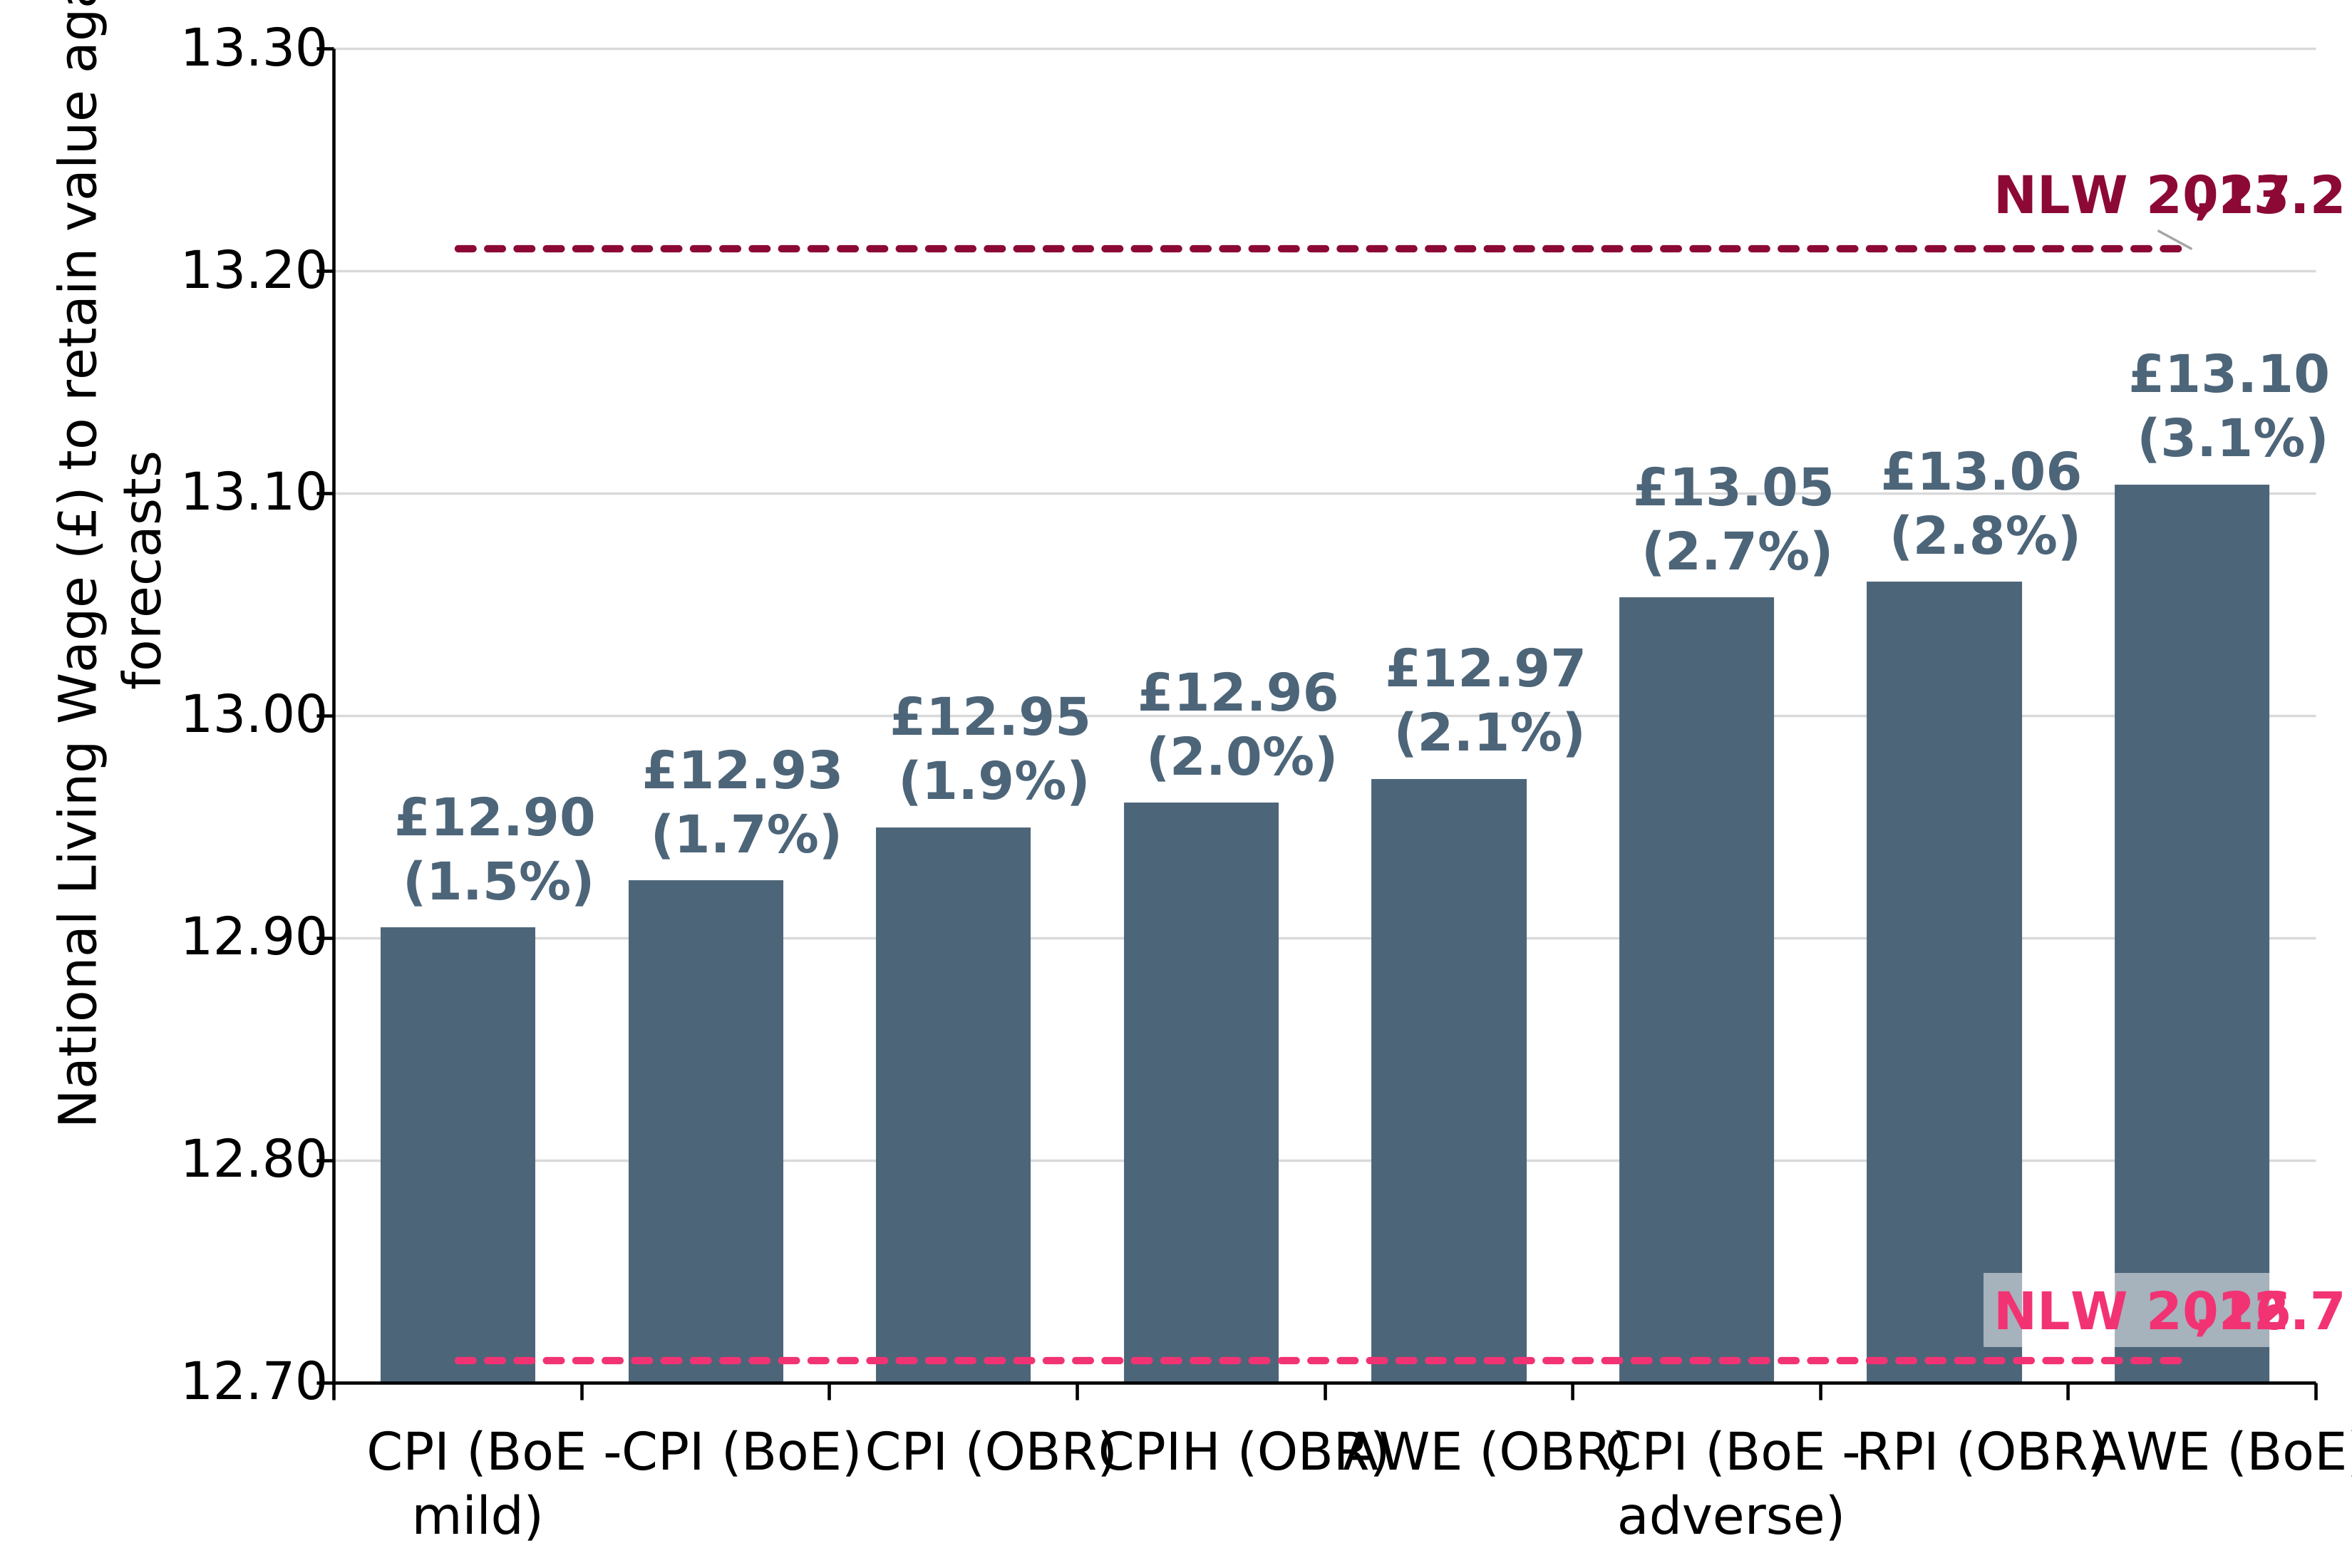
While the rate recommended is below that needed to reach the reference point, it is above a range of inflation forecasts from April 2027 to March 2028. This includes the Bank of England’s “adverse” scenario it published over the summer, which explored the potential effects of a prolonged energy cost shock.
Therefore, given current forecasts, we judge that our recommendation will protect the rate in real terms over the period specified in our remit.
16.1 2026 inflation forecasts by month of forecast, median of HMT panel
16.2 NLW value required to keep up with inflation or average weekly earnings forecasts
17. We have made progress towards aligning the 18-20 Rate with the NLW in recent years
The remit for younger workers continues to state the Government’s desire to lower the age of eligibility for the NLW to 18. Over the last four years we have made good progress on this aim and increased the 18–20-Year-Old Rate substantially, reducing the gap between it and the adult rate.
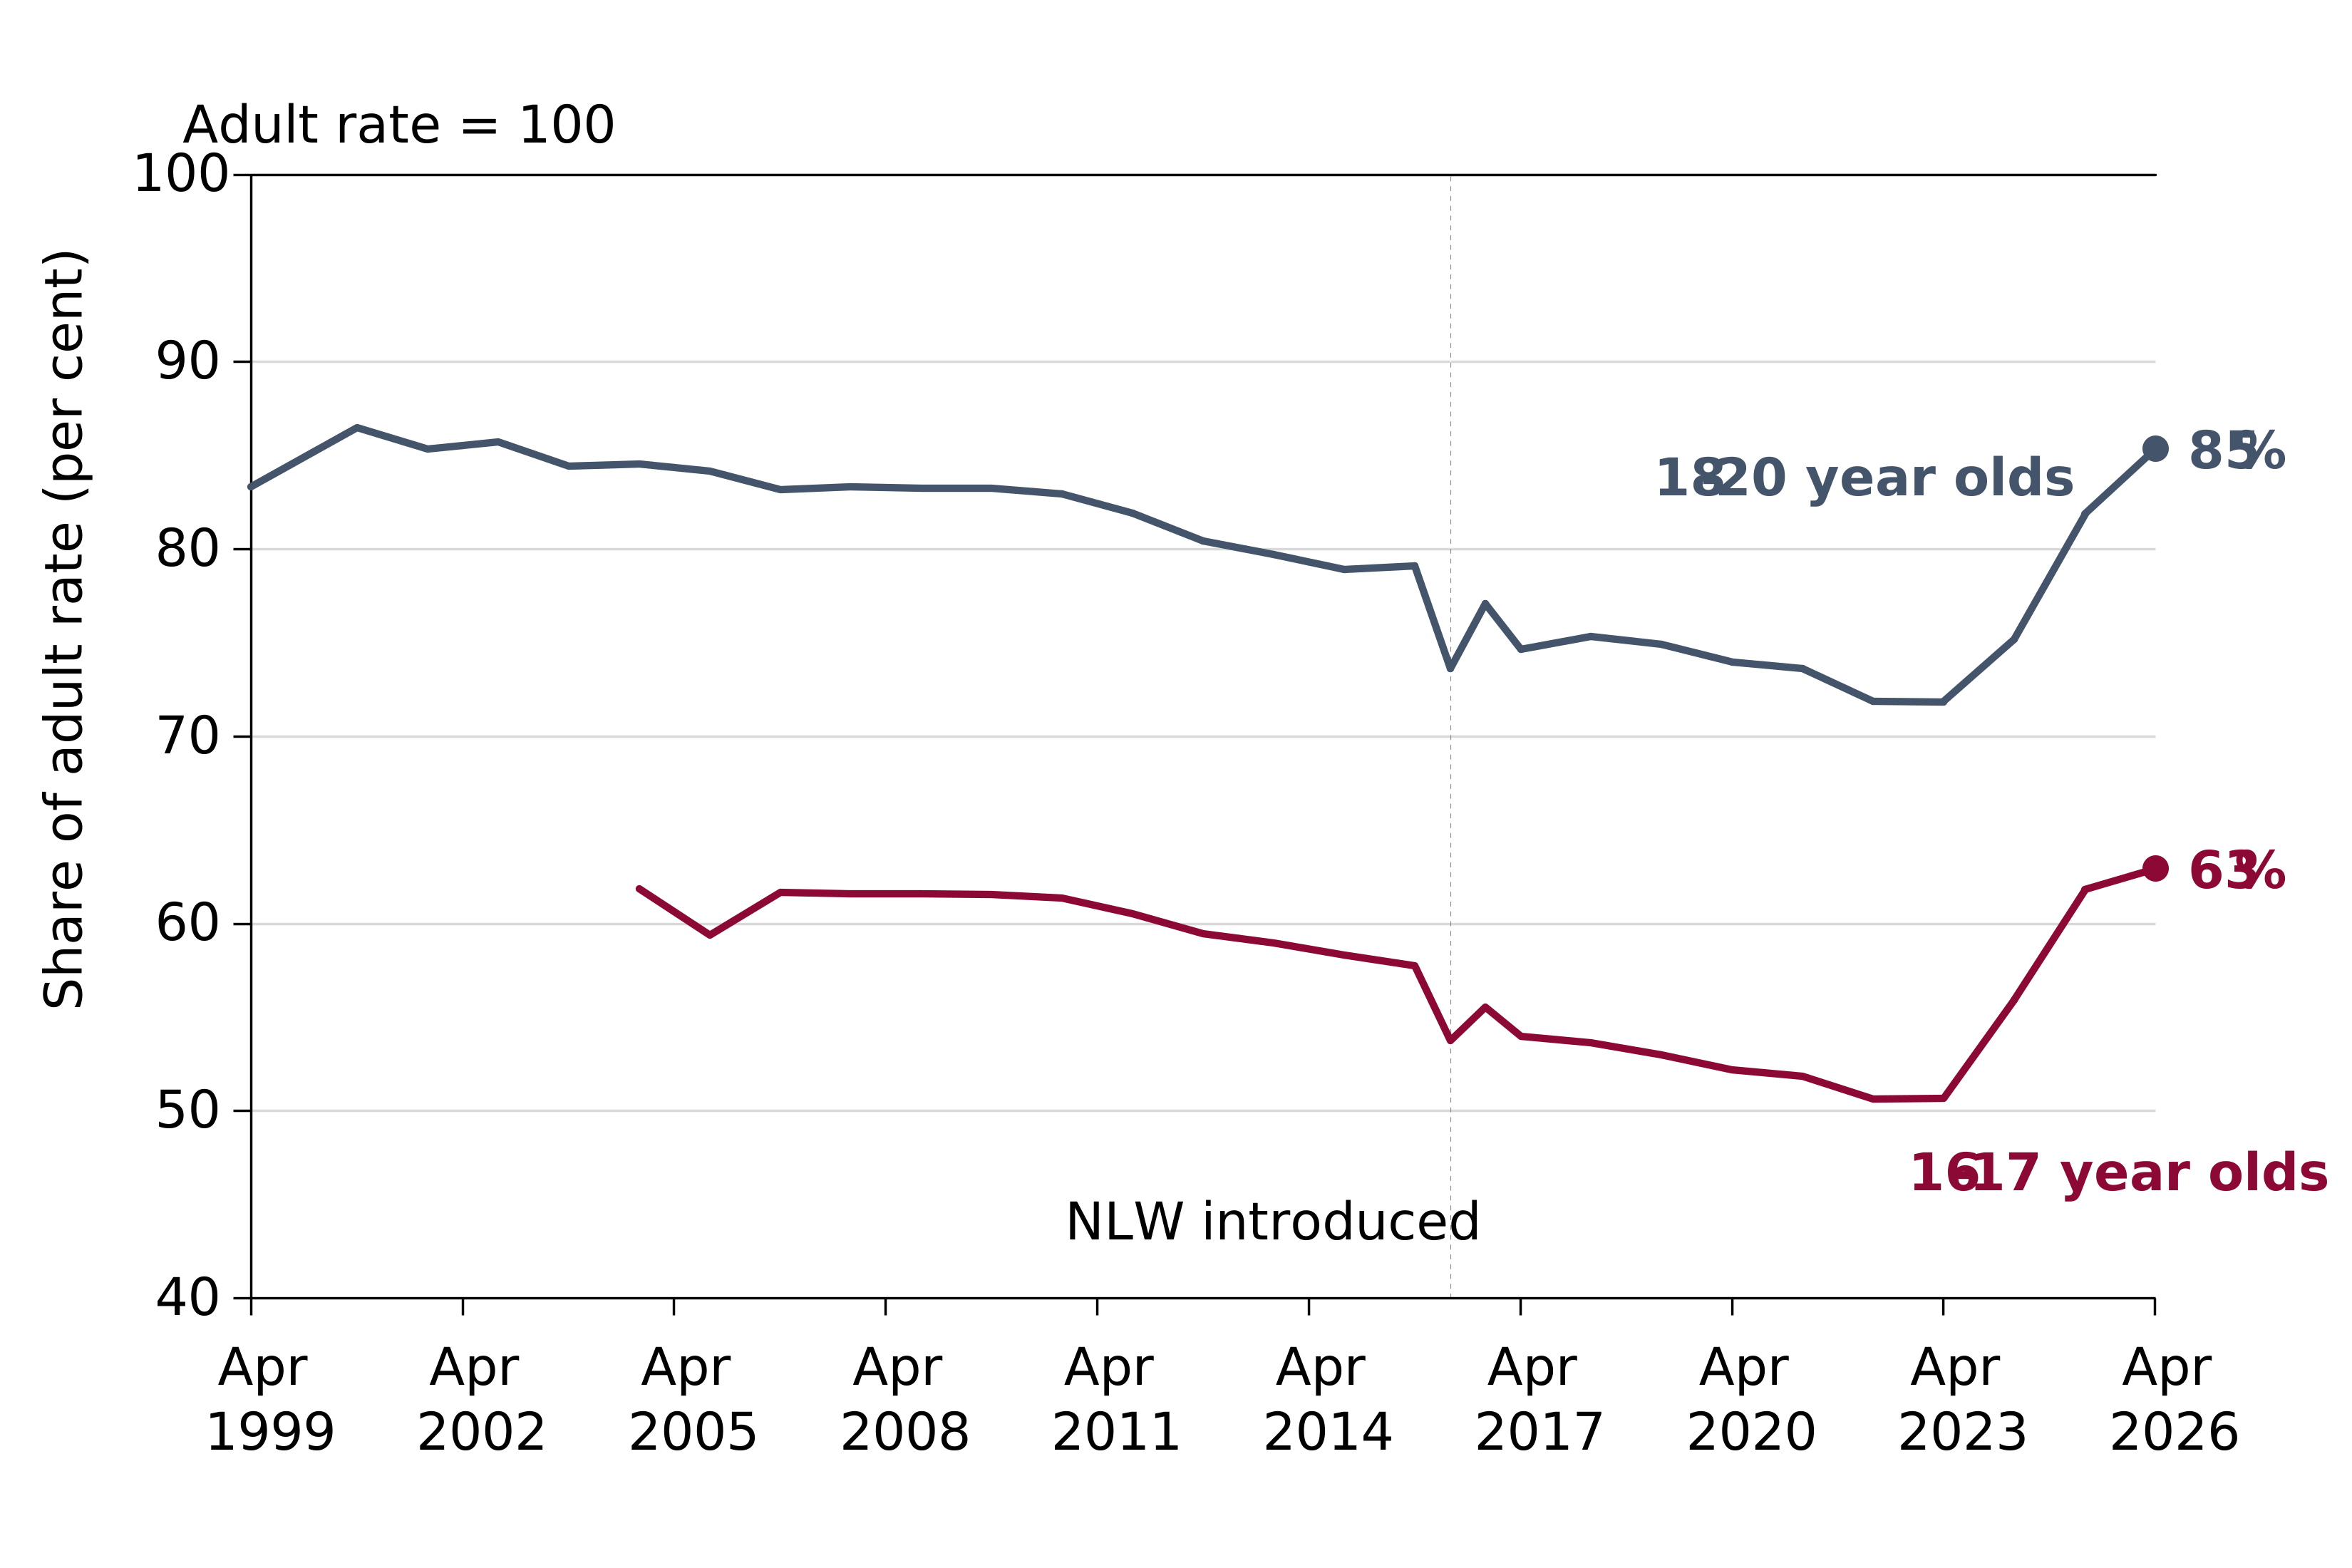
The 18-20 Year Old Rate was 72 per cent of the NLW in April 2022 and reached 85 per cent of the NLW in April 2026. The last time the gap was this low was 2002.
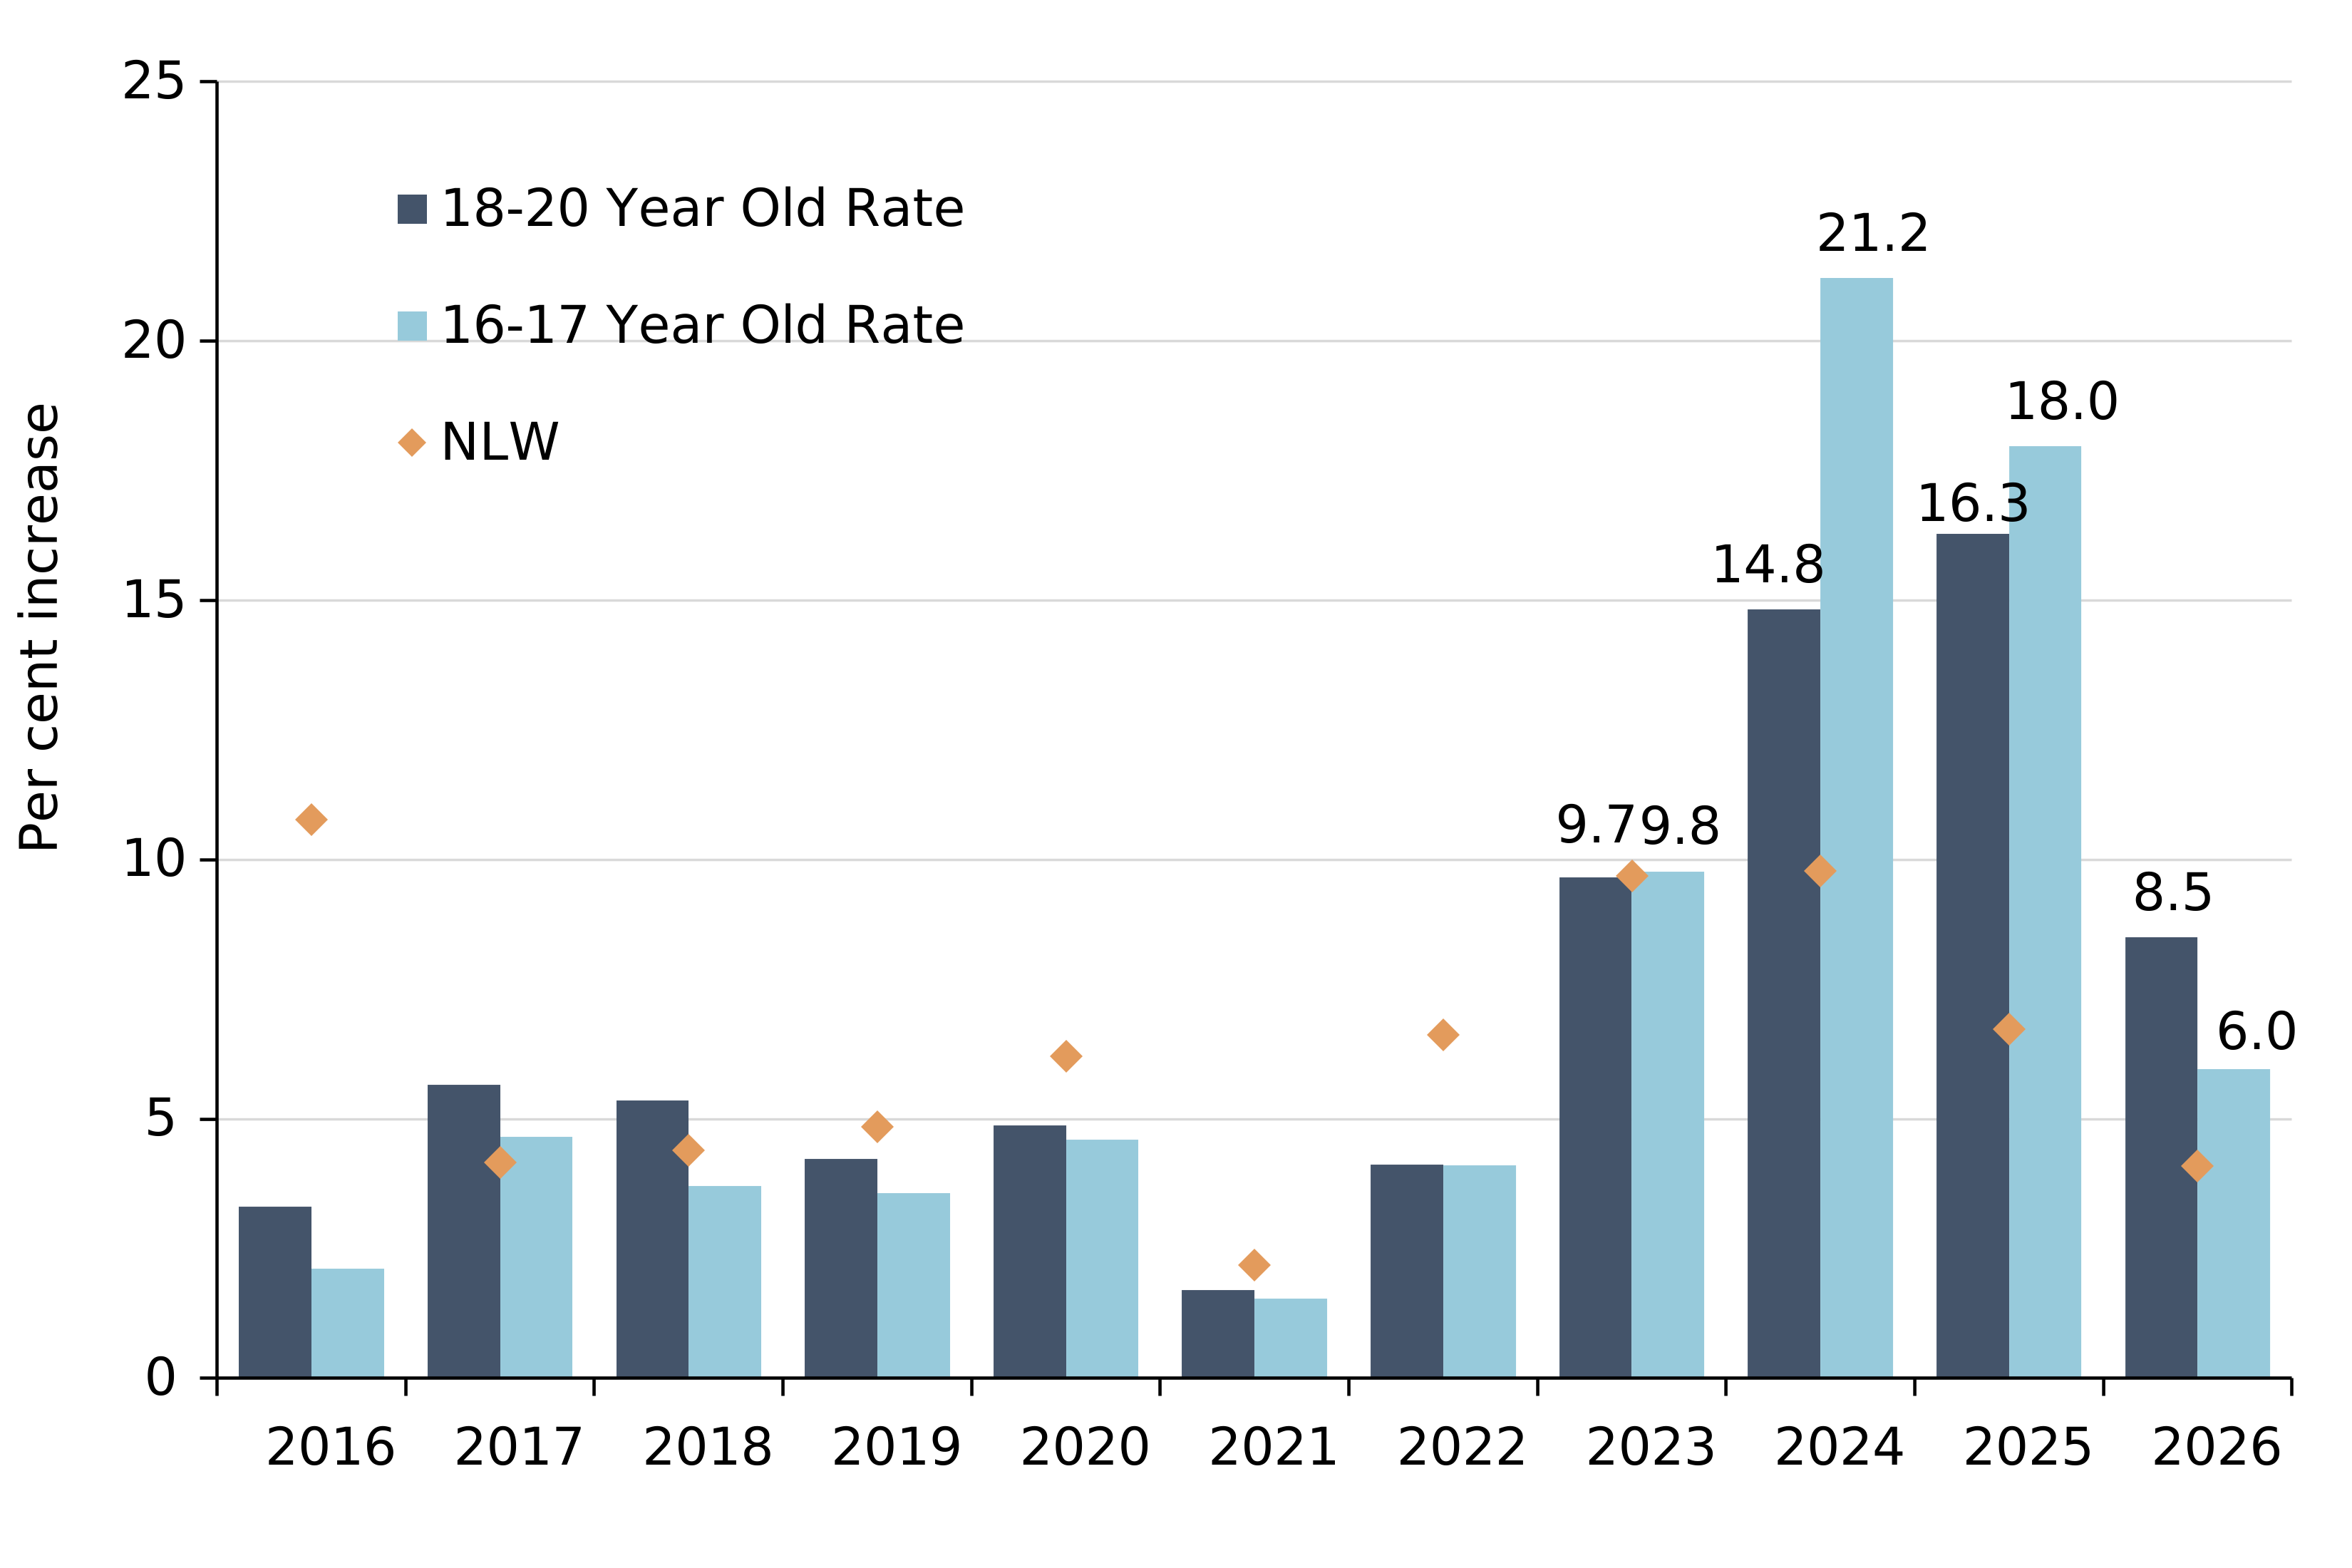
Large increases to youth rates in recent years have also delivered substantial real-terms increases. The wage floor for 18-20 year olds has grown by 59 per cent in nominal terms over the last four years. For 16-17 year olds, their nominal wage floor has grown by 66 per cent over the same period.
17.1 Youth rates as a proportion of adult rate
17.2 Minimum wage increases (April to April)
18. The current employment picture is worse for young people than adults
This year the remit gives the LPC full flexibility on the pace and timing of rate alignment for 18-20 year olds with the NLW, and asks us to give priority to youth employment.
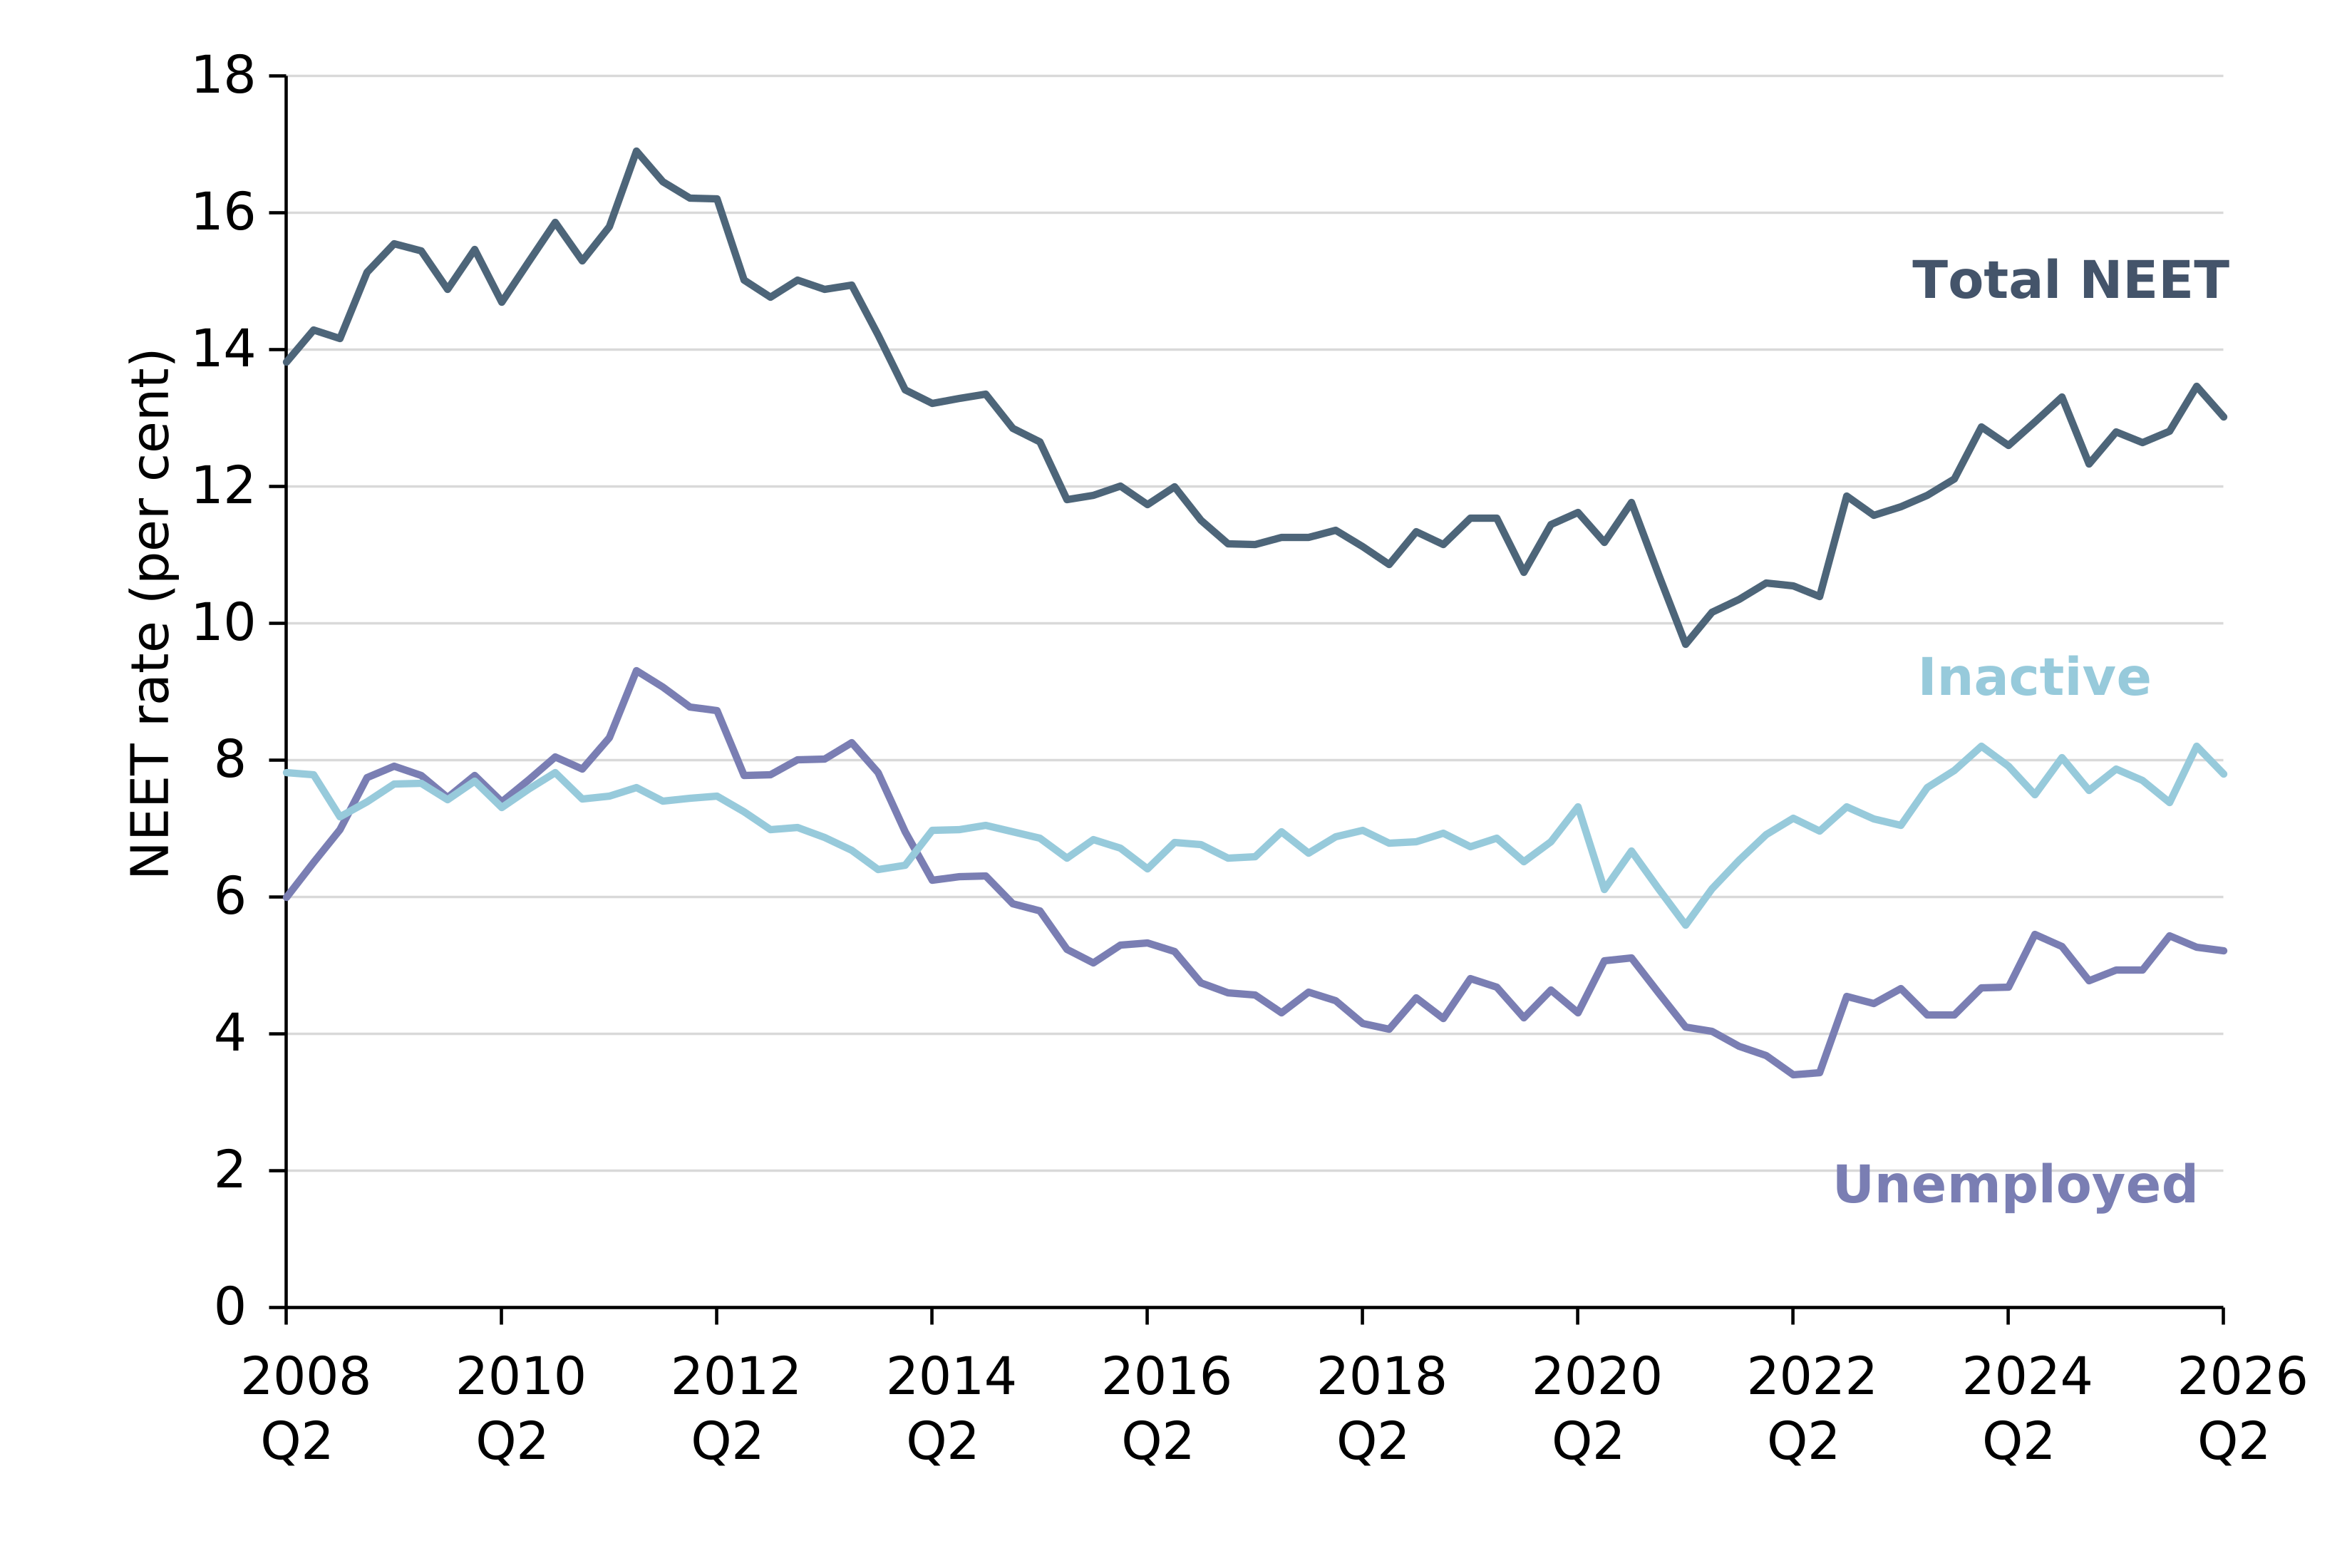
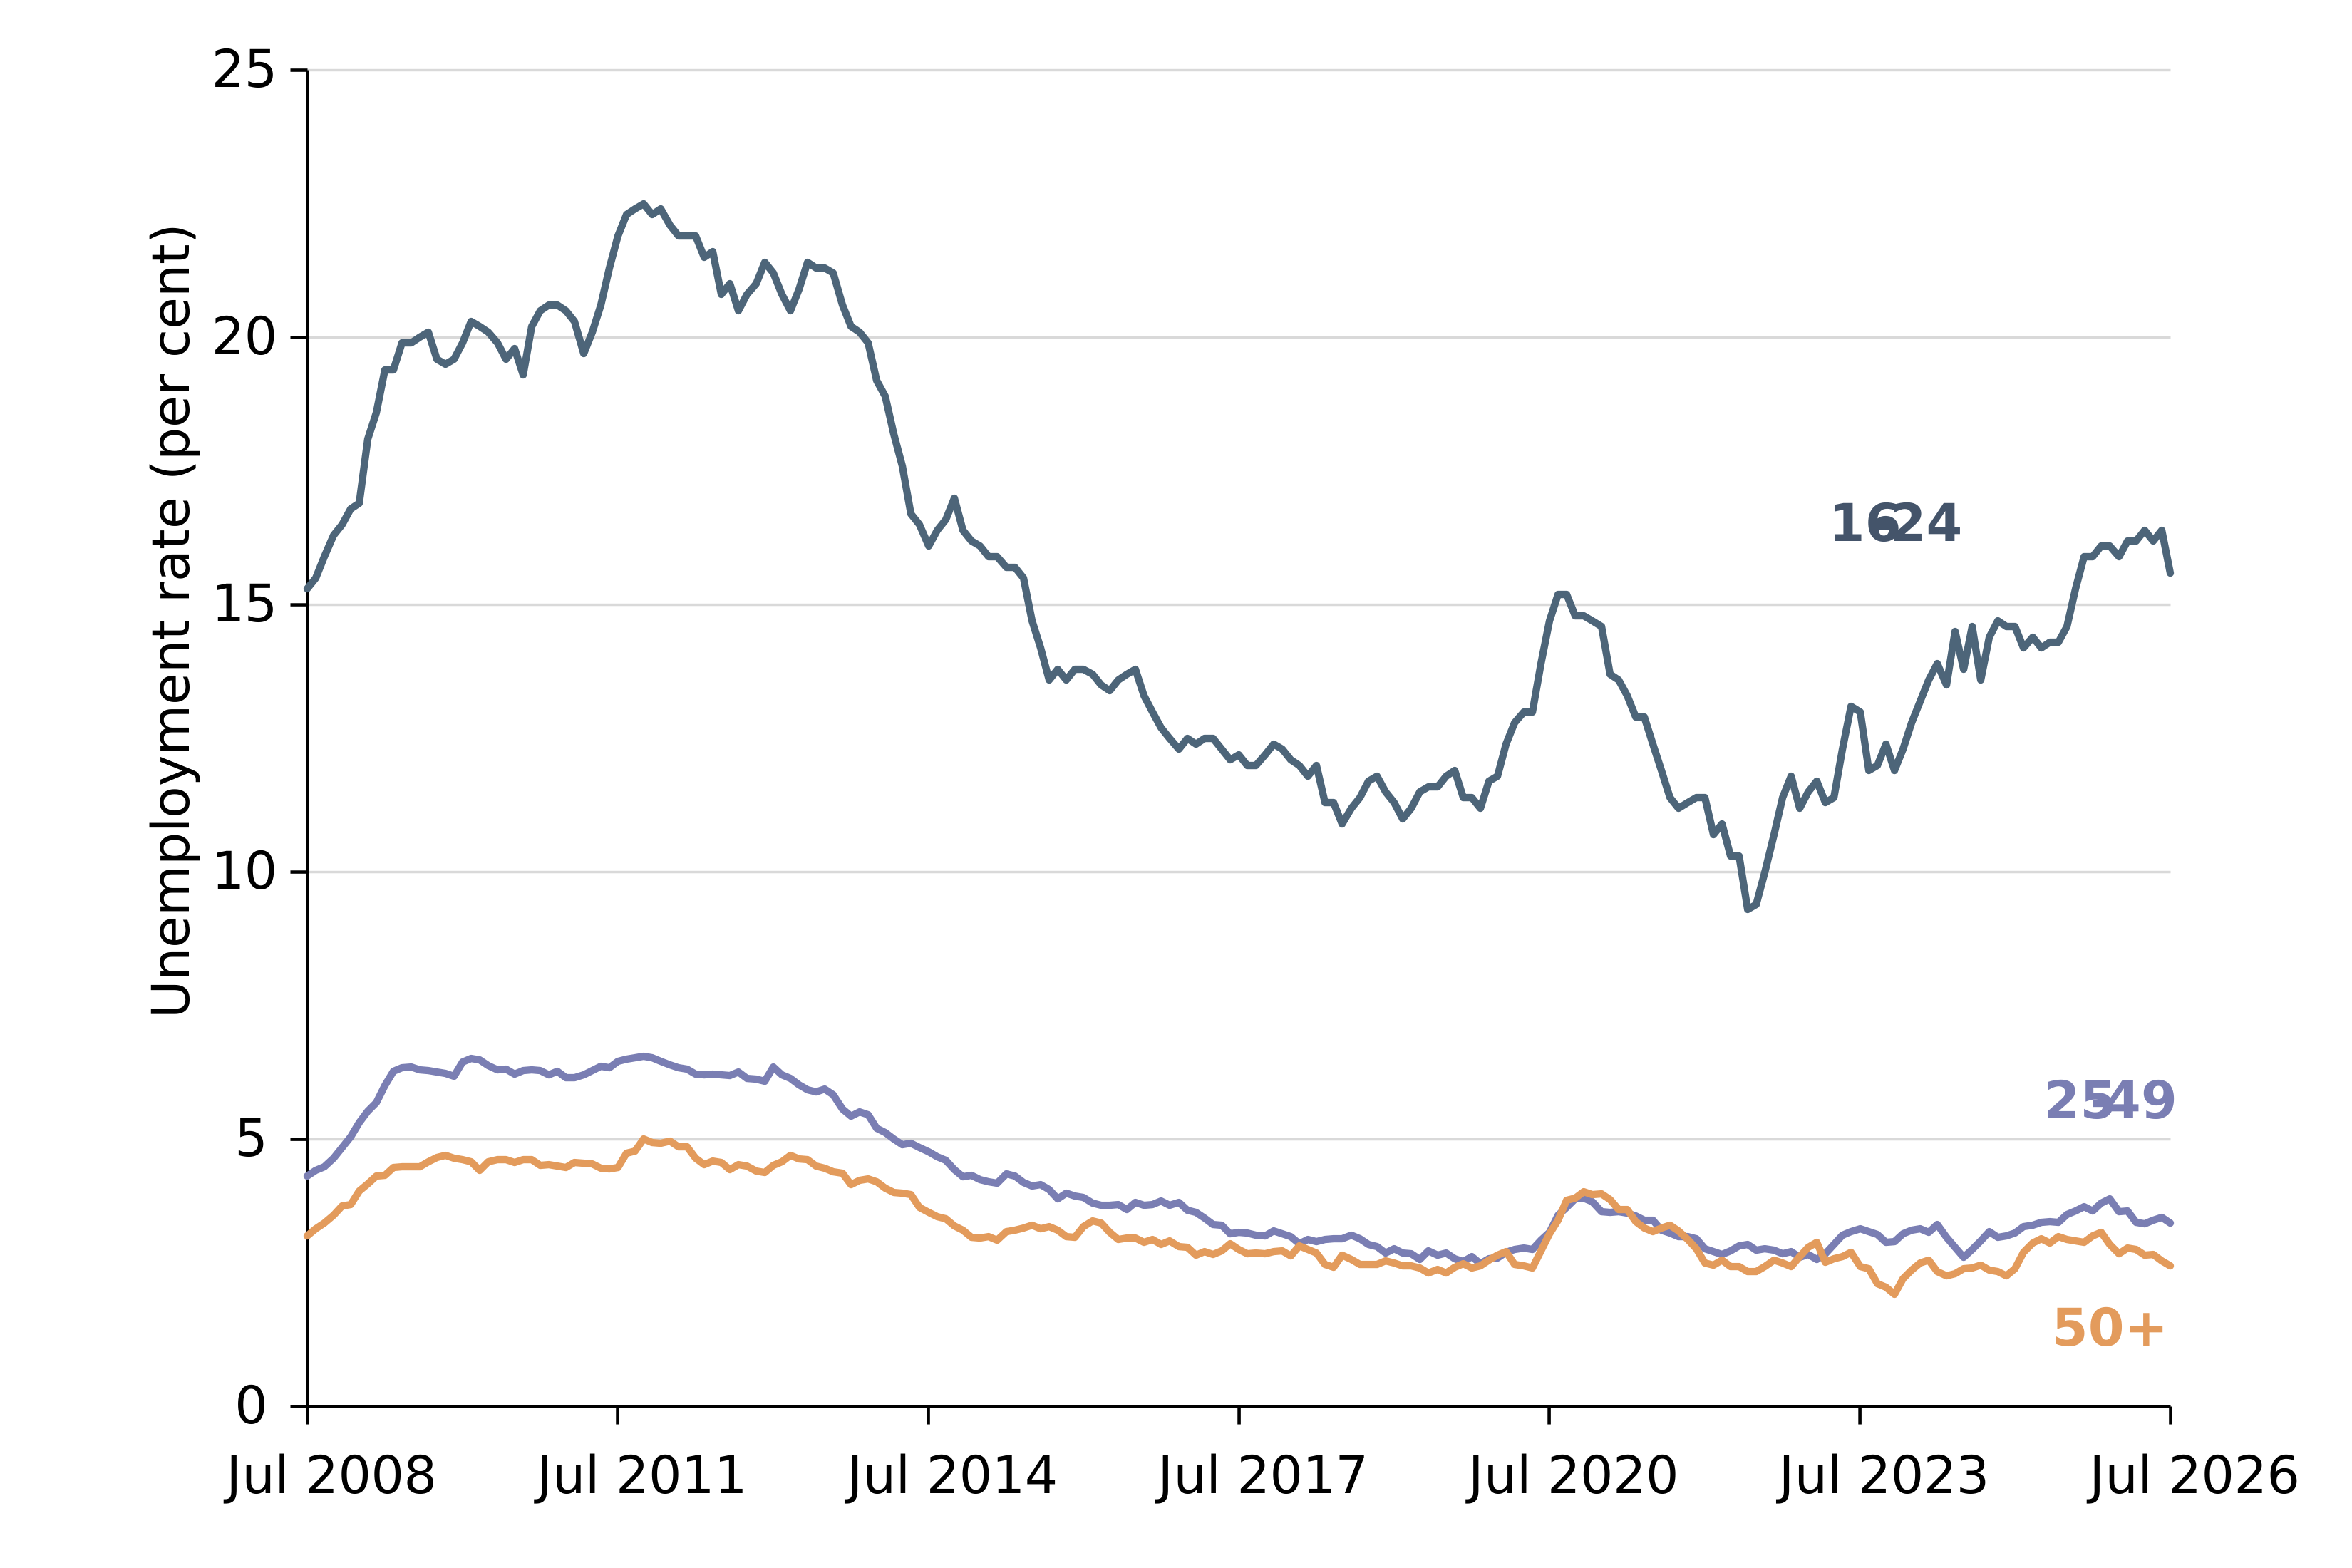
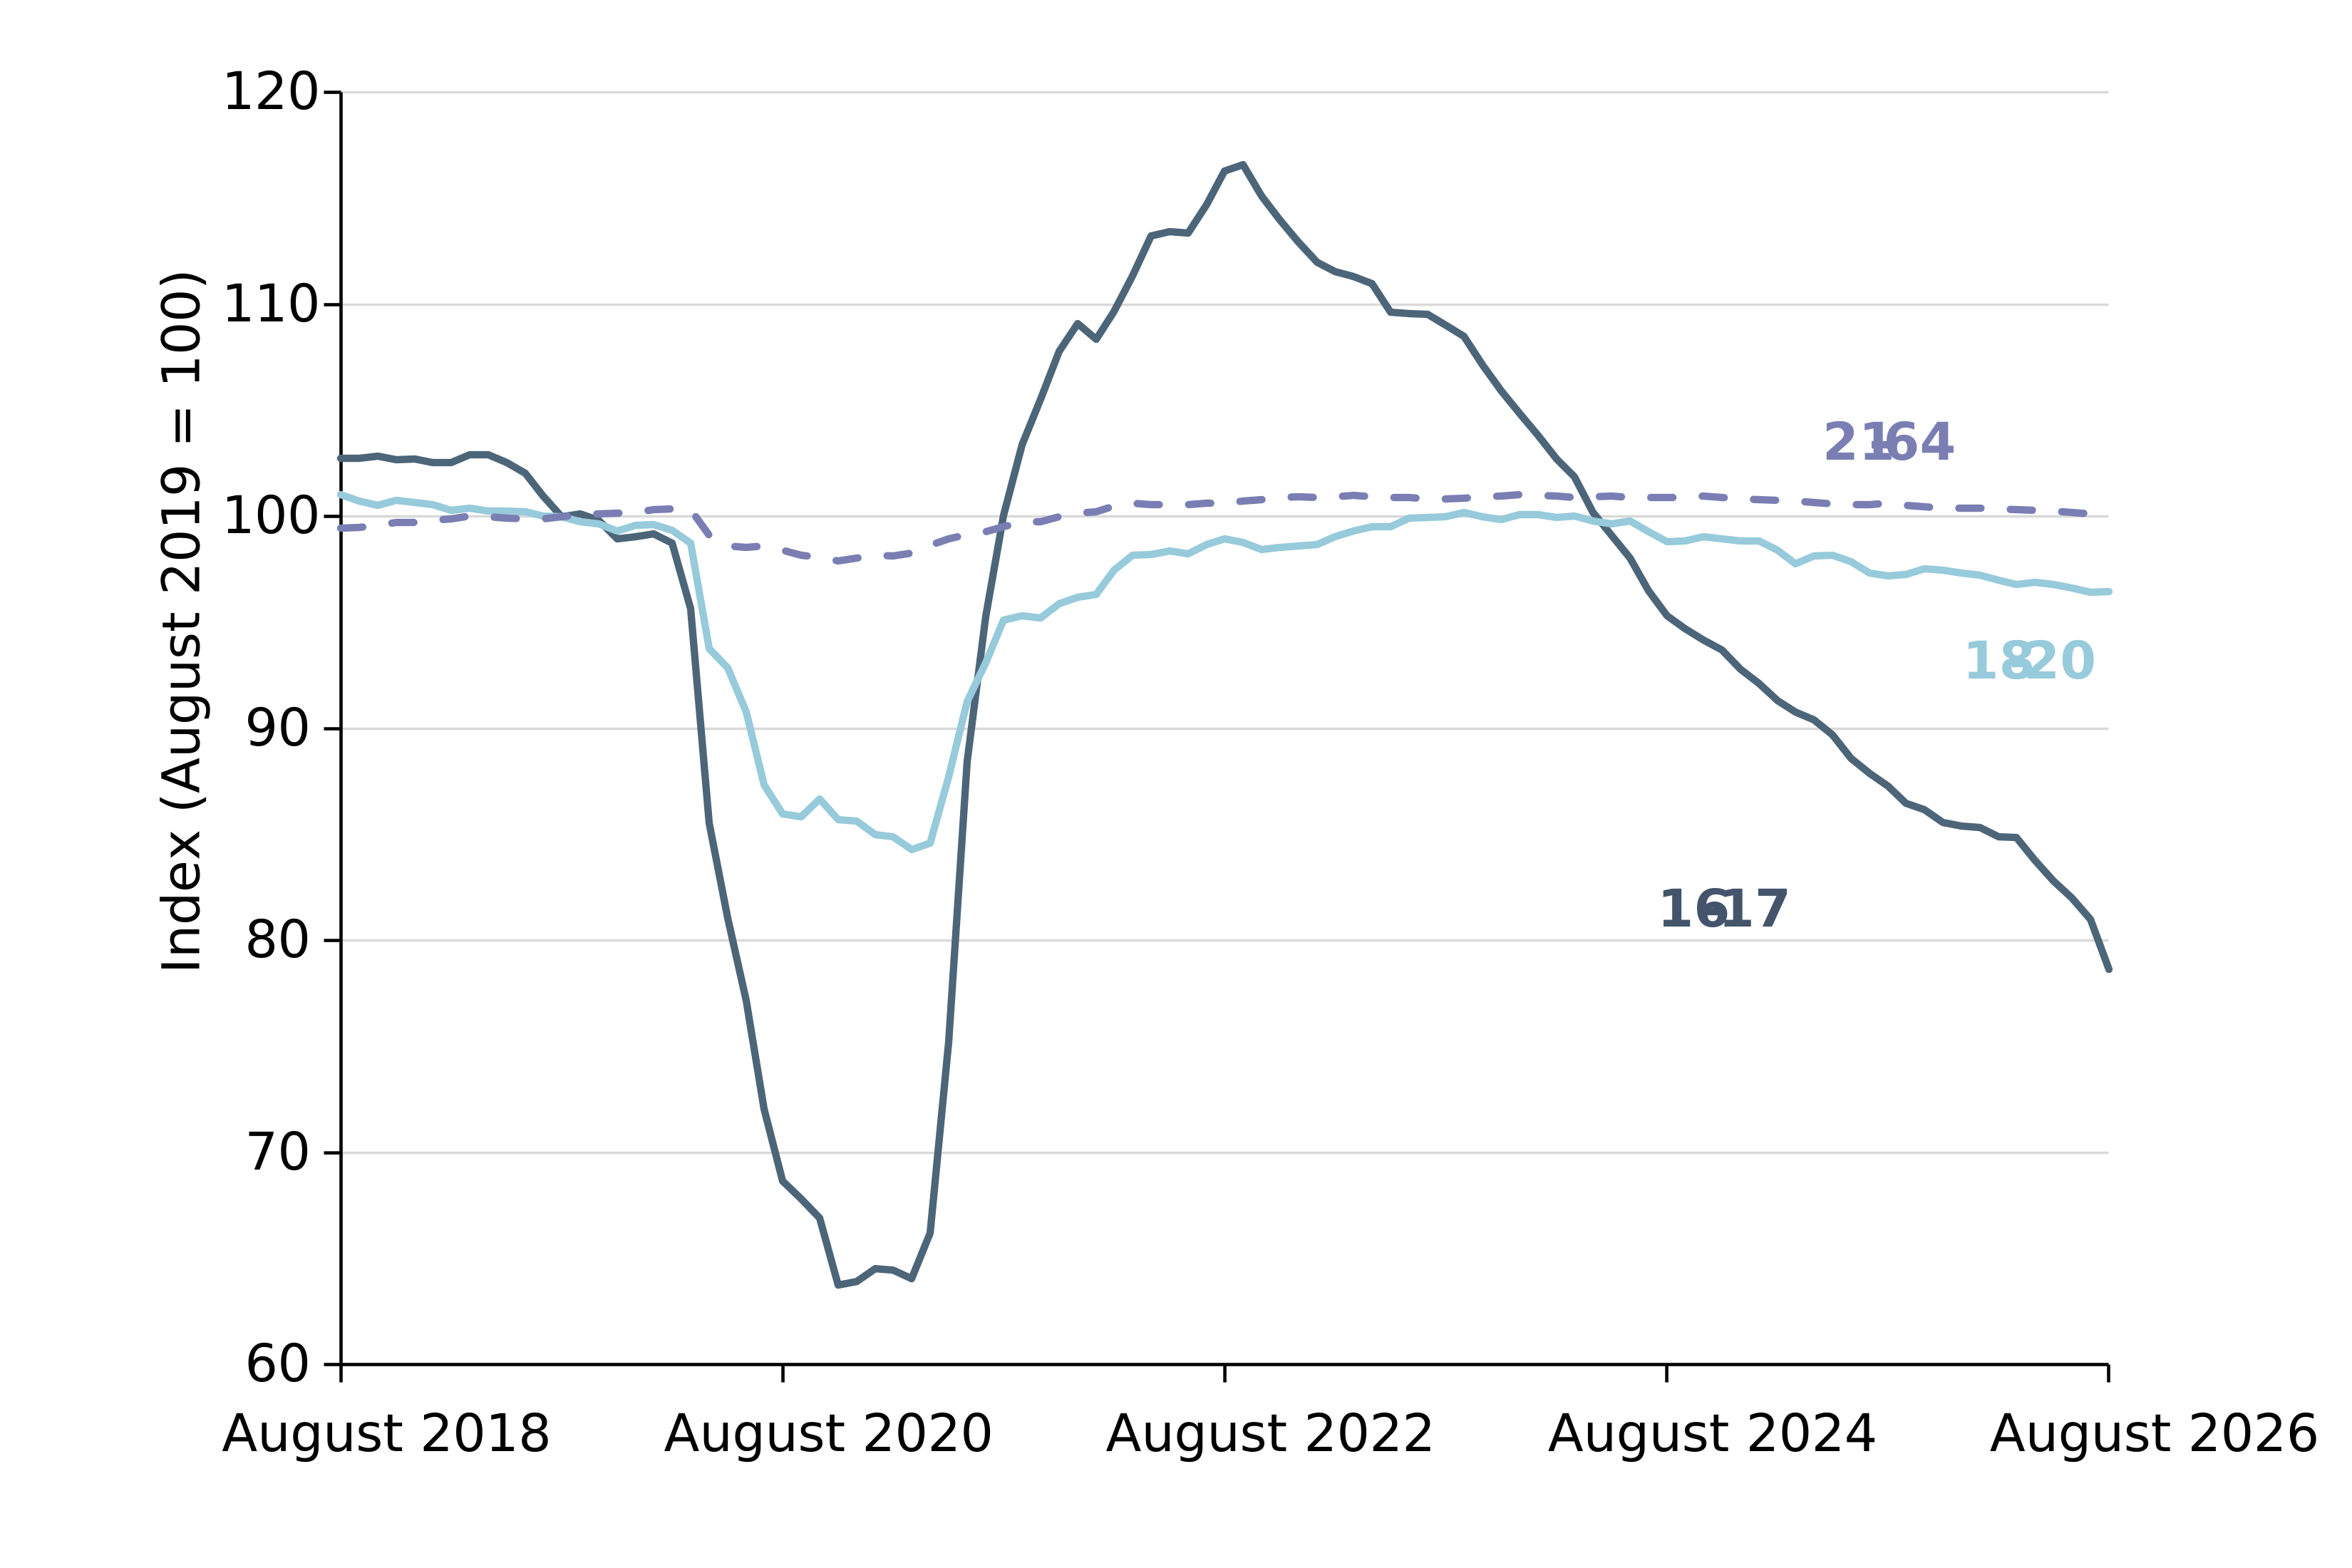
The youth labour market is in a different position to that of adults. Labour Force Survey (LFS) figures indicate that adult unemployment peaked at the end of 2025 and fell over the first half of 2026. By contrast, youth unemployment remains above its covid peak and at rates last seen in 2015. High NEET rates among young people are well documented and remain a concern. Other data sources, including HMRC PAYE RTI employee data, corroborate this picture of a weaker youth labour market.
The context we described last year, when we said the “’low hire, low fire’ labour market is a challenge for young people as they are more dependent on vacancies” is the same, but this year there are even fewer vacancies, particularly in the youth-friendly sectors of retail and hospitality .
While employment has deteriorated among younger workers, the evidence does not suggest this is a result of minimum wage increases. We will publish more detailed analysis of this in our main report.
We anticipate that the Milburn review may have a significant impact on youth labour market policy and our future recommendations will be made in this context.
18.1 NEET rate, 16-24 year olds
18.2 Unemployment rate, by age
18.3 RTI employee rates index by age (August 2019 = 100)
19. Our recommendation for 18–20-year-olds accounts for potential impacts
While our view remains that there is little evidence to suggest recent increases in youth rates have been a driver of reduced employment, that does not mean that future increases are risk free. When we first recommended to the Government that there was potential to lower the NLW age to 18, we noted the risks (see Low Pay Commission, The National Minimum Wage Beyond 2024).
The increases required are larger than they had been when the NLW age was lowered to 21. In April 2023, the 18-20 Year Old Rate was 72 per cent of the NLW, whereas the wage floor for 21-24 year olds was above 90 per cent of the NLW prior to alignment.
More young workers would also be affected by the lowering to 18. Fewer than a quarter of 21-24 year olds were paid below the adult rate prior to alignment, whereas half of all 18 year old employees were paid below the NLW this April.
We also said that these changes should be managed carefully, with time allowed for full evaluation – the remit explicitly gives us this time.
And finally, we noted that the importance of demand for young workers. “In particular, we would want to carefully monitor levels of demand for young workers. The labour market is tight now, but is softening, if this continues then the risks increase.”
Our view is that while there is still potential to lower the age limit, especially for 20-year-olds, demand for young workers has slowed and the risks associated with ambitious rises have increased. Therefore, we recommend pausing on alignment by recommending a percentage increase in line with that for the NLW, which we believe is consistent with the remit’s aim of prioritising youth employment. We recommend a 3.9 per cent increase or 42p to £11.27.
19.1 Youth rates as a proportion of adult rate
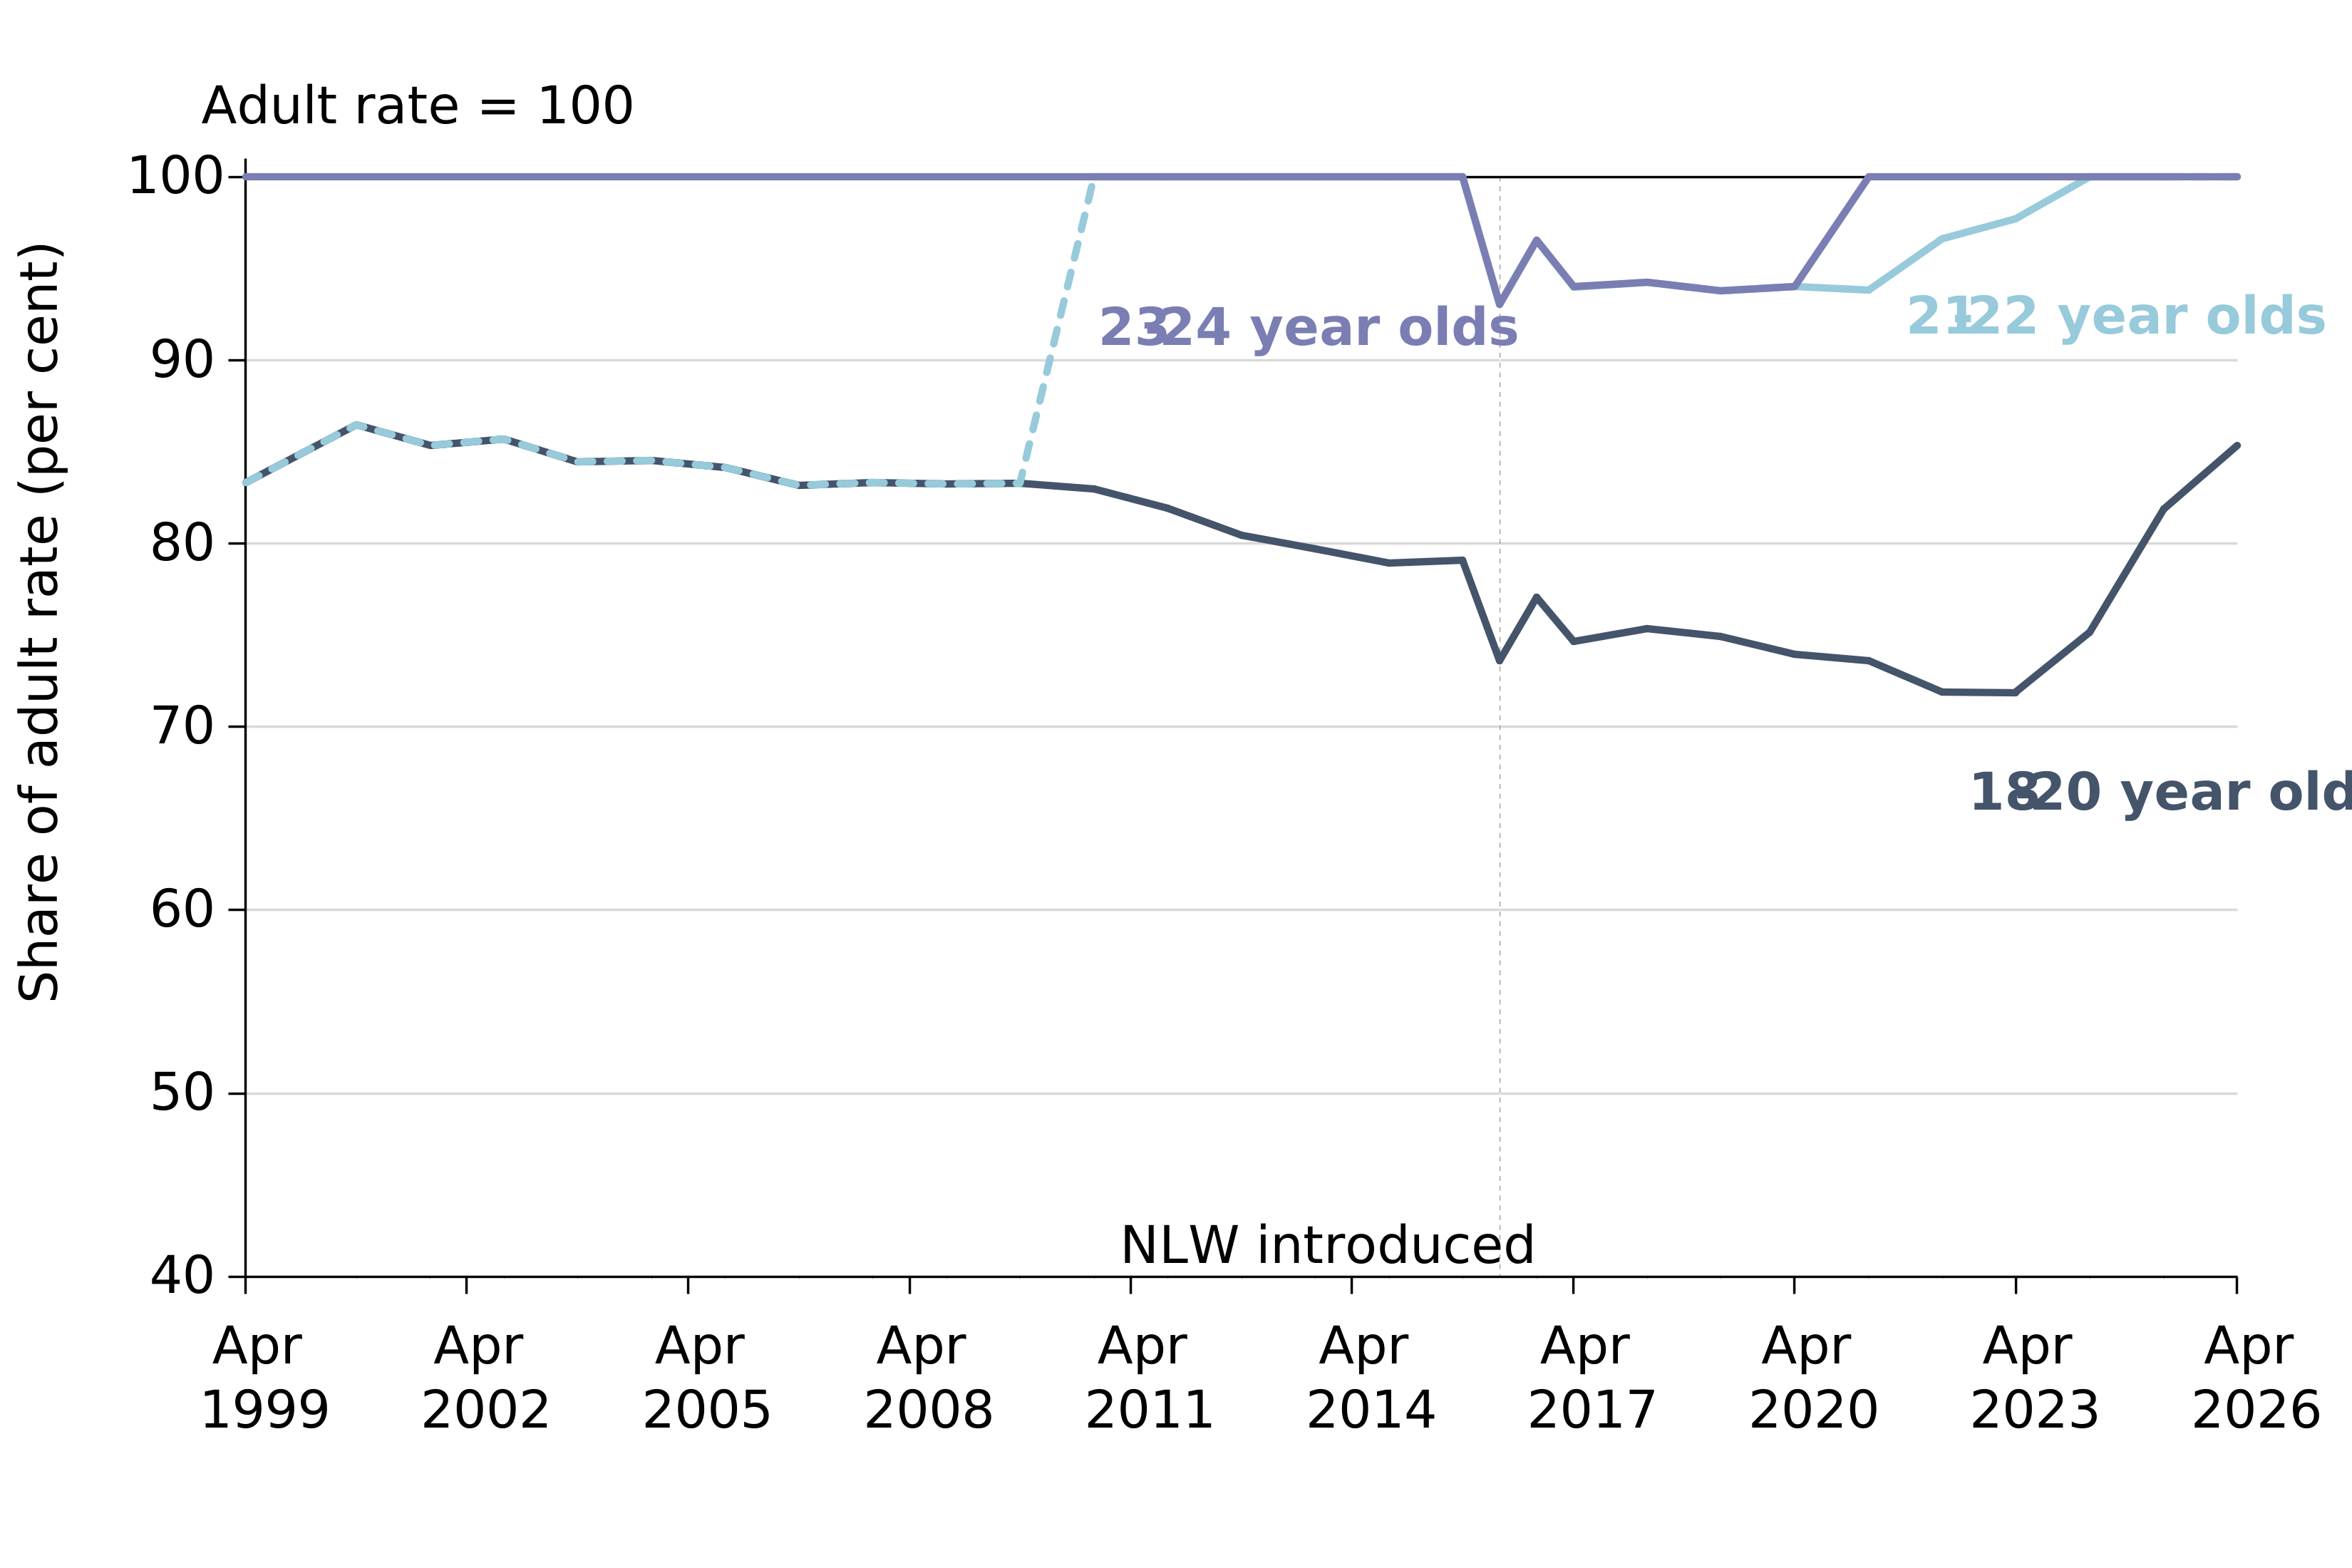
19.2 Share of young workers paid below the adult minimum wage rate, by age
20. The 16–17-year-old labour market is distinct
For this rate, the remit asks us to set a rate that supports the employment of this group. To do this it is important to understand how their labour market is distinct.
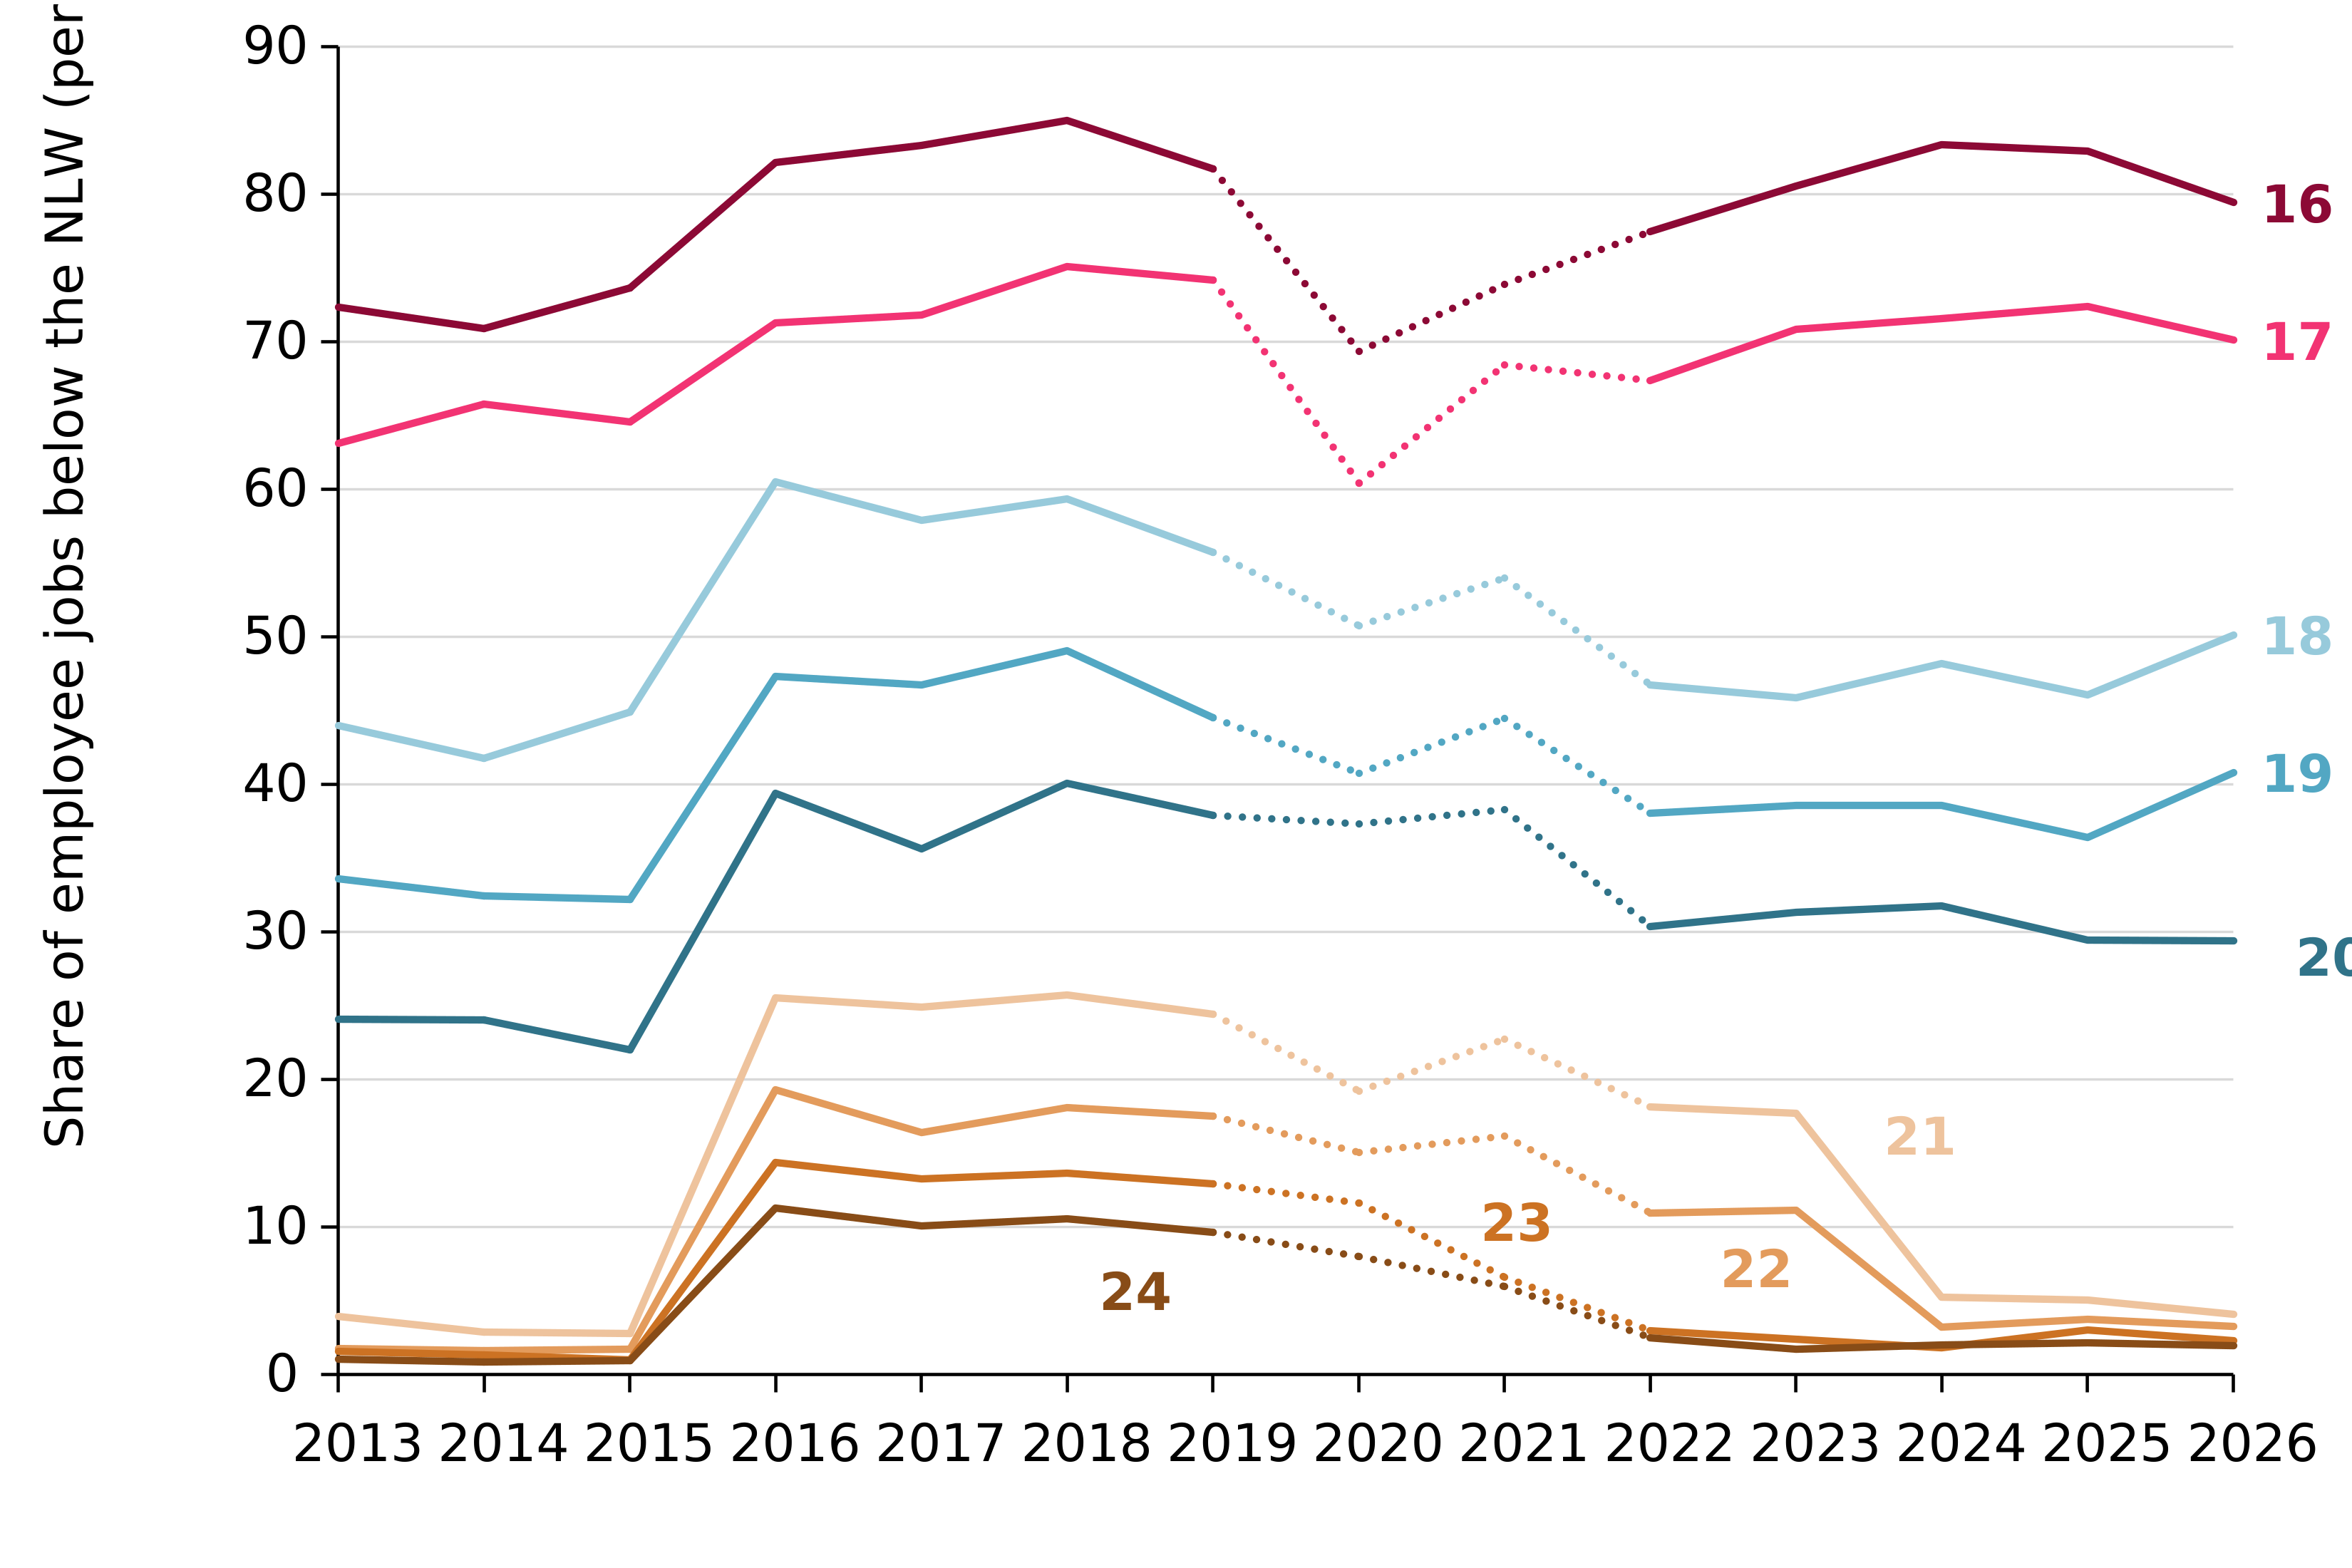
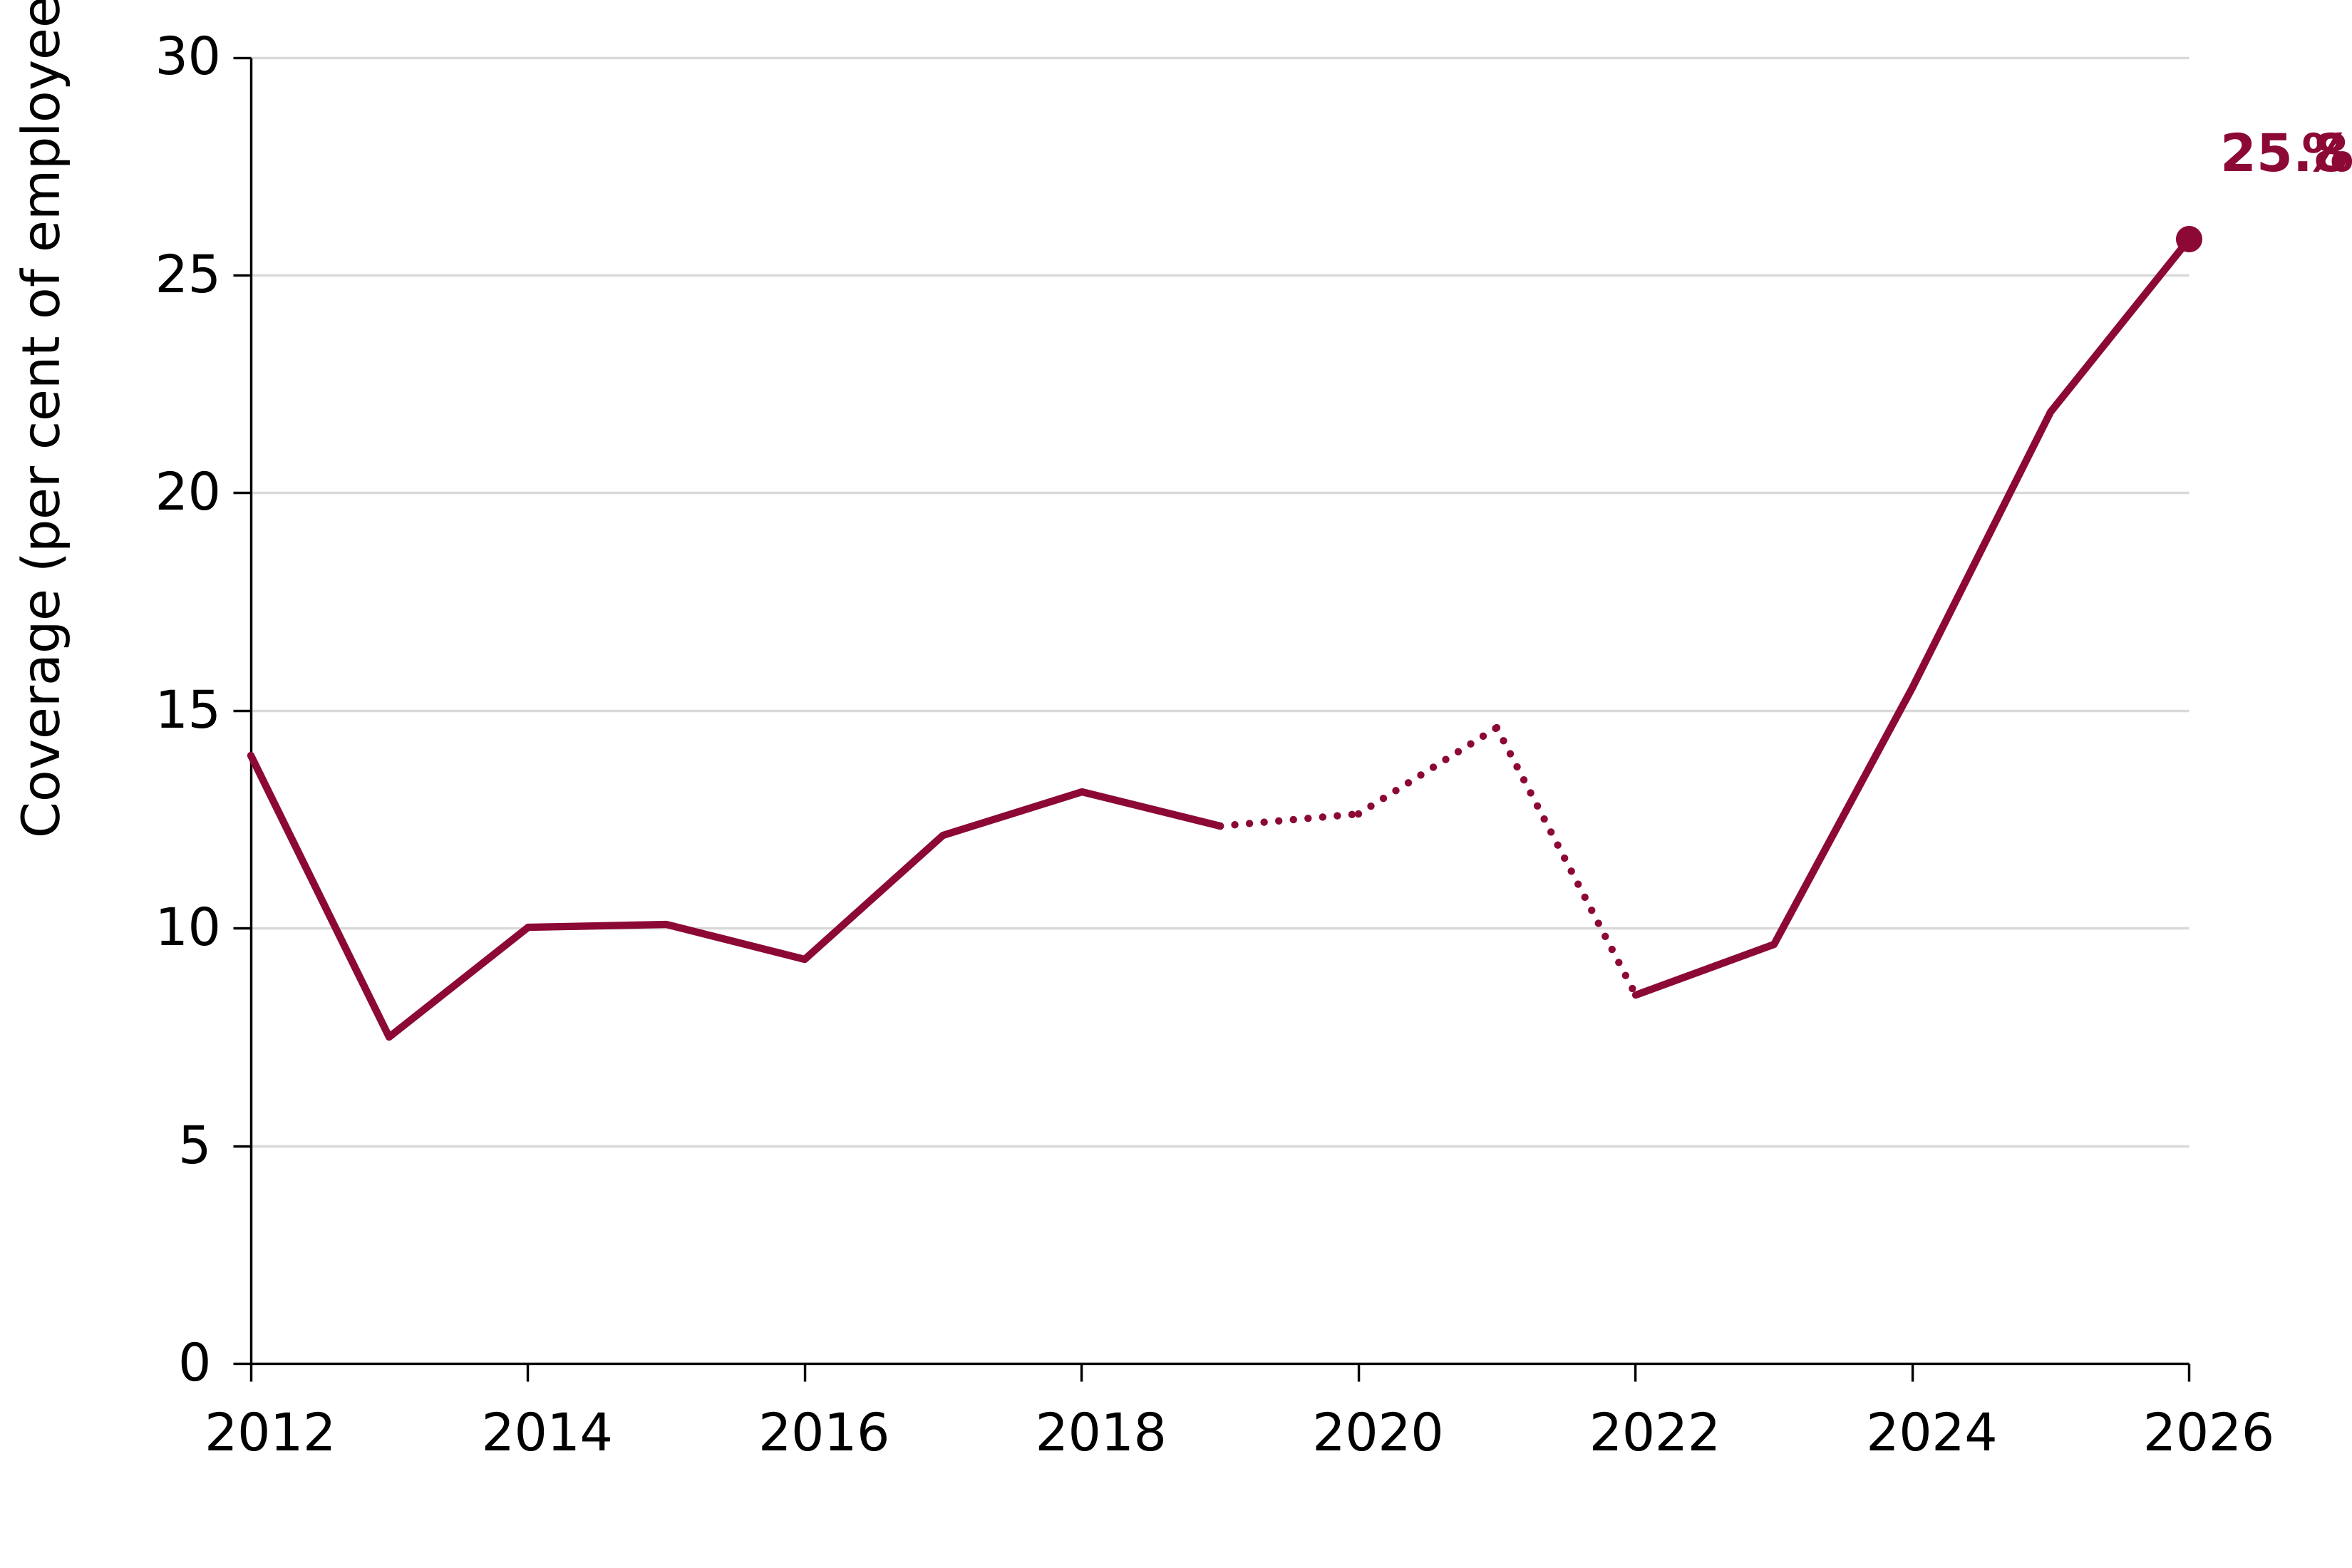
Firstly, workers of this age are more likely to work in micro, small and medium sized firms. This is even more the case for those 16-17 year olds who are paid the minimum wage rate. Coverage – the share of jobs within 5 pence of the 16-17 year old rate – is now at just over a quarter of jobs for this age group.
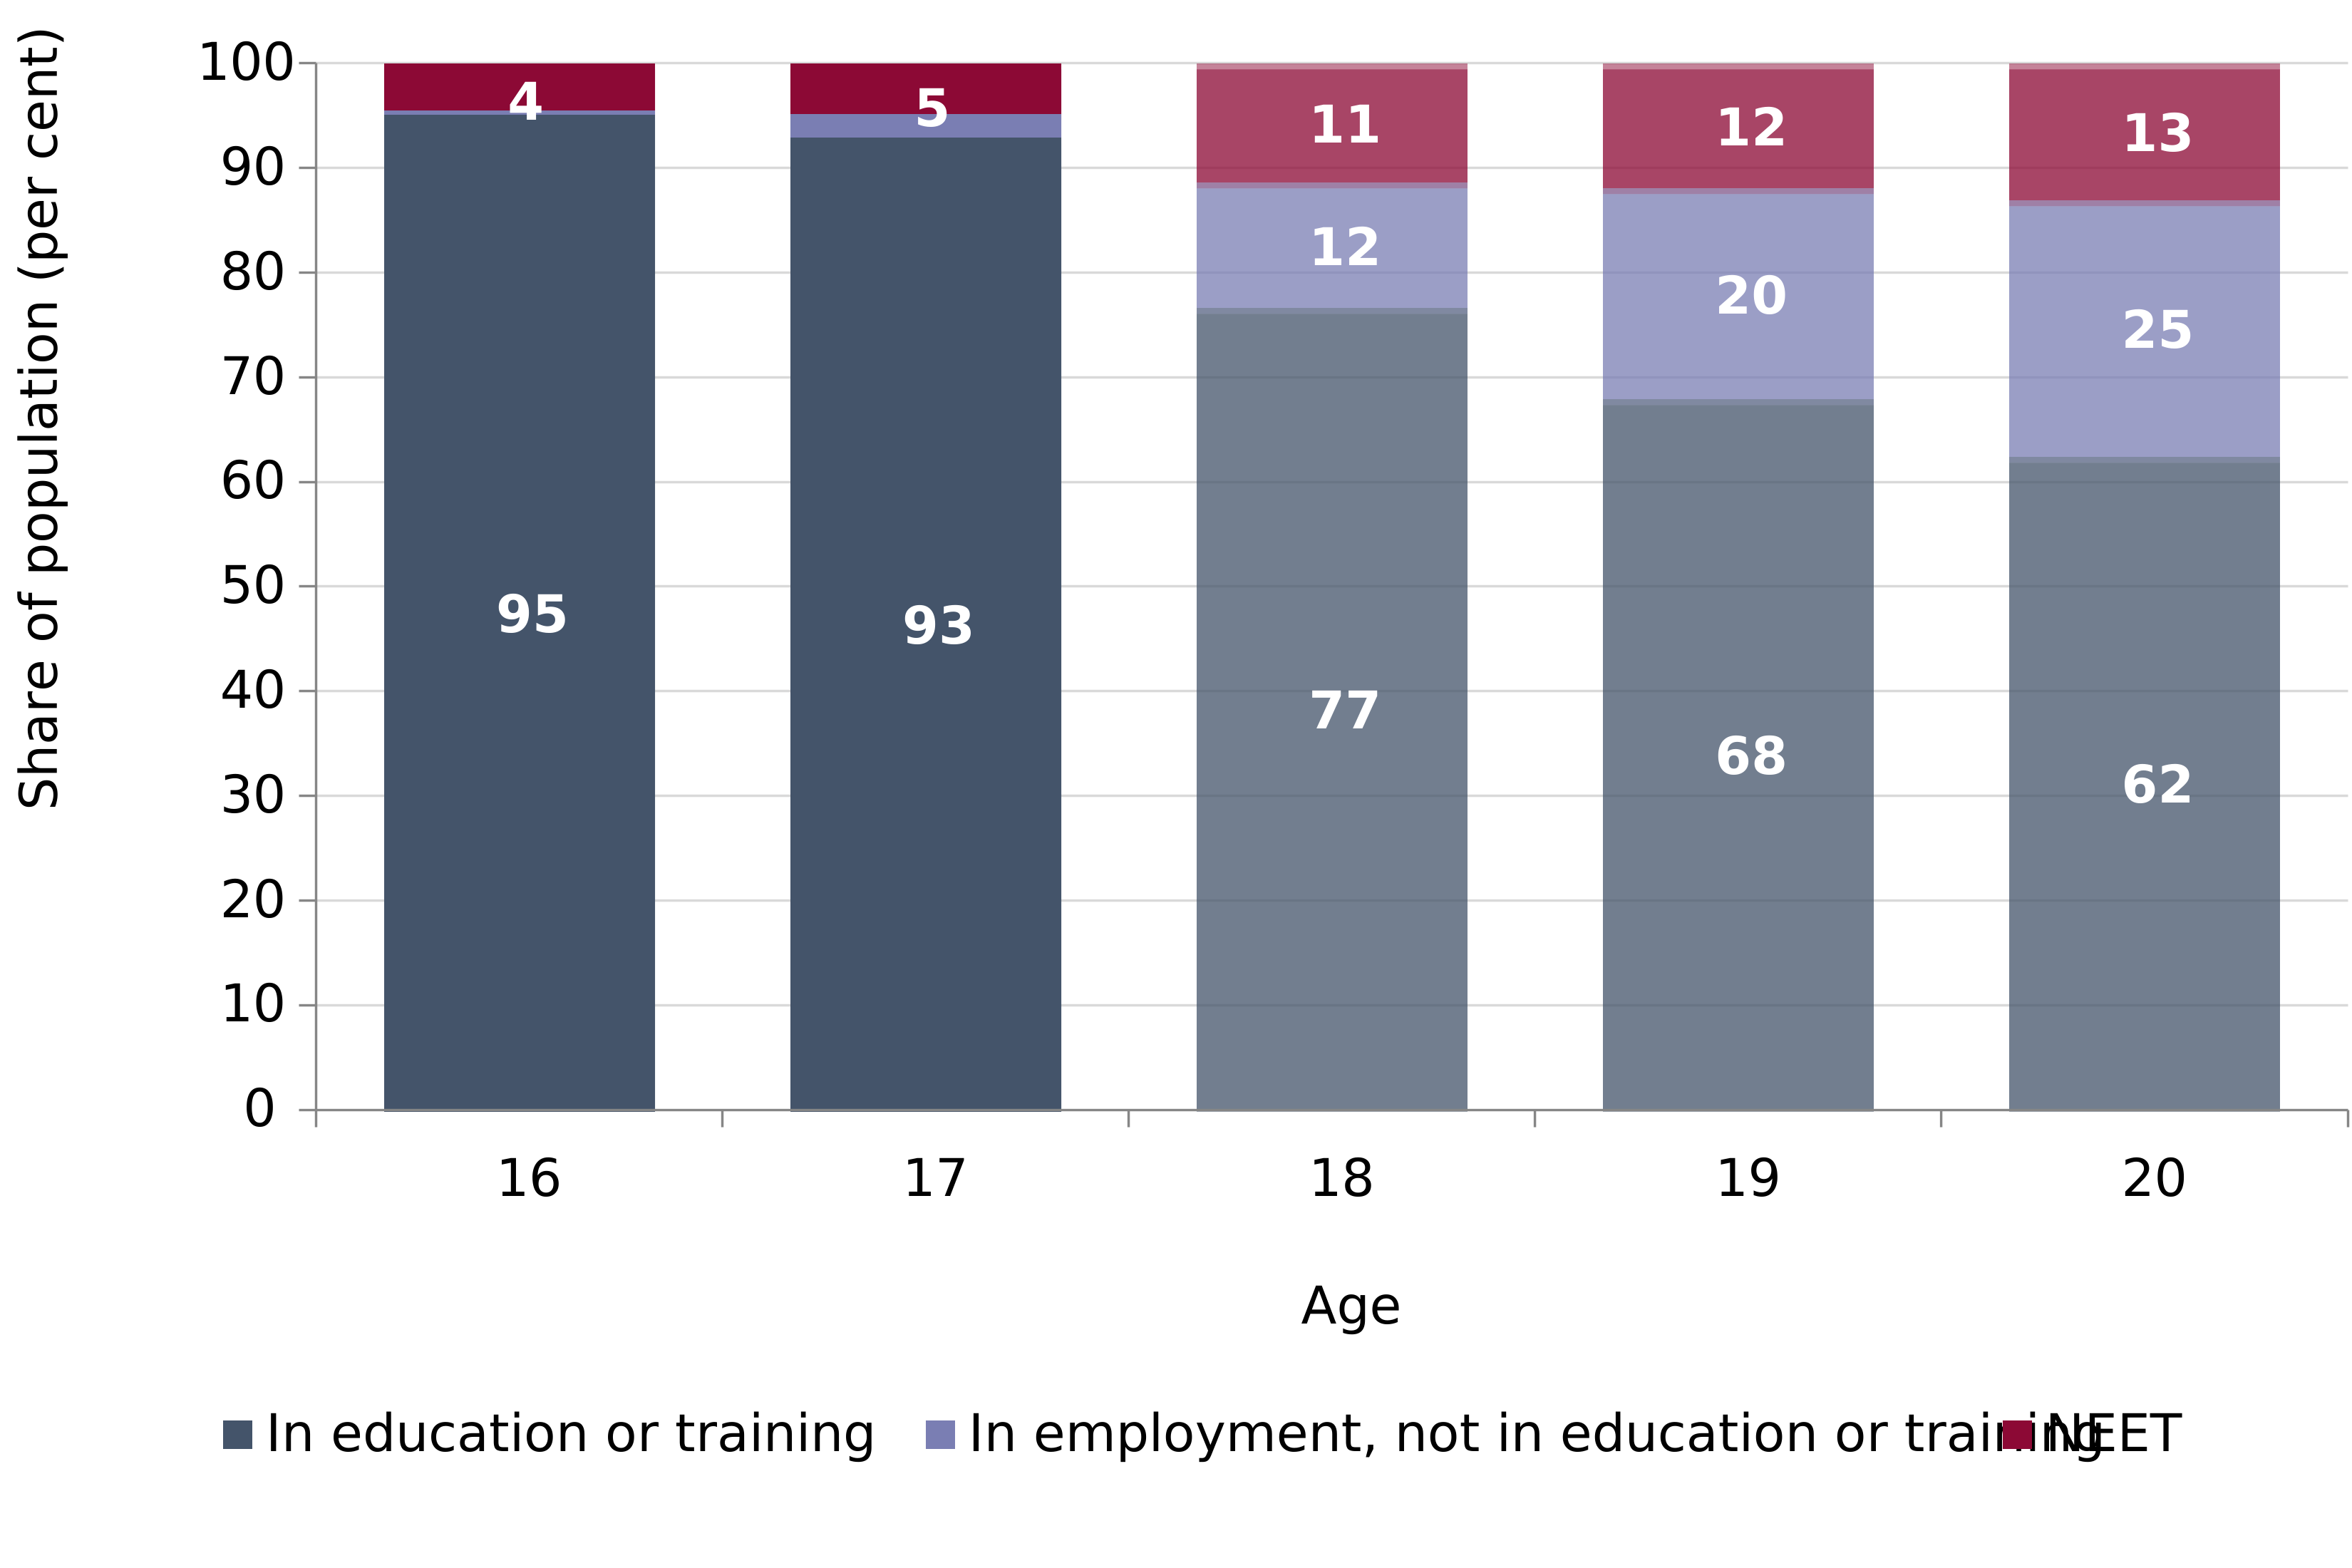
Lastly, the vast majority of 16-17 year olds are in full-time education and so are dependent on part-time jobs that they can fit around their studies.
The previous page showed that employment for this age group has deteriorated in recent years. While the evidence does not suggest this is a result of minimum wage increases, the decline in their employment is hard to ignore and the evidence does not guarantee that future increases are risk free. On this basis we recommend an increase of 31p to £8.31 (3.9 per cent).
20.1 Education and labour market status, by age
20.2 Coverage of the minimum wage, 16-17 year olds
21. Vacancies and starts for apprentices continue to fall
The Apprentice Rate applies to all apprentices aged 16-18, and to those aged 19 or older in their first year only.
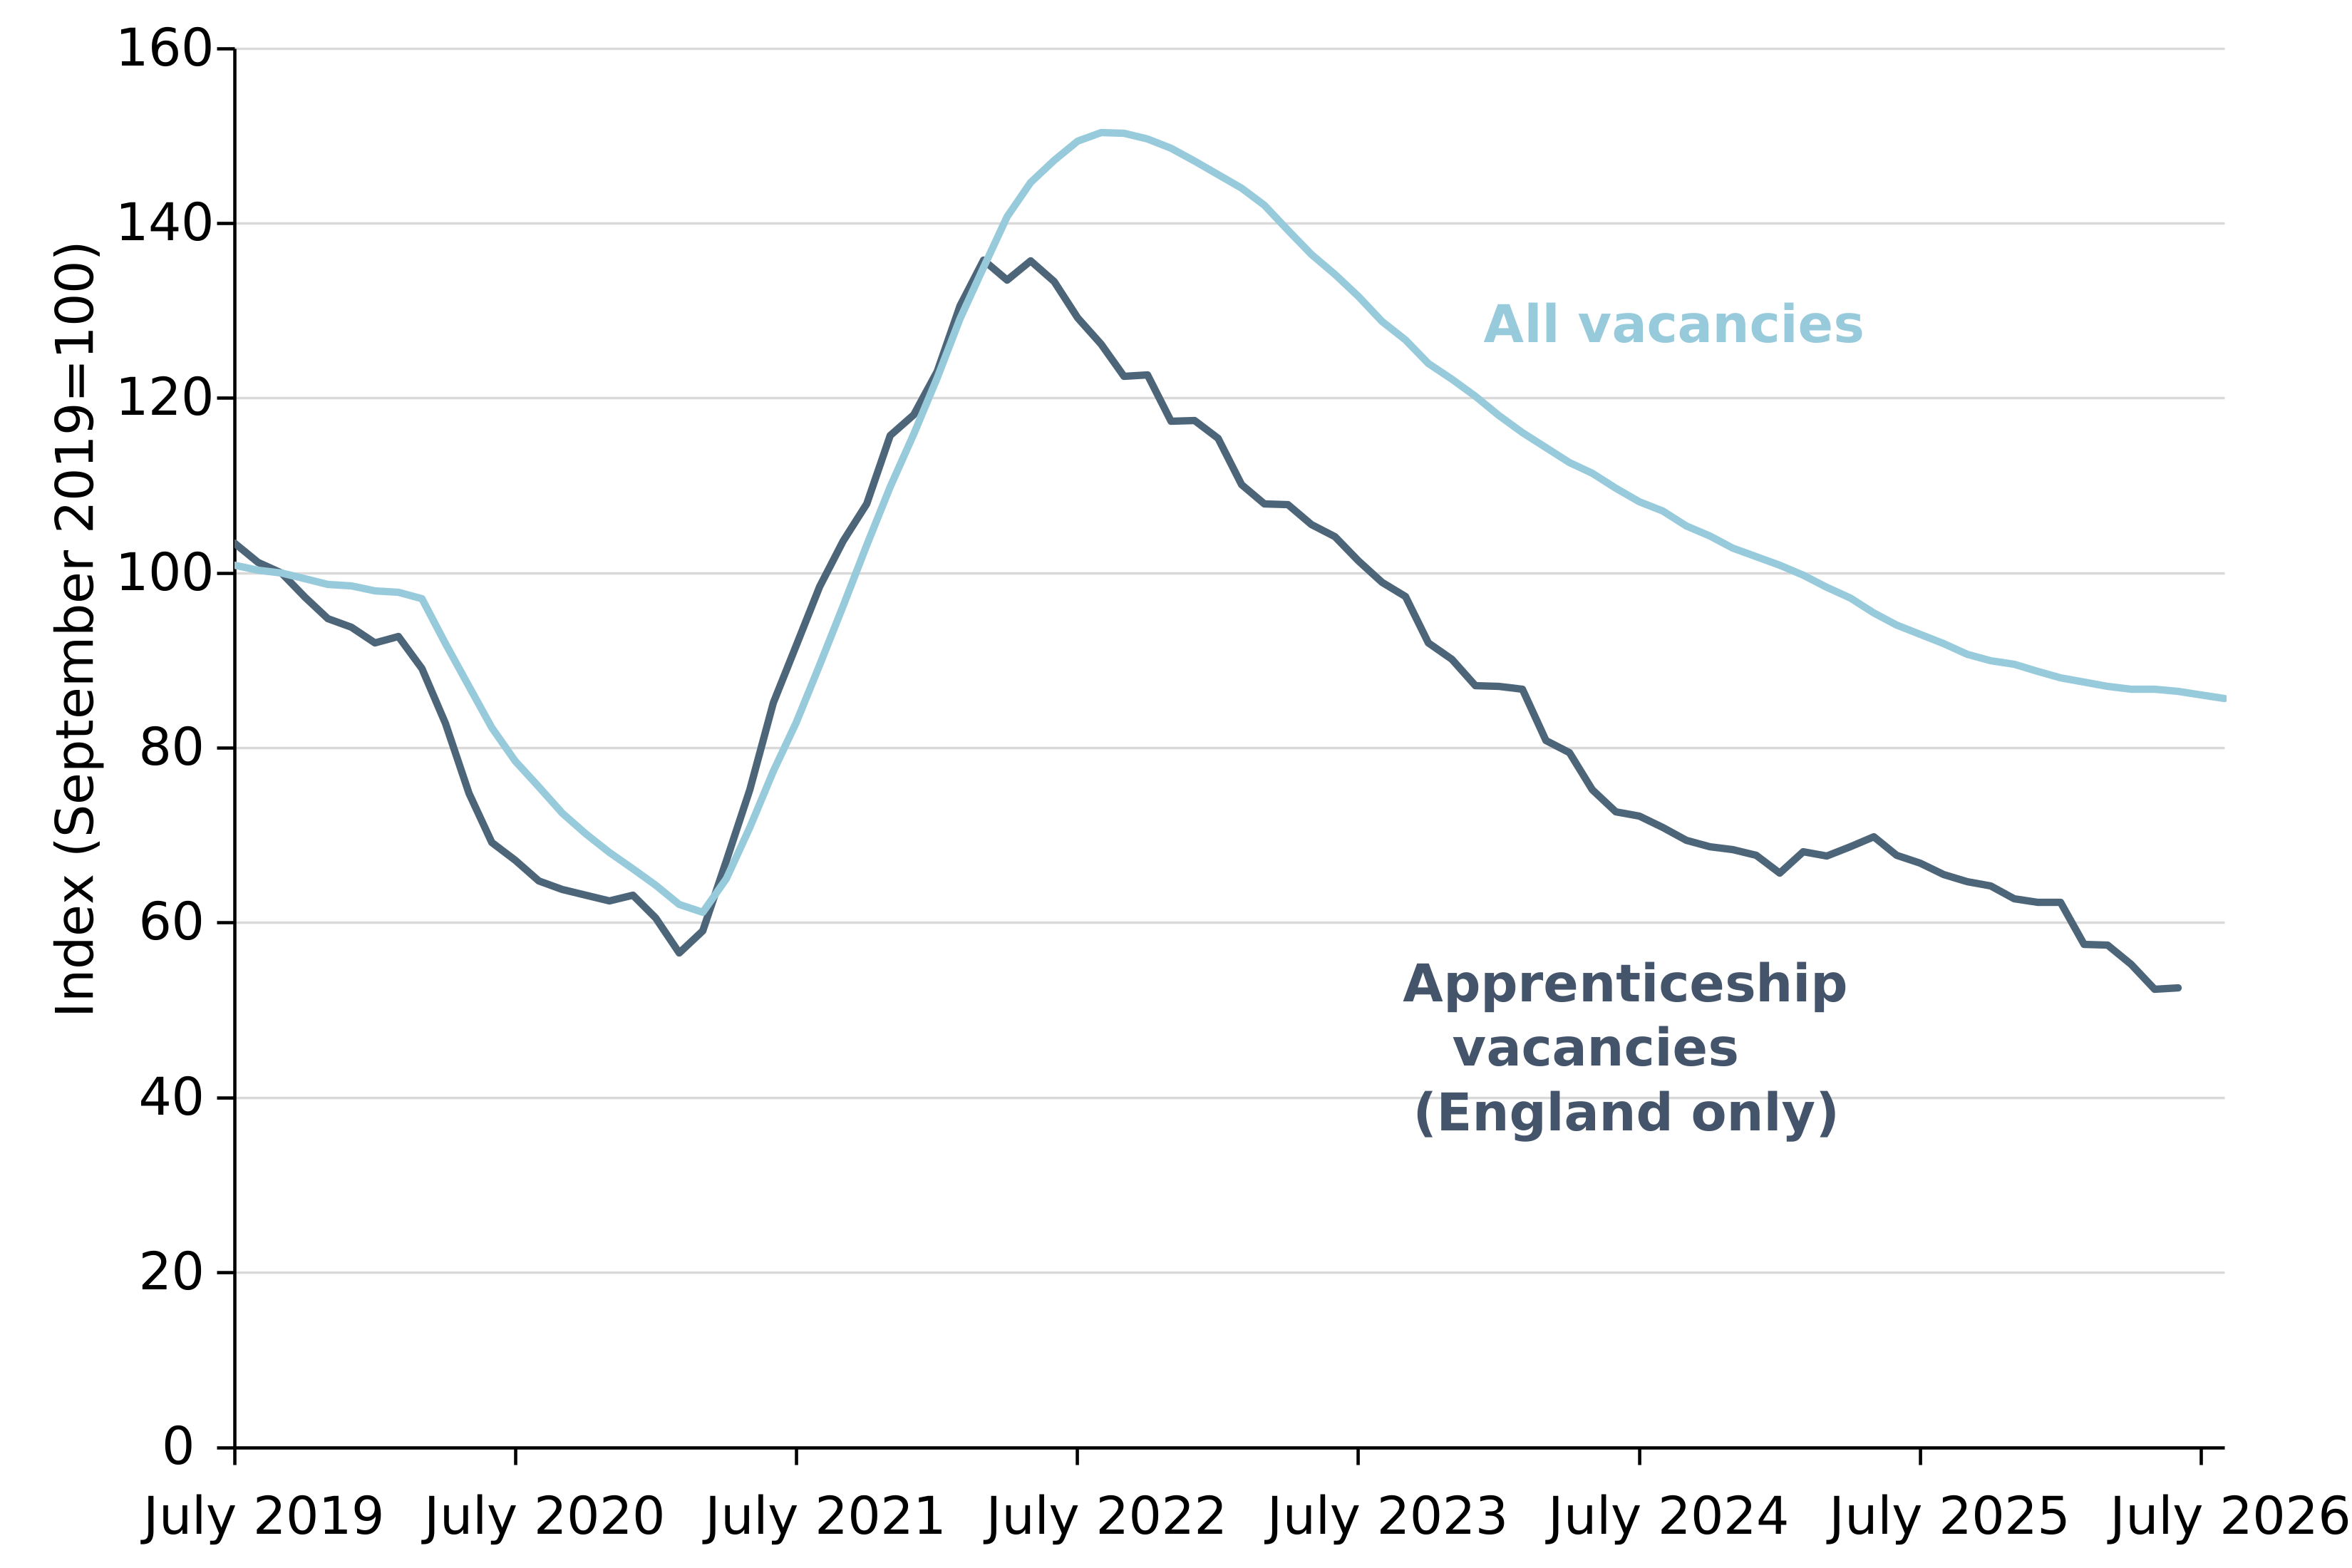
Apprentice vacancy numbers have declined faster than for all vacancies in the economy. Some employer stakeholders are concerned about how the cost of employing an apprentice has increased:
“Less apprentice places due to not only rate increases but the certainty of whether we can afford to keep/pay them when apprenticeship ends.” (CIPP)
Employee stakeholders argue that the level is inadequate. Balancing these viewpoints, we recommend an increase of 31p to £8.31 (3.9%).
For the Apprentice Rate this represents a substantially lower increase that we have recommended in recent years, and in our view supports their employment in line with our remit.
21.1 Vacancies relative to September 2019
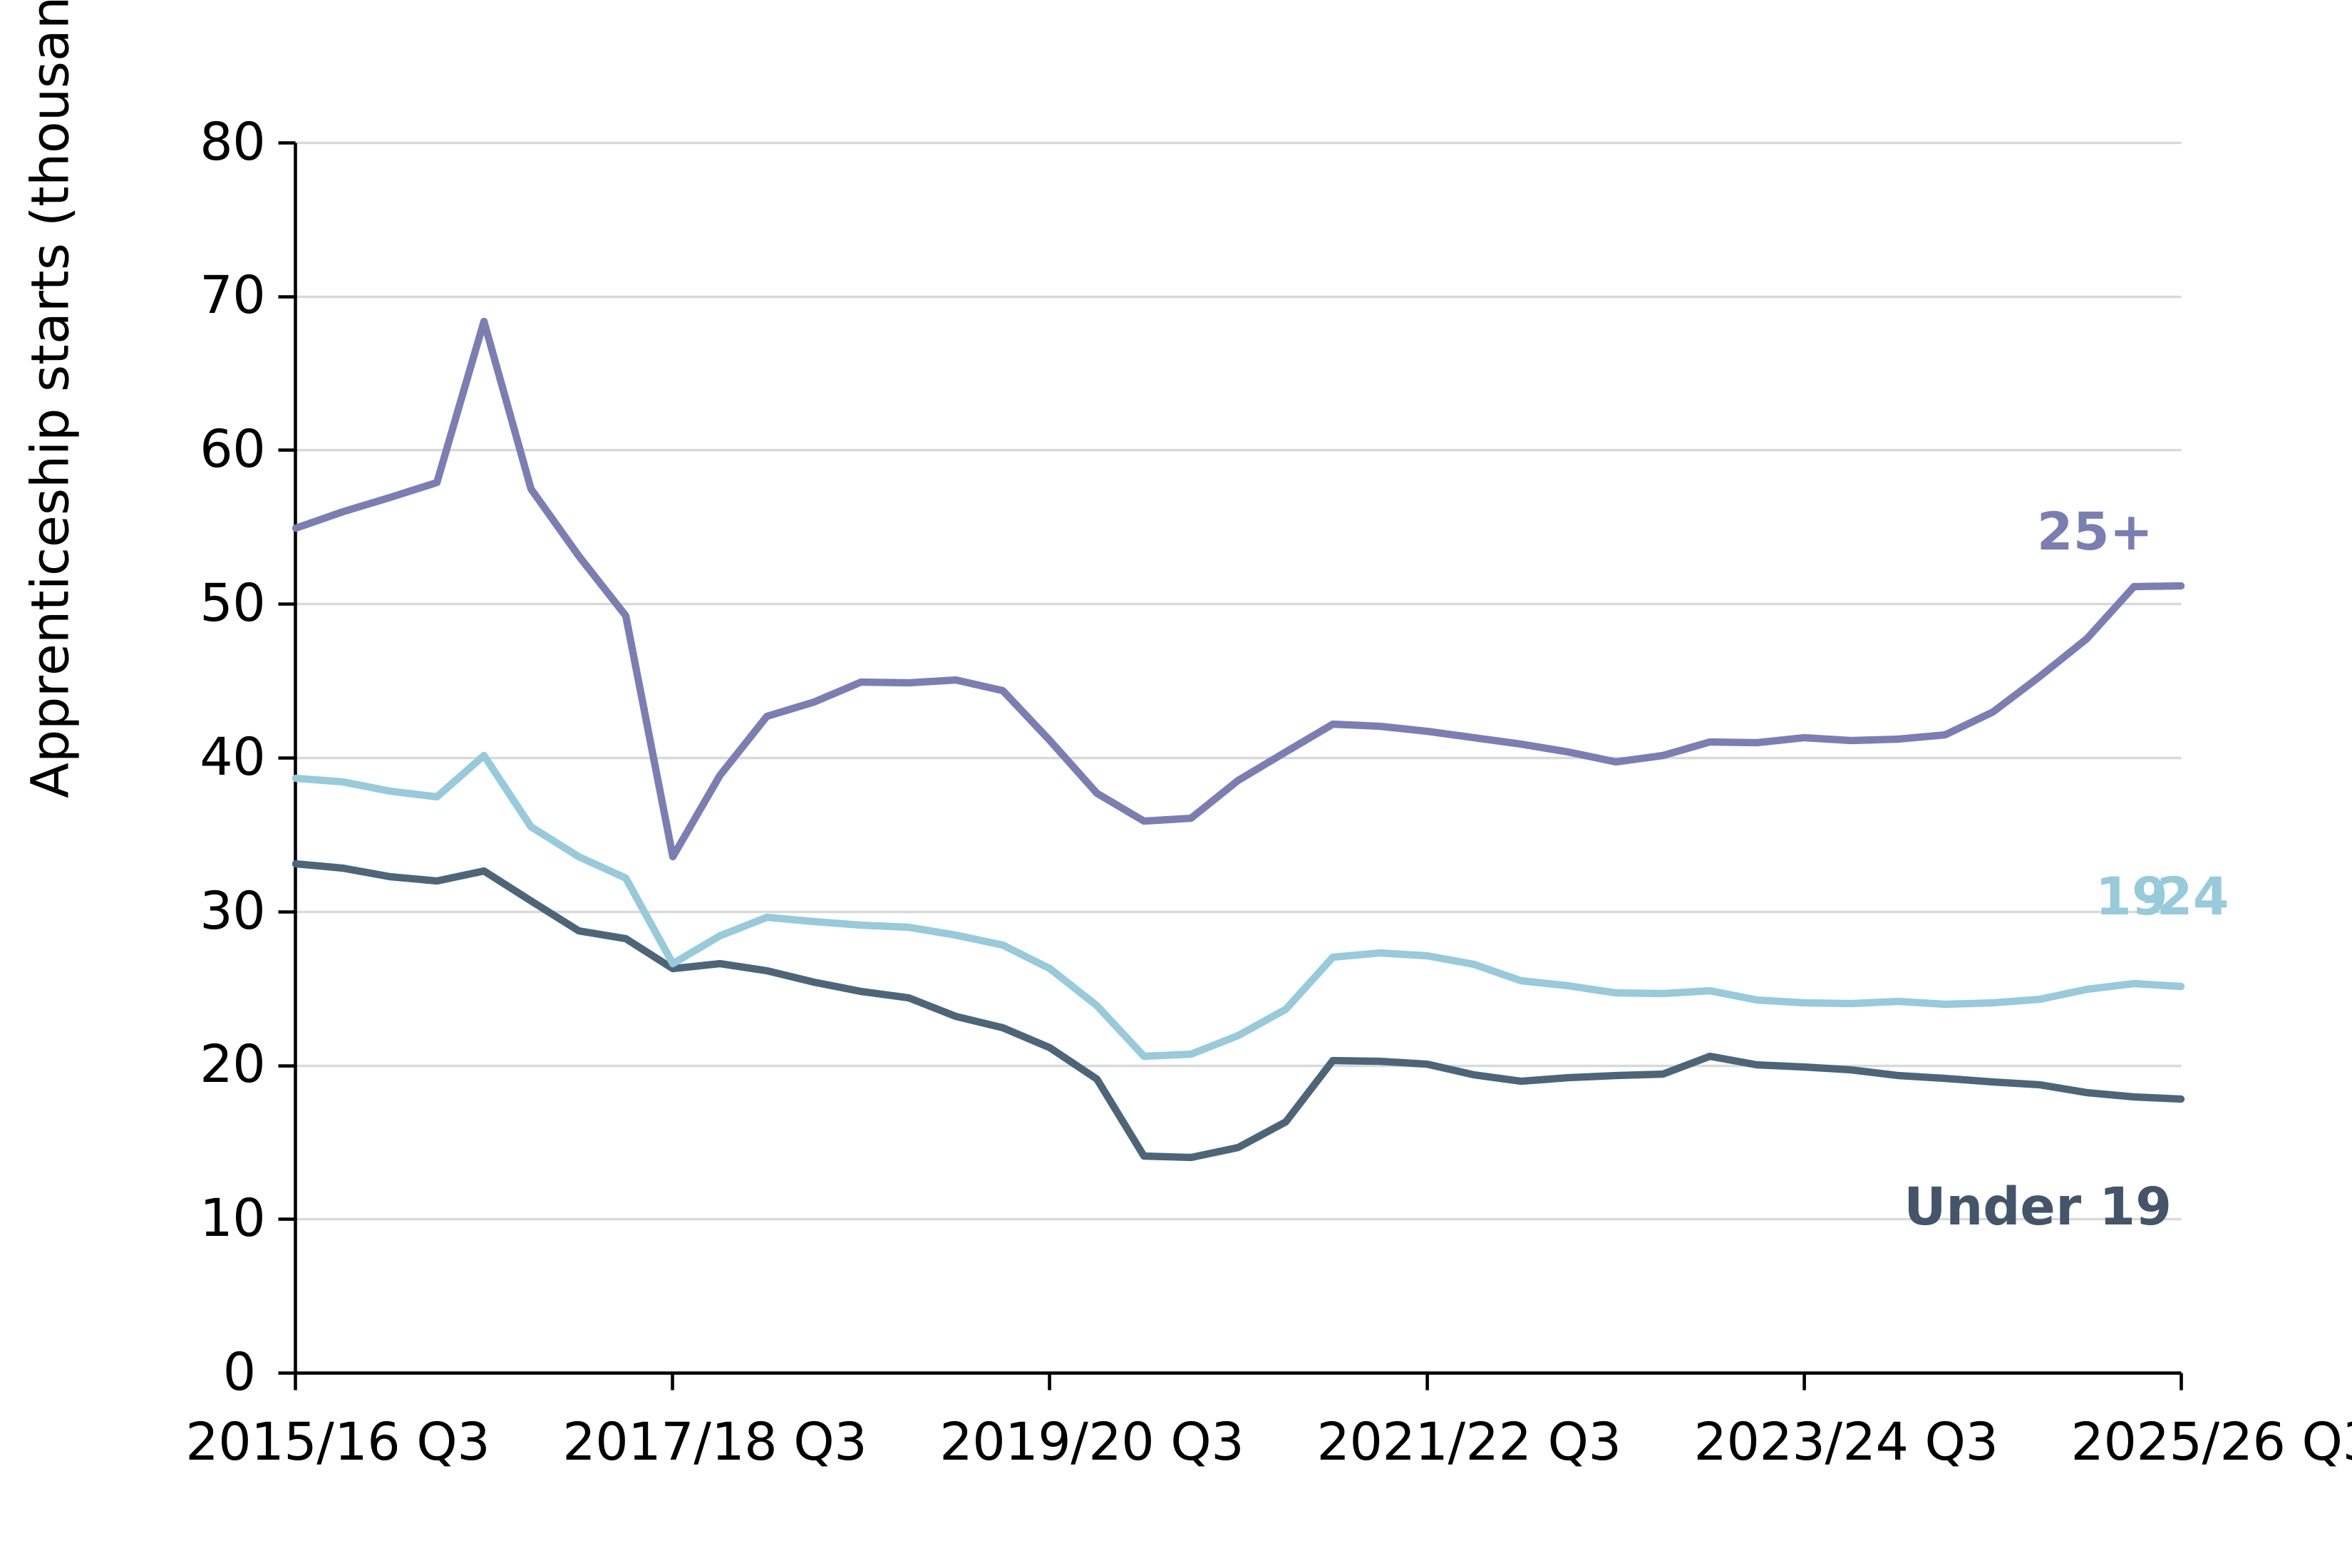
21.2 Apprenticeship starts by age, England
This page contains statistical data from ONS which is Crown Copyright. The use of the ONS statistical data in this work does not imply the endorsement of the ONS in relation to the interpretation or analysis of the statistical data. This work uses research datasets which may not exactly reproduce National Statistics aggregates.