Measuring the economic social and environmental value of public sector location data - Case Studies
Updated 22 August 2022

© Crown copyright 2022
This publication is licensed under the terms of the Open Government Licence v3.0 except where otherwise stated. To view this licence, visit nationalarchives.gov.uk/doc/open-government-licence/version/3 or write to the Information Policy Team, The National Archives, Kew, London TW9 4DU, or email: psi@nationalarchives.gov.uk.
Where we have identified any third party copyright information you will need to obtain permission from the copyright holders concerned.
This publication is available at https://www.gov.uk/government/publications/measuring-the-economic-social-and-environmental-value-of-public-sector-location-data/measuring-the-economic-social-and-environmental-value-of-public-sector-location-data-case-studies
This document shows how the logic model framework can be applied to previous geospatial interventions. As set out in the benefit appraisal guidance, only certain elements of each case study have been explored in detail.
The case studies provide an assessment of the Theory of Change models and the approaches used, exploring a diverse range of interventions, their impacts and the valuation methods, specific elements of which readers may find helpful to draw on.
The four case studies are:
-
National Underground Asset Register (NUAR): Development of a data-sharing platform to provide a combined, interactive, standardised digital view of the location and attributes of buried assets (such as pipes and cables). This investment addresses the legal, commercial, safety and security concerns expressed by owners of underground assets. These concerns have previously acted as a barrier to bringing together data in a consistent digital format.
-
HM Land Registry (HMLR) data valuation: HMLR wanted to quantify and evidence the value of its datasets to direct data consumers. This was motivated by an interest in demonstrating the impact of existing datasets and potentially exploring how releasing additional HMLR datasets could drive future economic growth. This model has been applied to four HMLR datasets.
-
Public Sector Geospatial Agreement (PSGA): Ordnance Survey (OS) provides enhanced location data, services and expertise to the public sector, developers and OS Partners. This has involved significant investments including the provision of improved data sets and facilitating more flexible access to granular data attributes. PSGA members access this data through a customer engagement platform (OS Data Hub).
-
Transport for London (TfL) open data: TfL released open information via APIs on timetables, service status and disruption which covers all modes of transport. This decision enables users of the transport network to easily access travel information both through TfL’s Go app, and other customer-facing products and applications created by multiple businesses who use TfL’s open data.
Case Study 1: NUAR
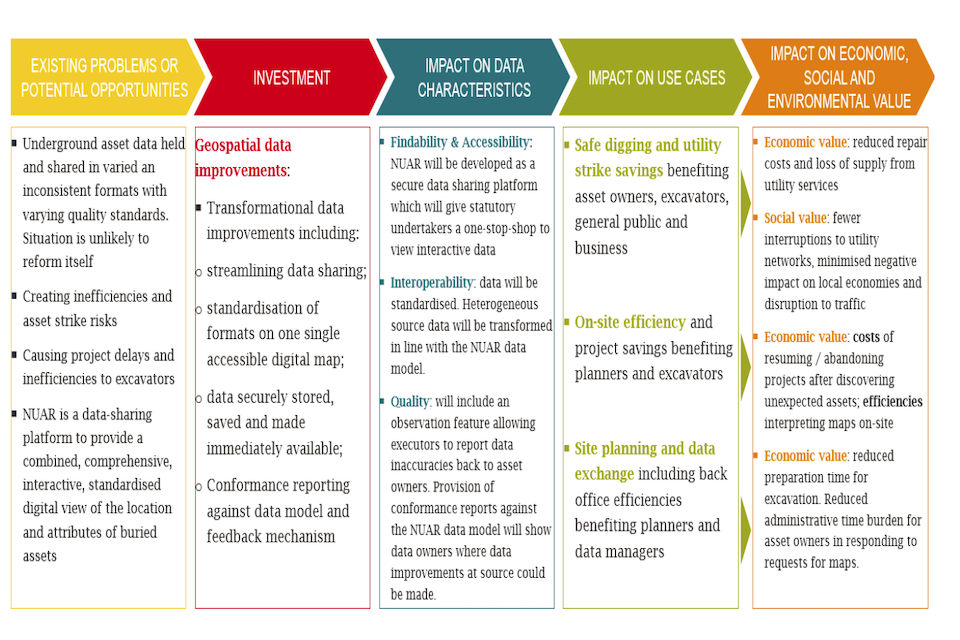
This figure sets out a specific theory of change for NUAR. This covers 5 stages (1) Existing problems or potential opportunities (2) Investment (3 )Impact on data characteristics (4) Impact on use cases (5) Impact on value
Source: Frontier based on qualitative engagement and literature review
Market Failures, problems and/or potential opportunities
Every construction and infrastructure project has to source information on buried utility assets such as cables, pipes, sewers and ducts when preparing ground investigation and excavation work. Planners and excavators need this data to carry out their jobs safely and efficiently.
Despite the importance of this information, underground asset data is currently held separately by approximately 650 organisations and shared in varied formats, at different scales, with varying degrees of quality. These inconsistencies make it challenging for all relevant underground asset data to be consistently brought together into a single plan on asset locations, increasing the risk of asset strikes with potentially lethal consequences as well as project delays, cost overruns, disruption to traffic and loss of services in local areas.
There is no case for any one asset owner, intermediary or statutory undertaker to individually invest in reform where many of the risks and costs will be felt by other organisations. In addition, securing access to some of the data is difficult given the presence of security and commercial sensitivities. In this case, government intervention is required as it is able to centrally coordinate activity and invest upfront in wholescale data transformation where there is clear evidence of value to the UK economy, and can also ensure appropriate safeguards are in place to address commercial and security concerns.
Investment
NUAR is a secure data sharing platform which facilitates shared access to underground asset data. In particular it provides digital records of underground assets (i.e. pipes and cables) in a combined, interactive, and standardised way in order to improve the efficiency and safety of underground works. Some of the improvements introduced with NUAR include:
- Streamlining the way data is shared between owners of underground assets and those undertaking construction work;
- Standardising data from 650+ asset owners across organisations and sectors into a single, interactive digital map;
- Making data readily available via secure centralised storage; and
- Providing conformance reporting against the NUAR data model and access to feedback from workers in the field.
This would cover: (1) Improving or maintaining existing geospatial datasets, (2) data sharing policy, (3) tools and system improvements.
Impact on data characteristics
Accessibility: NUAR will be developed as a secure data sharing platform which will give individuals and organisations legally defined as statutory undertakers a one-stop-shop to view interactive underground asset data.
Interoperability: The NUAR programme involves a Data Transformation phase where data will be standardised on behalf of Asset owners in line with the NUAR data model. Asset owners work collaboratively alongside the Geospatial Commission. Standardisation of data (based on OGC MUDDI) will improve the interoperability of the system.
Quality: The process intends to provide a bespoke conformance report to each asset owner outlining to what degree their data will conform to the standard required for NUAR. This will cover characteristics such as completeness (of data and metadata, e.g. about depth, data quality measures, accuracy metadata), domain conformance (conformance of values to agreed standardised categories), data currency. This data processing will lead to direct quality improvements.
Use cases
NUAR presents 3 clearly defined anticipated (known) use cases:
-
Safe digging and utility strike savings benefiting asset owners, excavators, general public and business. Excavators need to identify all possible underground assets so that users can dig safely without striking an underground buried asset. NUAR will allow for this identification to a greater degree of accuracy than was the case previously, thanks to better data.
-
On-site efficiency and project savings benefiting planners and excavators. Excavators need to identify underground asset data in a single integrated way so that workers can easily and efficiently orientate themselves on site. NUAR will enable this orientation to happen faster
-
Back office and data exchange savings benefiting planners and data managers. Project planners need to identify the location and agreed attributes of all underground infrastructure assets so that accurate and comprehensive plans can be made. At the same time, asset owners need to share underground asset data through a central platform so that asset owners can send and respond to data requests without maintaining their own data response systems. NUAR will provide this central platform.
Value of use cases
The value of use cases is based on the estimated benefits from each of the use cases explained above:
-
Economic value generated from reduced repair costs and loss of supply from utility services and social value derived from fewer interruptions to utility networks, minimised negative impact on local economies and disruption to traffic.
-
Economic value derived from on-site efficiency improvements for projects derived from reduced costs of resuming / abandoning projects after discovering unexpected assets, and efficiencies around interpreting maps on-site and environmental value from fewer wasted materials.
-
Economic value derived from reduced costs of sharing data, reducing the administrative time burden for asset owners in responding to requests for maps, and reduced preparation time for excavation.
Valuation methods
A use case approach was taken to quantitatively value this intervention (including both direct and indirect impacts). This was accompanied by consideration of wider benefits in a qualitative way. A conservative estimate of the benefits of a national approach to digitalising underground asset data calculates £30 worth of benefits for every £1 invested and the estimated total monetised benefit of the NUAR programme is £3.4bn, which is £347m per year over ten years. The benefits derived from each use case were estimated separately.
Table 1: Assessment of NUAR benefits
| Assessment type | Use case | Methodology and estimated value |
|---|---|---|
| Quantitative assessment of direct benefits | Utility strike savings | 1)Academic research was used to identify (1) the average costs of a strike (£3,371); and (2) the number of strikes a year (60,000 reported industry strikes on buried service pipes and cables per year), 2)It was assumed that 30% of strikes could be reduced through the use of better data and better access to it. This assumption was based on the results from a survey indicating that 30% incidents were linked to inadequate plans and on-site procedures for using data, 3)As a result, the intervention would be able to reduce the direct economic costs of utility strikes such as repair costs and costs of traffic disruption by approximately £12 million |
| Quantitative assessment of direct benefits | On-site project efficiencies | 1)Evidence was collected from stakeholder engagement, desk research, market level statistics and evidence from pilot phase, 2)Resumption costs were estimated to be approximately £91 million pa. Large project resumption cost savings were estimated from a user interview example whereas small project resumption cost savings were assumed to be equivalent to the labour and equipment costs of a 2-day replanning and re-surveying delay. 3)Potential abandonment costs savings were estimated to be around £3 million per annum based on incident rate and cost estimates from user interviews. 4)Total field efficiency savings derived from better orientation of maps on site were estimated to be around £27 million based on market trade rates for site projects and time savings estimates from the Pilot Phase findings. 5)Across these 3 areas, it was assumed that the data platform would be able to resolve approximately 56% of incidents, based on the current application of map data on projects. |
| Quantitative assessment of direct benefits | Data exchange and back-office efficiency savings | 1)A survey was undertaken involving 84 stakeholders including highways authorities, utility asset owners, other infrastructure asset owners and contractors. The survey was aimed at quantifying and identifying key time and cost drivers in the data seeking and data responding process (i.e. understanding the detailed process involved in requesting, collating and preparing underground asset data and how NUAR could make it more efficient). 2)The results from the survey were averaged, scaled up using national statistics and sense checked with supporting evidence from other projects and insights from the pilot phase, giving an estimate of approximately £91 million per annum. |
| Quantitative assessment of direct benefits | On-site project efficiencies | 1)The economic value for better subsurface management has not been quantified but qualitatively described because it requires additional dependencies that are not within the restricted scope of the program. 2)The environmental value from fewer wasted materials (e.g. from abandoned projects) was not quantified but qualitatively discussed |
| Quantitative assessment of indirect benefits | Utility strike savings | Quantitative assessment: Most of the savings from reduced utility strikes were indirect such as costs to local businesses or higher insurance premiums (i.e. total reduction costs were estimated to be £347 million per year, of which only £12 million were direct costs savings). The indirect costs were calculated by applying the direct to indirect cost ratio 1:29, as suggested in by the literature |
| Quantitative assessment of indirect benefits | On-site project efficiencies | Quantitative assessment: for resumption costs, in addition to the direct cost reduction, for small project resumptions a small non-direct cost multiplier was applied (1:7). Larger projects are likely to be isolated with fewer traffic disruptions, so the non-direct cost multiplier was conservatively excluded. |
Source: Frontier based on literature review and qualitative engagement.
This project used the best available evidence sources and collected new primary evidence to fill gaps. A number of sensitivity tests were carried out to understand how the benefits change under different assumptions. In all of the scenarios tested, the NUAR programme represents good value for money.
The benefits were then adjusted to account for optimism bias consistent with HM Treasury Green Book guidance.
Case Study 2: HM Land Registry
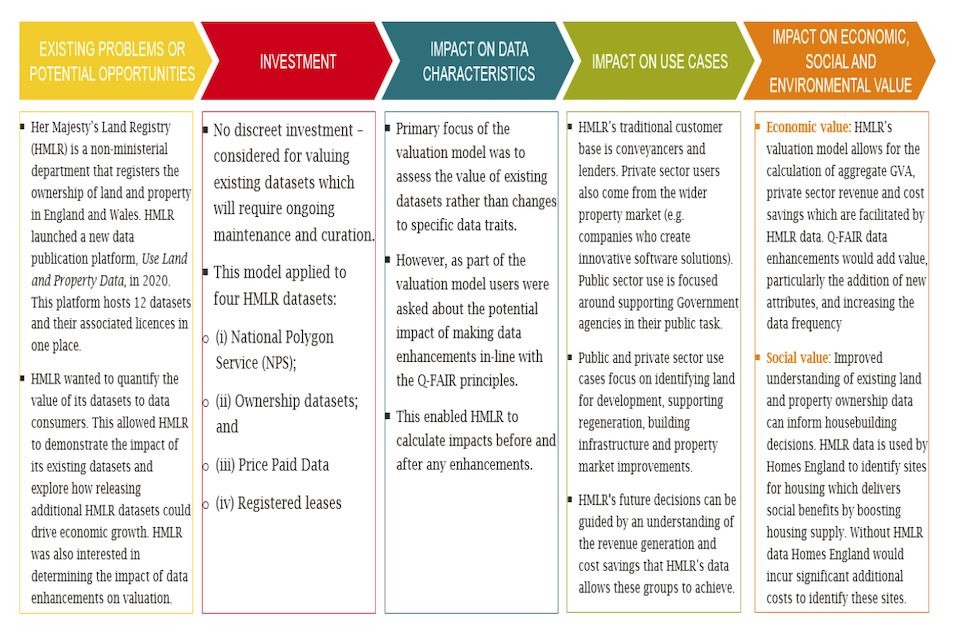
This figure sets out a specific theory of change for HMLR's data valuation mode.This covers 5 stages (1) Existing problems or potential opportunities (2) Investment (3 )Impact on data characteristics (4) Impact on use cases (5) Impact on value
Source: Frontier based on qualitative engagement and literature review
HMLR is a non-ministerial department that registers the ownership of land and property in England and Wales. The Land Register now contains more than 26 million titles, providing ownership guarantees for 88% of land in England and Wales.
HMLR launched a new data publication platform, Use Land and Property Data, in March 2020. This platform hosts 12 datasets and their associated licences in one place for the first time. The service improves accessibility with users being able to easily discover everything that is available, view the terms of use of the datasets upfront and be led through a simplified sign up and account management process. It also provides the option of seamless access to the data through an application programming interface (API) allowing automatic download of many of the datasets.
Market Failures, problems and/or potential opportunities
HMLR wanted to quantify and evidence the value of its datasets to direct data consumers. This was motivated by an interest in demonstrating the impact of its existing datasets and potentially exploring how releasing additional HMLR datasets could drive future economic growth. In addition, HMLR was interested in determining the impact that implementation of planned data enhancements based on FAIR principles would have on the dataset(s) valuation.
Investment
HMLR was considering valuing its existing datasets which will require ongoing maintenance and curation. Its valuation model was initially applied to four HMLR datasets:
- National Polygon Service (NPS);
- Ownership datasets;
- Price Paid Data; and
- Registered leases.
It is expected to be applied to other datasets in the future. This would cover improving or maintaining existing datasets.
Impact on data characteristics
The primary focus of the valuation model was to assess the value of existing datasets rather than changes to specific data traits. However, as part of the valuation model users were asked about the potential impact of making data enhancements in-line with the Q-FAIR principles. These impacts were considered in terms of revenue generation and costs savings. This enabled HMLR to calculate impacts before and after any enhancements.
Use cases
HMLR’s traditional customer base is conveyancers and lenders. However private sector users come from the wider property market including companies who create innovative products, services and software solutions. Public sector use is focused around supporting Government agencies in their public tasks and the delivery of services.
Both public and private sector use cases have a strong focus around identifying land for development, supporting regeneration, building of key infrastructure and property market improvements. HMLR data is used to combat fraud and property crime, for academic research and by a range of property professionals and key decision makers.
HMLR data is also used by Homes England, for example in helping the agency to identify potential sites for new housing and supporting a number of business critical processes. The supply of HMLR data is a great asset to the agency and without HMLR data, Homes England would incur significant additional time and resource costs to deliver the same outcomes.
Some of HMLR’s datasets also provide detailed information on individual properties, which helps buyers and sellers to have more symmetric information at the point of transaction. This creates a more efficient market, and the value of information symmetry can be significant.
Other uses cases for HMLR data have emerged as more datasets have been released, for example:
-
Research and analysis: using cutting edge technology, organisations are able to use HMLR data alongside that of other providers to give a combined view of property data including markets, land ownership, planning and policy.
-
Digital innovation: PropTech companies are revolutionising the property industry with new products and services including the creation of apps, online platforms and using artificial intelligence to extract key property data. Use cases include minimising risks within the conveyancing process for due diligence, helping home owners to free up capital with faster property sales, enabling unfinanced land owners to develop sites and bringing investors and aspiring homeowners together to help people get on the property ladder.
HMLR’s future decisions can be guided by an understanding of the revenue generation and cost savings that HMLR’s data allows these different groups to achieve.
Value of use cases
To value the benefits associated with its datasets, HMLR worked with a consultancy firm on the project to design a data valuation approach. This included collaboration across HMLR with various teams coming together including Product, Analysis, and Economists.
The valuation model created was excel-based. It requires the input of information which is a mix of desk-based research, internal knowledge about HMLR users, and working with HMLR’s key stakeholder customers.
The model focuses on economic benefits facilitated by HMLR data. In particular, it provides three outputs presented in the Table below.
Table 2 - Composition of HMLR Model
| Output | Definition | Formula |
|---|---|---|
| Revenue generation (RG) | Estimated revenue generated by UK private sector organisations as a result of dataset(s) usage (private sector only) | RG = SIC revenue * Revenue related to data * Business relevance factor * Business dependency rating * Adoption rate |
| Approximate Gross Value Added (aGVA) / GVA | Estimated gross value added by UK private sector organisations as a result of dataset(s) usage | GVA = Industry aGVA * Revenue potentially related data * Business relevance factor * Business dependency rating * adoption rate |
| Cost savings | Estimated potential staff cost savings by UK private and public sector organisations as a result of dataset(s) usage | Cost savings = Staff costs * Staff related to data * Business relevance factor * Business dependency rating * Efficiency rating |
Source: Frontier based on HMLR documents
Note: Please see table below for relevant definitions on HMLR dataset valuation inputs
In each case this approach represents a form of full use case valuation and data attribution. In other words, total use case value was calculated in a top-down way from industry revenue/GVA and then adjustments made to reflect the contribution of data to the use case.
Table 3: Selected Inputs to HMLR dataset valuation
| Metric | Description |
|---|---|
| SIC revenue | The turnover of the particular SIC code category |
| Business dependency rating (%) | Rating based on the proportion of value that is dependent on understanding property boundaries (%) |
| Business activity relevance factor (%) | Proportion of business activity potentially related to the dataset. It is recognised that prior to external engagement with data consumers, it is hard to assess the true proportion of revenue that is attributable or related to a HMLR dataset |
| Adoption rate (%) | The estimated number of companies in each industry that currently use the dataset |
| Efficiency rating (%) | A percentage applied to reflect the inefficiencies experienced by staff potentially related to Ownership dataset, should the dataset be unavailable |
Overall the analysis found that Q-FAIR data enhancements would add value, particularly the addition of new data attributes and increasing the frequency of data updates but mainly having the ability to draw down the relevant amount of data as and when needed (transactional access) rather than downloading complete datasets every month.
Case Study 3: Public Sector Geospatial Agreement (PSGA)
This figure sets out a specific theory of change for TfL’s Open Data Initiative.This covers 5 stages (1) Existing problems or potential opportunities (2) Investment (3 )Impact on data characteristics (4) Impact on use cases (5) Impact on value
Source: Frontier based on qualitative engagement and literature review
Market Failures, problems and/or potential opportunities
During 2016, an extensive user engagement process was carried out which highlighted that OS products and services did not fully meet their expected future requirements. A major opportunity to improve access to high quality OS data was identified. Specific drivers for change included:
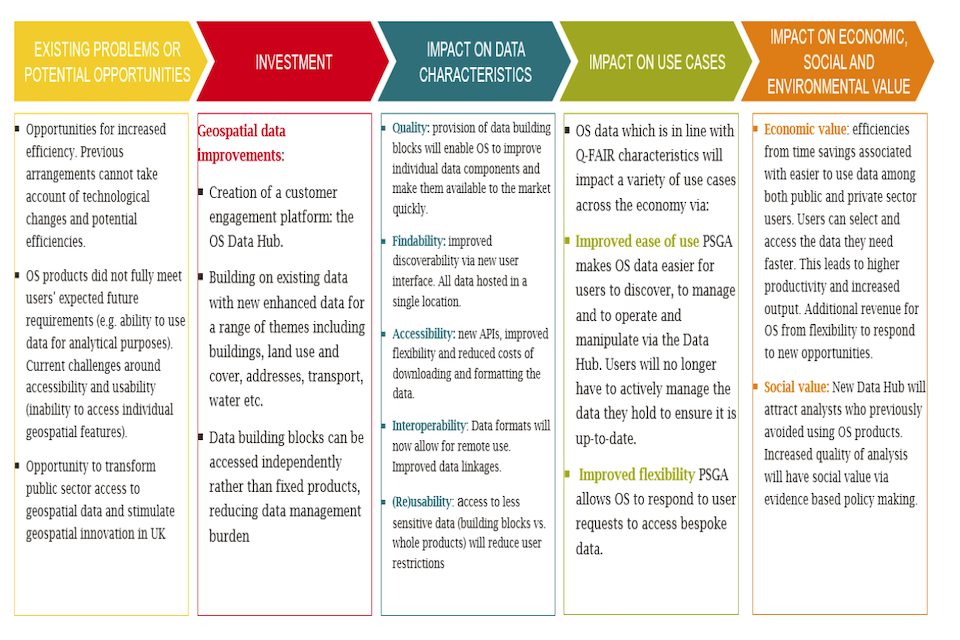
- Opportunities for increased efficiency (i.e. the old PSMA could not take account of technological changes and efficiencies).
- Opportunities to transform public sector access to geospatial data and stimulate geospatial innovation in the UK.
- Challenges around accessibility and usability (inability to access individual geospatial features) which, if addressed, could introduce efficiency gains, better quality of analysis and increased use of OS data. In particular:
Users were required to download, host, and manage OS datasets resulting in significant resource expense at a time when many public sector users were scaling back geographic information system (GIS) resources.
Users could not readily access OS data offline without incurring significant investment costs to build their own services, preventing user cases requiring field work.
OS data was not in the correct format, requiring users to spend resources modifying the data.
Users found it difficult to access only the OS data that is relevant to them in its current product form, leading to additional resources required to remove unwanted data.
Investment
The Public Sector Geospatial Agreement is a collective purchase licensing arrangement that sets out how the OS provides world-leading location expertise to the public sector, developers and OS Partners across Britain to support the delivery of critical infrastructure and services. The key objectives of the PSGA are as follows:
-
Transform public sector access and use of geospatial data, providing the public sector with better access to world leading geospatial data to underpin the delivery of effective and efficient public services.
-
Build the world-leading geospatial asset and capability, ensuring that the UK’s Crown geospatial asset continues to be world leading in terms of its accuracy, currency, and content to support emerging technologies.
-
Stimulate geospatial innovation in UK markets, stimulating increased competition and opportunities for economic growth within the wider UK markets that are underpinned by geospatial data to develop new products and services.
-
Increase government’s direct policy oversight of OS - Provide for direct policy oversight of the OS public task through direct funding and contract management allowing maximisation of the OS capability.
One of the key improvements introduced by the PSGA is the move away from fixed specification products to the licensing of the individual componentized building bricks of data, with access to the data for PSGA members enabled through the OS Data Hub (which was funded as part of separate agreement to the PSGA), Ordnance Survey’s new customer engagement platform. For the purpose of this guidance we are focusing on these deliverables since it impacts a wide range of data characteristics and unlocks different sets of use cases.
This covers (1) Improving or maintaining existing geospatial datasets, (2) Data sharing policy, (3) Tools and systems improvements.
Other deliverables within PSGA include open data, new APIs, opening of key identifiers under an Open Government Licence, new datasets and other investments in processes in capabilities to meet future market needs (these would be classed as ‘Other Ecosystem Interventions’) are equally important, but not the chosen focus for this case study example
Impact on data characteristics
The changes introduced under the PSGA support increased:
-
Quality: provision of data building blocks will enable OS to improve individual data components and make them available to the market quickly.
-
Findability: improved discoverability via new user interface and all data hosted in a single location.
-
Accessibility: through new APIs, improved flexibility and reduced costs of downloading and formatting the data.
-
Interoperability: thanks to better data formats which will now allow for remote use and improved data linkages between important national and local government datasets.
-
(Re)usability: access to less sensitive data (building blocks vs. whole products) will reduce user restrictions.
Use cases
OS data which is in line with Q-FAIR characteristics will impact a variety of use cases across the economy (e.g. efficient transport systems, effective citizen services, environmental monitoring) via: (i) improved ease of use: PSGA makes OS data easier for users to discover, to manage and to operate and manipulate via the Data Hub. Users will no longer have to actively manage the data they hold to ensure it is up-todate; and (ii) Improved flexibility: PSGA allows OS to respond to user requests to access bespoke data.
Value of use cases
Economic value: Accessing the data building bricks, rather than the fixed specification products, offers the greatest level of flexibility and ease of use for both the public and private sector. It also offers greater opportunities for innovation and increased competition within the market at the end user level, by reducing the costs of access to the private sector by allowing them to access only the data content they require for their particular application rather than having to purchase, store, and manage the elements within the existing products they do not require. The reduction in the data management burden is also replicated within the public sector, thereby delivering efficiencies in terms of reduced storage and processing costs, as well as time savings. Other economic benefits are associated with additional revenue for OS from flexibility to respond to new opportunities.
Social value: the new Data Hub will attract analysts who previously avoided using OS products and the increased quality of analysis will have social value via evidence-based policy making.
Environmental value: the new data content provided in the contest of PSGA has some indirect environmental benefits such as better reporting on carbon targets and more accurate environmental impact assessments.
Valuation methods
The benefit appraisal included quantitative analysis supplemented by evidence-based qualitative assessments where monetised impacts could not be accurately estimated.
In the appraisal stage, direct, indirect and spill-over benefits were identified. The OS Data Hub is expected to generate direct benefits to private and public sector users of OS data as a result of improved ease of use of OS data; and benefits to private and public sector users of OS data, and to OS, associated with OS’s improved flexibility in responding to bespoke data requests from users.
Wider benefits to the economy and society as a result of OS Data Hub were not monetised in this business case. Other benefits that were unable to be monetised due to a lack of robust evidence on which to base an accurate quantification include: direct benefits accruing to new users of OS data and products and indirect benefits resulting from some identified use cases or from future use cases which are currently unidentified but are expected to result from dynamic changes in the way data is used. A summary of the methods used for the assessment of benefits are presented in the table below.
Table 4: Assessment of PSGA benefits
| Assessment type | Use case | Methodology and estimated value |
|---|---|---|
| Quantitative assessment of direct benefits | Improved ease of use | 1)Economic benefits are estimated based on the WTP for improved “ease of access” and “frequency of data” from prior research and the total WTP of the new data content under PSGA. 2)Applying WTP extracted from prior analytical research to estimated WTP for total content under PSGA. 3)Results corroborated from OS user engagement |
| Quantitative assessment of direct benefits | Improved flexibility | 1) Exercise undertaken by OS to identify instances where a lack of flexibility resulted in lost opportunities or opportunities being delivered less efficiently. 2)Identification of revenue value of opportunity; consumer surplus to revenue ratio; delay to delivery and impact on costs; and whether the opportunity was subsequently delivered in the market |
| Quantitative assessment of direct benefits | Improved ease of use | 1)Efficiencies (time and cost savings) 2)Higher quality analysis (easy access to relevant and up to date data) 3)New use cases (innovation opportunities) |
| Quantitative assessment of direct benefits | Improved flexibility | 1)Additional revenue to OS: responding to more user requests 2)Lower costs to OS: more efficient response to requests 3)Users benefiting from additional and more timely data 4) Improved quality of geospatial analysis |
| Assessment of indirect benefits | Improved ease of use, improved flexibility and new data content | Quantitative assessment: for some use cases, when data is available: 1) assessment of existing evidence and user engagement around types of impacts that arise with the use of geospatial data; 2) estimation of overall impact of geospatial data and contribution of OS data; 3) estimation of incremental indirect impact of PSGA including new content and improved ease of use; 4) estimation of baseline impact Qualitative assessment: Assessment of indirect benefits associated with different use cases of OS data through extensive OS user research (e.g. resilience to major crime incidents, faster ambulance response times, resilience to natural hazards) |
Source: Frontier based on literature review and qualitative engagement
Case Study 4: TFL open data initiative
Source: Frontier based on qualitative engagement and literature review
Market Failures, problems and/or potential opportunities
Transport for London (TfL) operates the public transport network in London, including the London Underground, Buses, the Docklands Light Rail (DLR), the Overground and major roads. As London’s population has grown the demand for public transport has increased and the importance of having up to date, reliable information available to users is crucial to improve journey planning, save commuting time and avoid congestion.
TfL made the decision to open up the transport data they hold as part of a wider digital drive by TfL that involves producing, acquiring, analysing, linking, sharing and using data to improve services and keep customers and staff better informed. Improving access to a range of information on the transport network (see detail below) clearly presented a major opportunity to improve awareness and allow individuals to make better decisions. However, TfL have noted retrospectively that the business case for open data was hard to model as “you could not prove in advance what making the data open was going to lead to”. This highlights the importance of unknown use cases which may unlock economic, social and environmental value, but are difficult to predict in advance and partially rely on external factors (e.g. how user smartphone adoption would evolve over time)
Investment
TfL decided to release information on timetables, service status, live arrivals, disruptions, air quality and accessibility in an open format, available for use by registered users. Data was made available under a version of the Open Government License so it could be used for commercial and non-commercial purposes including application developers who were seeking to package travel information in an accessible way for individuals. TfL has since invested in the TfL Go app to provide a more direct relationship and service to customers.
This covers: (1) Data sharing policy, (2) Tools and system improvements, (3) Other ecosystem interventions.
Impact on Q-FAIR characteristics
Quality: The quality engagement from partners and data users has created a feedback loop that has encouraged improvements to TfL’s data quality.
Accessibility: Increased accessibility as a result of open data policy and a unified API, providing easier access to a wider range of users.
Interoperability: Single unified API provides data into a common format and structure, reducing processing requirements and facilitating joinability
(Re)usability: Data is made available under a version of the Open Government Licence which means that the data can be (re)used and (re)shared for both commercial and non-commercial purposes.
Use cases
TfL’s open data has been used by businesses such as Waze, Google or Apple as well as academics and professional developers to partner up with TfL and use the data to create customer-facing products and services (e.g. apps) to improve the travel experience in the short and long term. This usage benefits TfL passengers who enjoy a better travel experience and also generates insights which can stimulate innovation / new ways of thinking at TfL.
Value of use cases
Economic value
TfL has been able to expand its customer reach and earn a reputation as a leader in open and transparent data and the digital economy. These benefits are more difficult to monetise directly. As of April 2022, TfL reported circa 10,000 registered Unified API users.
Passengers have benefited from saved time thanks to better information that improved their journey planning. Moreover, they have experienced cost savings since they no longer need to subscribe to paid services which flagged disruptions.
Companies using TfL data commercially generate revenue and GVA for the London economy, improving productivity, fostering innovation and creating direct and indirect jobs in London and the UK. Feedback loops on issues reported by companies are prioritised and fixed more urgently, supporting the development of open data innovation.
Environmental value:: data on roadworks can feed into Sat Navs and allow drivers to avoid congestion and reduce emissions.
Social value: Passengers plan their journeys better which leads to increased satisfaction. Access to accurate information (e.g. bus or rail disruptions) can allow individuals to engage in socially beneficial modes of transport such as walking or cycling in some cases. TfL routinely uses third party developers to help expand their reach and have since created the TfL Go app that provides more complete information to customers to better plan their journey e.g. station accessibility information.
Valuation methods
In order to estimate the benefits of TfL’s data, Deloitte considered the cost savings and incremental value to Passengers, London and TfL itself. They followed four steps to conduct their estimation:
- Literature review and TfL data collection
- Identification of relevant data inputs and mapping inputs to outputs (i.e. apps and other products reliant on open data)
- Wider data collection including proxy prices and triangulation as well as identification of key stakeholders or user archetypes
- Developing, testing, running and refining the model
Table 5 - Assessment of TFL benefits
| Assessment type | Use case | Methodology and estimated value |
|---|---|---|
| Quantitative assessment of direct benefits | Benefits to passengers | 1)TfL open data supports 42% of travel apps and real-time alerts used by Londoners is saving £70m-£95m pa in saved time, reduced uncertainty and lower information costs.2)Time savings were estimated at between £70m-£90m pa;3)Savings from moving away from SMS alerts were estimated to worth £2m pa; and 4)The value of new real time alert services is worth over £3m pa. |
| Quantitative assessment of direct benefits | Benefits to TfL | Open data has also unlocked new revenue and saving opportunities for TfL around not having to produce apps in-house and not having to invest in campaigns and systems (estimated to be around £0.75m – £1.5m annually). |
| Quantitative assessment of direct benefits | Benefits to passengers | Other benefits were qualitatively discussed such as improved customer satisfaction and healthier lifestyles |
| Quantitative assessment of direct benefits | Benefits to TfL | TfL has also benefited from its relationship with partner companies, through which has received significant and useful data |
| Assessment of indirect benefits | Benefits to London economy | Quantitative assessment: The release of open data by TfL has supported the growth of London’s Tech economy to the value of £14m pa in GVA. This was estimated using publicly available revenue and conservative estimates of how much of this revenue is directly due to TfL open data. TfL open data also generated over 700 direct and indirect jobs.Qualitative assessment: TfL has also benefited from its relationship with partner companies, through which has received significant and useful data. |
Source: Frontier based on literature review and qualitative engagement
Note: For the purpose of this guidance we have classified benefits to the London Economy as indirect benefits