Market Data Insights: June 2021
Updated 15 July 2021

© Crown copyright 2021
This publication is licensed under the terms of the Open Government Licence v3.0 except where otherwise stated. To view this licence, visit nationalarchives.gov.uk/doc/open-government-licence/version/3 or write to the Information Policy Team, The National Archives, Kew, London TW9 4DU, or email: psi@nationalarchives.gov.uk.
Where we have identified any third party copyright information you will need to obtain permission from the copyright holders concerned.
This publication is available at https://www.gov.uk/government/publications/market-data-insights-june-2021/market-data-insights-june-2021
Economic Summary
In mid-June the UK government announced the extension of Stage 3 lockdown restrictions within the UK. As a result, many businesses continue to operate at less than full capacity. This is particularly true of those in the travel, hospitality, and entertainment sectors. The new Secretary of State for Health and Social Care, Sajid Javid, has indicated he wants an irreversible end to restrictions from 19 July. Business sentiment at this time can still be best described as ‘cautiously optimistic’.
Equity prices in the UK have continued to consolidate during June with the price levels matching the lower range of prices experienced in 2019. Nonetheless, the FTSE 100 remains in the upward trend that began in early November 2020 when the development of COVID-19 vaccines were announced.
The value of the pound has weakened relative to the US dollar but remains above the 1.37 (GBP/USD) level for the 5th consecutive month.
Gold prices have resumed the upward trajectory after experiencing a steep pull back in late 2020 and early 2021. This is discussed in more detail below.
The panic lows experienced by Bitcoin in May have been revisited in June. However, with price remaining above the £22.5k level it is still unclear whether the bull market in Bitcoin is over, or whether new all-time highs are possible in the months ahead.
Credit Spreads as at 30 June 2021
| AAA | AA | A | BBB | ||||||
|---|---|---|---|---|---|---|---|---|---|
| 25 bps | 51 bps | 89 bps | 133 bps | ||||||
| 0bps MoM | ▲1 bps MoM | ▼1 bps MoM | ▼ 5 bps MoM |
An asset’s ‘credit spread’ is the difference between its yield and that of a government-issued bond of similar maturity. It is an indicator of the perceived riskiness of the asset. It represents how much investors want to be rewarded for investing in it instead of a lower risk government bond.
Over the month of June, credit spreads held steady for most higher grades of bonds. However, the credit spreads on lower grade bonds fell. The lower the grade of bond, the deeper the decline tended to be.
Equities as at 30 June 2021
The graph below shows how the end-of-month positions have varied for the FTSE 100 between May 2019 and May 2021. The Financial Times Stock Exchange 100 Index (also referred to as the FTSE 100) is an index composed of the 100 largest companies listed on the London Stock Exchange.
The graph also compares the FTSE 100 against the North American and European MSCI indices which measures stock market performances in those regions. The graph is based on a base index of 100 for all 3 indices as at 31 May 2019.
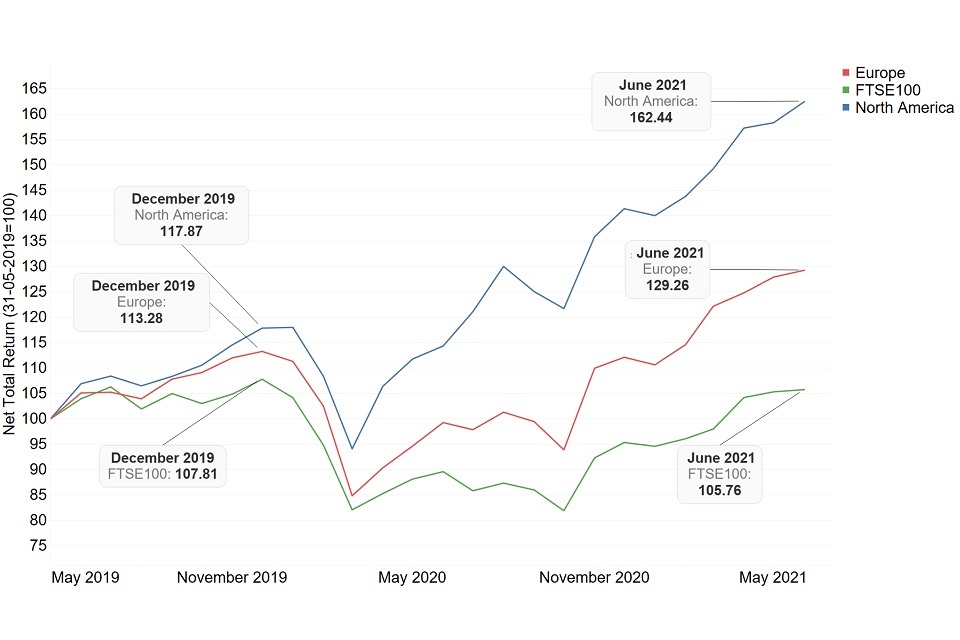
Equities
UK markets continued to consolidate throughout June with price levels remaining below the prices reached just prior to the COVID-19 crash in March 2020. The FTSE 100 found resistance in the 7100 to 7200 price range, a range that provided support throughout 2019.
The index remains in an up-trend with prices trading within an upwards channel established in November and December 2020 after the downtrend of the second half of 2020 was broken by the announcement of the successful development of COVID-19 vaccinations.
American markets continued to grind higher during June, with the S&P 500 finishing the month near a new all-time high.
The performance of the MSCI European Economic and Monetary Union index was better than the FTSE 100, but not as good as the main North American indices. The German blue-chip stock index the DAX made very modest gains of less than 1% for the month, which was representative of the wider European markets for June.
Gold
Gold is widely considered to be a good store of value, particularly during turbulent economic conditions. However, historically this has not always been the case. From the start of 2013 to the end of 2015 the price of gold fell over 30%.
The current bull run on gold began in earnest in June 2019 when the previous highs of 2011 were surpassed. The recent peak in the price of gold was achieved in August 2020 when gold traded at £1,573 per ounce, before closing the month at £1,497. Since that time price has entered a corrective phase, with price coming down to and then rebounding off the £1,220 per ounce zone during March 2021. This is the same level that price rebounded off on the way up in August last year, before breaking out to new all-time highs.
The price of gold dipped on 17 June 2021 by 3.4% in the UK and 4.4% in the US following an announcement from the Federal Open Market Committee (FOMC). The announcement by Federal Reserve Chair Jerome Powell related to the need to manage inflation in the longer term.
Gold, as a physical asset class, is generally considered to be a good hedge against inflation. Nonetheless, if interest rates were to rise in a bid to combat inflation, then the opportunity cost of holding gold instead of bonds would increase making the metal less attractive.
The following chart shows the price of gold in pounds sterling per ounce of gold over the past 15 years.
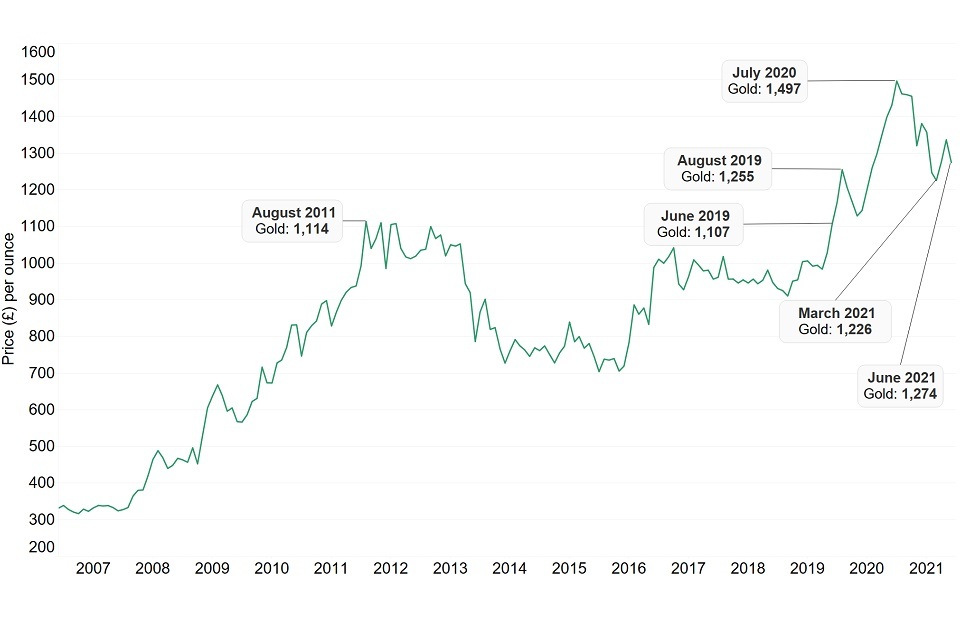
Gold
Inflation
The Consumer Price Index (CPI) measures the average change in prices over time that consumers pay for a basket of goods and services. The Consumer Price Index including owner occupiers’ housing costs (CPIH) is similar to CPI, as it measures inflation and includes a measure of owner occupiers’ housing costs.
Inflation in the UK has experienced a steady decline since late 2017. There was a sharp decline in April 2020 when lockdown measures were introduced to combat the pandemic. Inflation rates remained low for the following year with the CPIH remaining largely between 0.5% and 1% until the end of March 2021.
During April and May 2021 inflation began to climb again, reaching 2.1% by the end of May. With renewed economic activity due to the easing of lockdown restrictions, it is unsurprising for inflation to rise. The Bank of England’s long-term target is for inflation to average 2%, and their best estimate projections as at May 2021 is for CPI inflation to continue to rise throughout 2021 before tapering back to the 2% long-term average.
The chart below shows the CPIH inflation rate over the last 15 years.
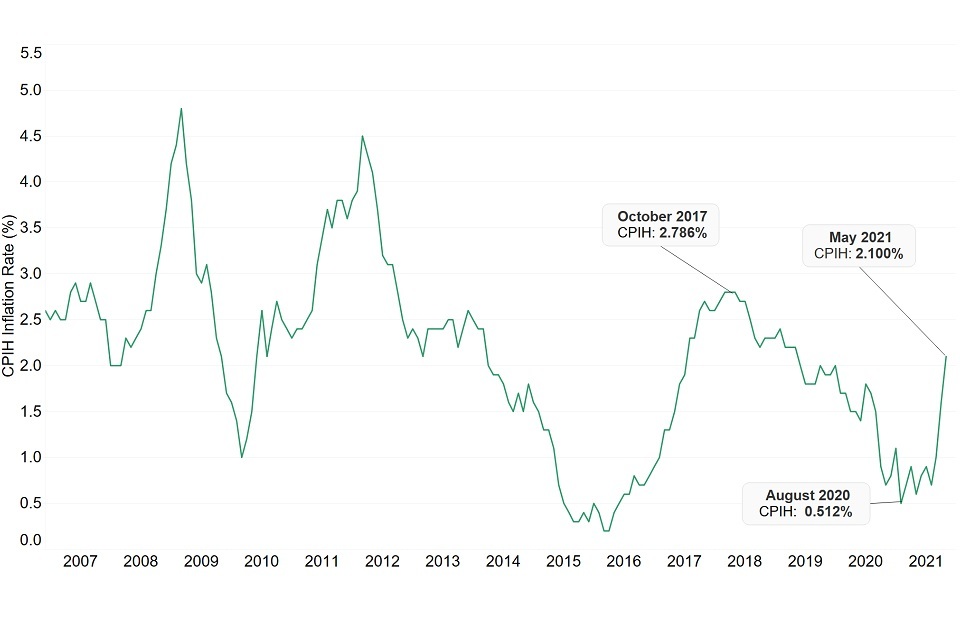
Inflation
Disclaimer
The information in this publication is not intended to provide specific advice. For our full disclaimer, please see the GAD publications page.
The Government Actuary’s Department is proud to be accredited under the Institute and Faculty of Actuaries’ Quality Assurance Scheme.

Quality Assurance Scheme