Market Data Insights - July 2021
Published 2 August 2021

© Crown copyright 2021
This publication is licensed under the terms of the Open Government Licence v3.0 except where otherwise stated. To view this licence, visit nationalarchives.gov.uk/doc/open-government-licence/version/3 or write to the Information Policy Team, The National Archives, Kew, London TW9 4DU, or email: psi@nationalarchives.gov.uk.
Where we have identified any third party copyright information you will need to obtain permission from the copyright holders concerned.
This publication is available at https://www.gov.uk/government/publications/market-data-insights-july-2021/market-data-insights-july-2021
Economic summary
On 19 July, the UK entered ‘Step 4’ of the roadmap out of lockdown and most legal limits on social contacts were lifted. Premises, including nightclubs, which had remained closed were also allowed to reopen. The changes meant face coverings were no longer mandatory and workers were no longer instructed to work from home, but both are still encouraged.
As of 26 July, 88.2% of UK adults had received their first COVID-19 vaccination and 70.8% had received their second dose.
More than 680,000 people using the NHS Covid-19 app in England and Wales were asked to self-isolate in the week ending 21 July, a 11% rise from the previous week. The government has introduced pilot schemes to exempt certain key workers to mitigate the impact of the self-isolations. It is too soon to observe the economic effect of the self-isolations and easing of the social distancing measures.
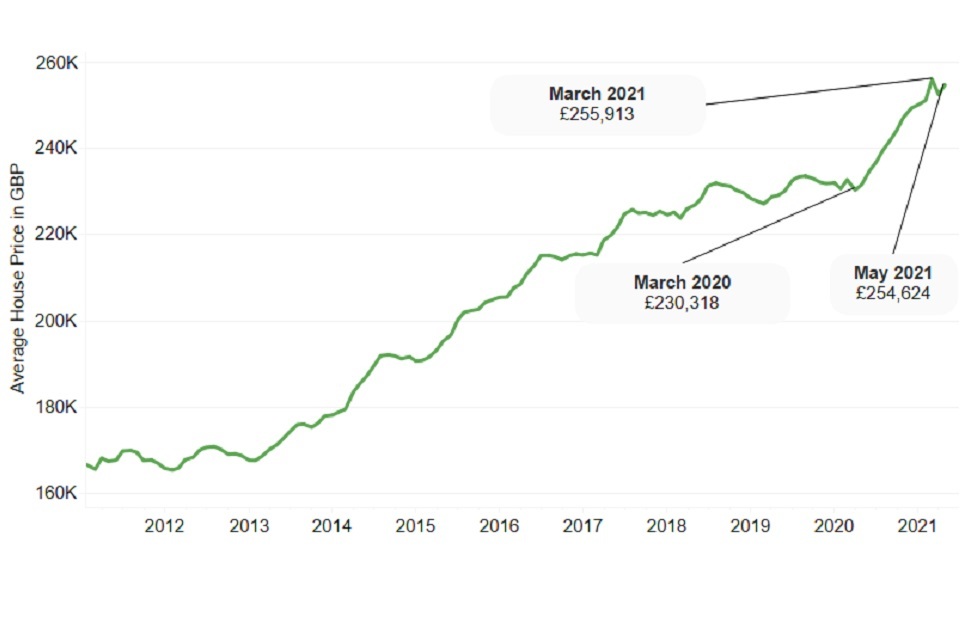
While house prices have reached an all-time high, the growth appears to be levelling off following the announcement of the removal of stamp duty relief. This indicates that the housing market could soon enter a cooling off period.
Credit spreads as at 22 July 2021
| AAA | AA | A | BBB | ||||||
|---|---|---|---|---|---|---|---|---|---|
| 25 bps | 52 bps | 90 bps | 134 bps | ||||||
| 0bps MoM | ▲2 bps MoM | 0 bps MoM | ▼ 4 bps MoM |
An asset’s ‘credit spread’ is the difference between its yield and that of a government-issued bond of similar maturity. It is an indicator of the perceived riskiness of the asset. It represents how much investors want to be rewarded for investing in it instead of a lower risk government bond.
Over the month up to 22 July, credit spreads held steady for most higher grades of bonds. However, the credit spreads on lower grade bonds fell. The lower the grade of bond, the deeper the decline tended to be.
Property
Since the UK entered its first lockdown in March 2020, house prices rose month-on-month for a year at an unprecedented rate. This was attributed to increased demand from people re-evaluating their living needs due to a shift towards long-term home working. The introduction of stamp duty reliefs in July 2020 also contributed towards the increased demand.
In March 2021, the Chancellor announced that the relief would end on 30 June 2021 but announced a tapered extension until the end of September 2021. As the graph below shows, property prices seem to have levelled off since March 2021.
This appears counterintuitive as many would have expected to see property-buyers rush to buy properties to meet the deadline and increase property prices as a result. Coupling this with demand for houses growing faster than flats make it difficult to explain the recent levelling off in prices. However, it could be an overall indicator that the residential property market has been growing at an unsustainable level since the start of the first lockdown.
Property
Petrol and oil prices
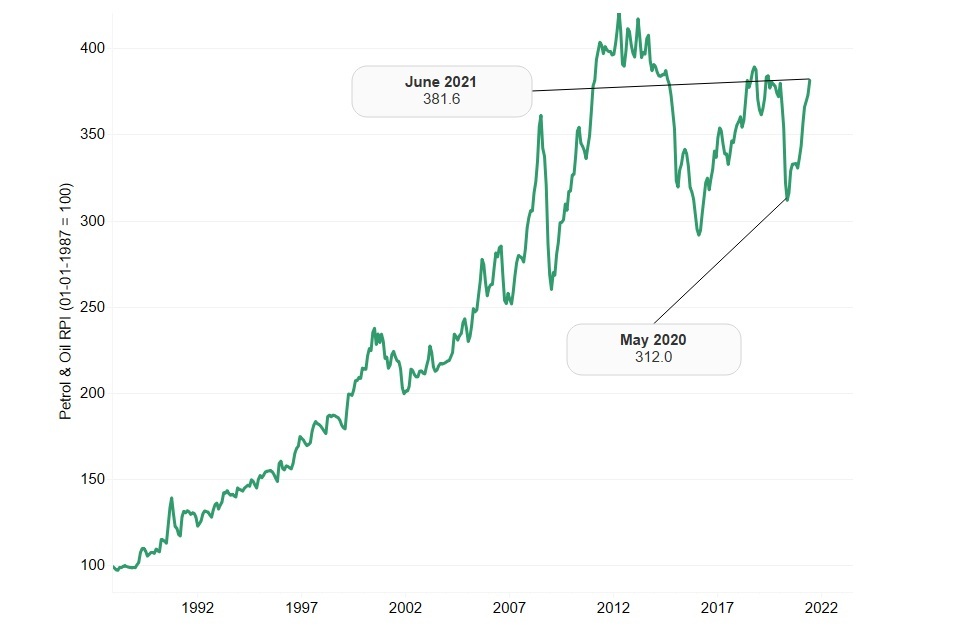
As economies across the world continue to emerge from lockdown and consumer air travel increases, oil prices have increased sharply since their near 10-year low in May 2020. While the price rise can be attributed to increased demand from individuals following lockdown easing, the price is also heavily influenced by the suppliers. Since OPEC and its allies (generally referred to as OPEC+) account for the majority of the world’s oil supplies, they are able to control prices.
In July 2021, OPEC+ members reached an agreement to increase oil supply which indicates that a reduction in oil prices may occur in the near future.
The graph below shows the ONS oil index and we can see that prices have now returned to pre-pandemic levels.
Petrol and Oil Prices
Earnings
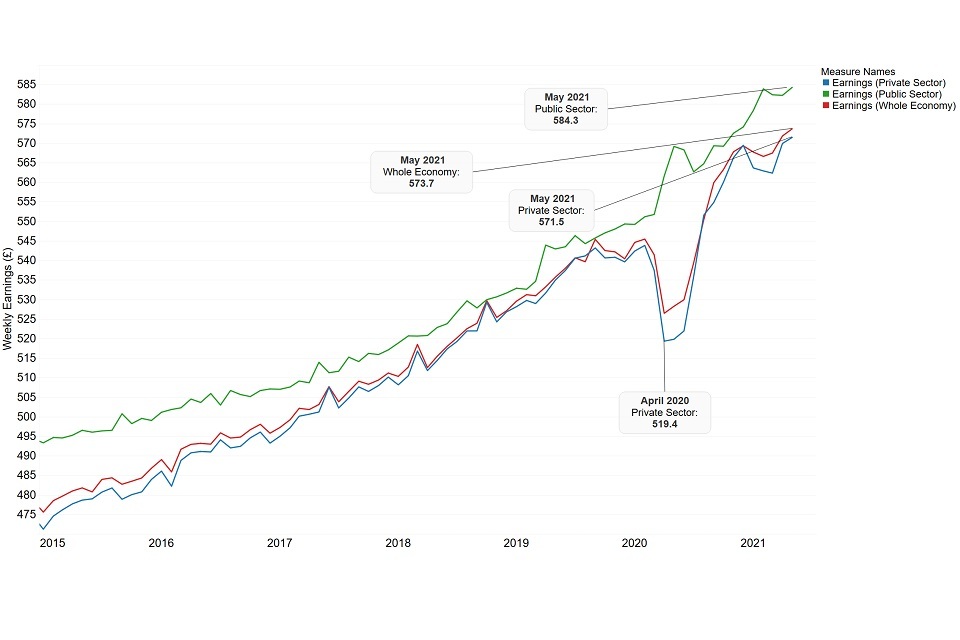
Average weekly earnings (AWE) is the lead indicator of short-term changes in earnings in the UK and replaced the Average Earnings Index in January 2010. AWE for any month is the ratio of estimated total pay for the whole economy, divided by the total number of employees. As a result, AWE can be impacted by changes in rates of pay, and the composition of the labour force.
The recent increase in price inflation, discussed above, can be viewed alongside the trends in wage inflation.
Under the first and strictest lockdown measures in the UK, average weekly earnings in the private sector dropped significantly. It hit a low of £519 in April 2020 but has since recovered.
During this time, earnings in the public sector increased. The dip in private sector earnings was relatively short lived, and earnings had resumed their long-term upward trend by August 2020. The gap between public and private sector wages closed to less than 1% in December 2020.
During the first quarter of 2021 earnings in the private sector, and in the economy as a whole, dipped slightly. This is likely to have been driven by the UK entering its third national lockdown at the end of 2020. However, May 2021 saw a modest increase in earnings of 0.8% across the whole economy. This increase has been driven by improvements in earnings in the private, rather than the public, sector.
The chart below shows how the average weekly earnings has grown over the past 15 years for the whole economy, as well as the public and private sectors.
Earnings
Disclaimer
The information in this publication is not intended to provide specific advice. For our full disclaimer, please see the GAD publications page.
The Government Actuary’s Department is proud to be accredited under the Institute and Faculty of Actuaries’ Quality Assurance Scheme.

QAS Logo