Mapping denitrification potential in groundwater - summary
Published 18 February 2020

© Crown copyright 2020
This publication is licensed under the terms of the Open Government Licence v3.0 except where otherwise stated. To view this licence, visit nationalarchives.gov.uk/doc/open-government-licence/version/3 or write to the Information Policy Team, The National Archives, Kew, London TW9 4DU, or email: psi@nationalarchives.gov.uk.
Where we have identified any third party copyright information you will need to obtain permission from the copyright holders concerned.
This publication is available at https://www.gov.uk/government/publications/mapping-denitrification-potential-in-groundwater/mapping-denitrification-potential-in-groundwater-summary
1. Chief Scientist’s Group research summary
This project has produced a literature review of the factors affecting removal of nitrate in groundwater by denitrification. Denitrification is the conversion of nitrate to nitrogen gas (N2) by a diverse range of microbes. Maps showing the potential for denitrification in the most important groundwater aquifers in England have been created.
The maps show that there is widespread potential for denitrification in groundwater across England; however individual borehole data from the Environment Agency’s strategic monitoring network indicate that it is quite patchy within individual aquifers. By setting out an approach for assessing the evidence, the maps can be further refined in future as additional information from monitoring data attributed to aquifers become available.
The maps and the procedure used to create them can be widely applied, and indicate areas where the collection and analysis of more-detailed datasets may be beneficial to confirm that denitrification is occurring at the site scale and to calculate rates of attenuation.
1.1 Background
Nitrate in groundwater can arise from inorganic sources such as fertiliser or from organic sources commonly comprising manure, slurry and sewage. An understanding of the fate of nitrate in groundwater is vital for managing risks associated with nitrate pollution, and to safeguard groundwater supplies and groundwater-dependent surface waters.
Denitrification is the dominant process for nitrate attenuation in groundwater and can, under certain environmental conditions, significantly reduce the total nitrogen in groundwater. It is therefore helpful to regulators and water resources managers to have an indication of where denitrification is likely to be occurring and the supporting evidence base.
1.2 Method
The science underpinning our understanding of denitrification processes and the environmental factors required to support them is well documented. The critical factors limiting denitrification in groundwater are:
- The presence of oxygen. This is generally associated with young groundwater and aquifers unconfined by overlying impermeable rocks.
- Electron donor concentration and availability. Dissolved organic carbon is the most common electron donor and can be derived naturally from organic rich soils and sediments e.g. peat and alluvium, or groundwater that has passed through them.
The aim of this project was to develop an approach that combines and assesses the various types of evidence available to give an overview of denitrification potential across groundwater in England. Maps synthesising the findings and underpinning data have been produced to summarise this information for users.
Three main lines of evidence were used in the assessment.
-
Aquifer settings. Published information from journal articles, Aquifer Baseline reports and Environment Agency water quality reports were used to identify environmental settings where denitrification is found or expected (including aquifers unconfined by overlying impermeable deposits and peat and alluvium aquifers). These were mapped using geological data at the 1:625,000 scale to give an overview at the national scale.
-
Groundwater monitoring data. Groundwater quality criteria were developed for different chemical indicators of denitrification (including dissolved oxygen and organic carbon) using information available from the published literature. Monitoring data primarily from the Environment Agency strategic monitoring data was then assessed against the criteria to identify in which aquifer settings the geochemical conditions indicative of denitrification are observed in groundwater. The proportion of monitoring points confirming such conditions was used to determine whether there was high or low potential for denitrification. Their areal coverage provides an estimate of confidence (high, medium or low).
-
A ‘mass balance’ approach. This compares nitrogen inputs at the surface with measured groundwater concentrations in areas with a relatively short unsaturated zone travel time derived from an existing British Geological Survey model and data from the 2012 Nitrate Vulnerable Zone designation process. Where nitrogen inputs are substantially larger than outputs, the reduction of nitrogen may be attributable to denitrification. This comparison highlighted areas of the unconfined outcrop where groundwater concentrations interpolated from monitoring data were less than would be anticipated from estimations of nitrate leached into the subsurface.
1.3 Project outputs
An integral part of identifying ‘aquifer settings’ was to develop new maps of the sub surface expression (subcrop) of principal aquifers in England that represent the zone confined by overlying younger bedrock. These are useful for any groundwater risk assessments and models requiring an understanding of the spatial extent of the aquifer beneath the surface. Areas of outcrop confined by overlying low permeability superficial deposits are also available.
The probability of denitrification occurring (high or low potential) within a particular environmental setting (e.g. confined bedrock aquifer, or aquifer confined by low permeability superficial deposits) derived from comparison with monitoring data is indicated by colour coding. An example map is shown for the Chalk aquifer.
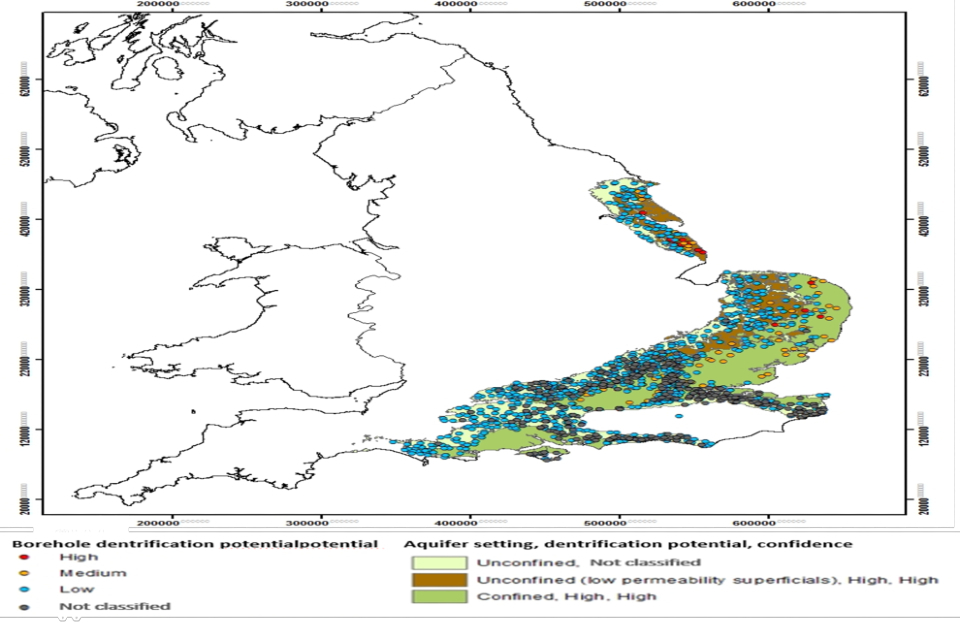
Figure 1. Map of denitrification potential for the chalk aquifer
The map also shows the denitrification potential for individual monitoring points within the Chalk. These provide greater local refinement and information about the degree of agreement between monitoring points, or where localised geochemical or hydrogeological variability in the aquifer may be controlling denitrification.
Map layers are also available for the Upper Greensand Formation, Lower Greensand Group, Corallian Group, Jurassic Oolites, Permo-Triassic sandstones, Magnesian Limestone (now Zechstein Group), the Coal Measures and Millstone Grit Groups (Carboniferous) and the Lower Carboniferous (Dinantian) principal bedrock aquifers. A map layer of denitrification potential within the superficial aquifers is also available.
For the Palaeogene, Devonian and older strata, subcrop zones have not yet been developed. The Mercia Mudstone Group is not classified separately at the mapping scale used, although monitoring data are available.
1.4 Publishing details
This summary relates to information from project SC160010, reported in detail in the following output(s):
Report:
BGS Open Report OR/18/011
Title:
Review of denitrification potential in groundwater: in England http://nora.nerc.ac.uk/id/eprint/522242/
Report:
BGS Open Report OR/18/009
Title:
Mapping denitrification potential in groundwater: Methodology Report http://nora.nerc.ac.uk/id/eprint/522241/
February 2020
Project Manager:
Natalie Phillips, Research, Analysis and Evaluation
Research Collaborator:
Marianne Stuart, British Geological Survey, Maclean Building, Wallingford, Oxfordshire, OX10 8BB
This project was co-funded by the British Geological Survey and the Environment Agency’s Research, Analysis and Evaluation group, which provides scientific knowledge, tools and techniques to enable it to protect and manage the environment as effectively as possible.
Enquiries: research@environment-agency.gov.uk
© Environment Agency