Maintained schools and academies inspection outcomes as at 31 August 2016
Updated 25 October 2017

© Crown copyright 2017
This publication is licensed under the terms of the Open Government Licence v3.0 except where otherwise stated. To view this licence, visit nationalarchives.gov.uk/doc/open-government-licence/version/3 or write to the Information Policy Team, The National Archives, Kew, London TW9 4DU, or email: psi@nationalarchives.gov.uk.
Where we have identified any third party copyright information you will need to obtain permission from the copyright holders concerned.
This publication is available at https://www.gov.uk/government/statistics/maintained-schools-and-academies-inspections-and-outcomes-as-at-31-august-2016/maintained-schools-and-academies-inspection-outcomes-as-at-31-august-2016
This release contains:
- provisional data for inspections completed between 1 April and 31 August 2016
- most recent inspection outcomes as at 31 August 2016
- revised data for inspections completed between 1 September 2015 and 31 March 2016
9 out of 10 primary schools were judged good or outstanding at their most recent inspection
Ninety per cent of primary schools and 78% of secondary schools were judged good or outstanding at their most recent inspection. Since August 2015 the proportion of schools judged good or outstanding at their most recent inspection has increased for every phase of education.
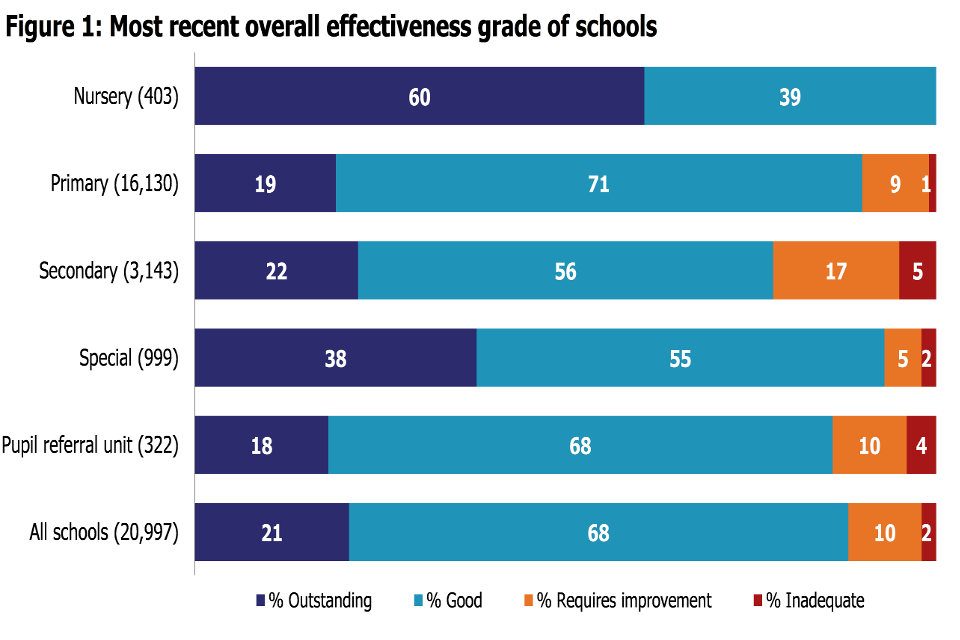
Figure 1
The gap has increased between the proportion of good or outstanding primary and secondary schools
The gap has increased between the proportion of good and outstanding primary and secondary schools from 11 percentage points at the end of August 2015, to 12 percentage points at the end of August 2016.
Just over a third of short inspections converted to full inspections, and more than half of these resulted in a judgement of good or outstanding
Of the 1,471 short inspections in 2015/16, 513 converted to full inspections and 275 of these resulted in an overall effectiveness judgement of good or outstanding.
1. Schools at their most recent inspection
The proportion of schools judged good or outstanding at their most recent inspection as at 31 August 2016 was 89% (see figure 1). This is 5 percentage points higher than the proportion judged good or outstanding at 31 August 2015.
The proportion of primary schools judged good or outstanding at their most recent inspection has increased by 6 percentage points since 31 August 2015 and now stands at 90%. The proportion of secondary schools judged good or outstanding at their most recent inspection has increased by 4 percentage points since 31 August 2015 and now stands at 78%.
The gap between the proportion of good or outstanding primary schools and secondary schools has widened by 1 percentage point since the end of the last academic year, and is now a 12 percentage point gap.
Eighty per cent of primary schools remain under local authority control. The proportion of local authority primary schools that are good or outstanding has increased by 6 percentage points since the end of August 2015, and now stands at 91%. There were 1,526 full section 5 inspections of local authority primary schools in 2015/16. Of these, 1,212 were of schools that were less than good at their previous inspection and 74% of these improved to good or outstanding at their inspection this year.
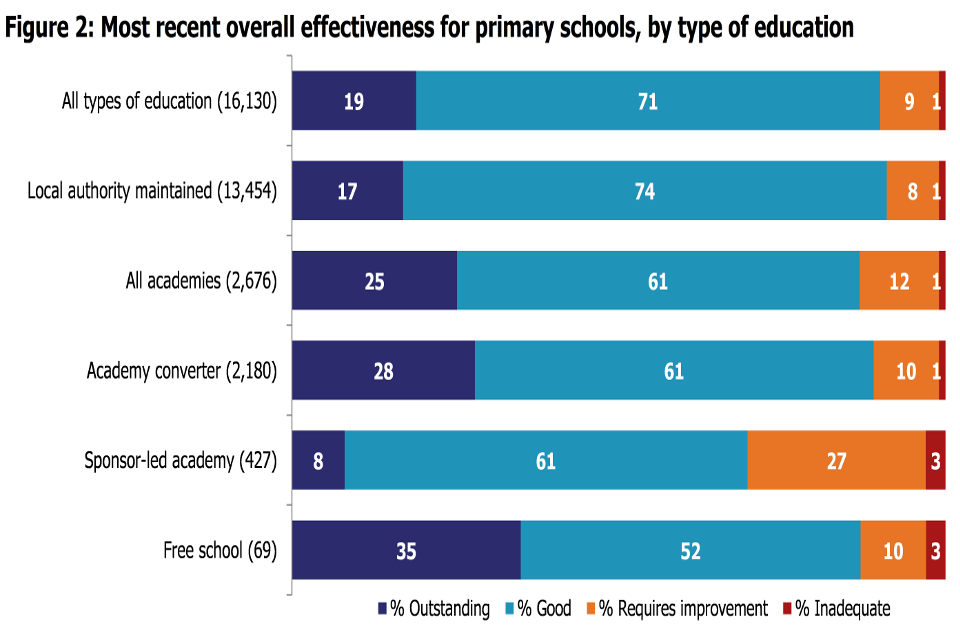
Figure 2
In August 2015, 84% of primary academies were good or outstanding compared to 85% of local authority primary schools. By August 2016, this had increased to 86% of academies and 91% of local authority schools (see figure 2 above).
The increase in the proportion of good and outstanding schools is a direct result of the number of local authority primary schools improving from less than good to good or outstanding in 2015/16. Changes to the proportion of good and outstanding primary local authority schools will have a large impact on the overall proportion of good or outstanding schools because the majority of schools are primary and the majority of these are local authority maintained.
2. Inspections between 1 September 2015 and 31 August 2016
There were 2,401[footnote 1] section 5 inspections conducted between 1 September 2015 and 31 August 2016, where the inspection report was published by 30 September 2016. This includes 513 short inspections that converted to full section 5 inspections (see figure 3). The total number of full section 5 inspections conducted in 2015/16 is less than half of the 5,042 conducted in 2014/15.
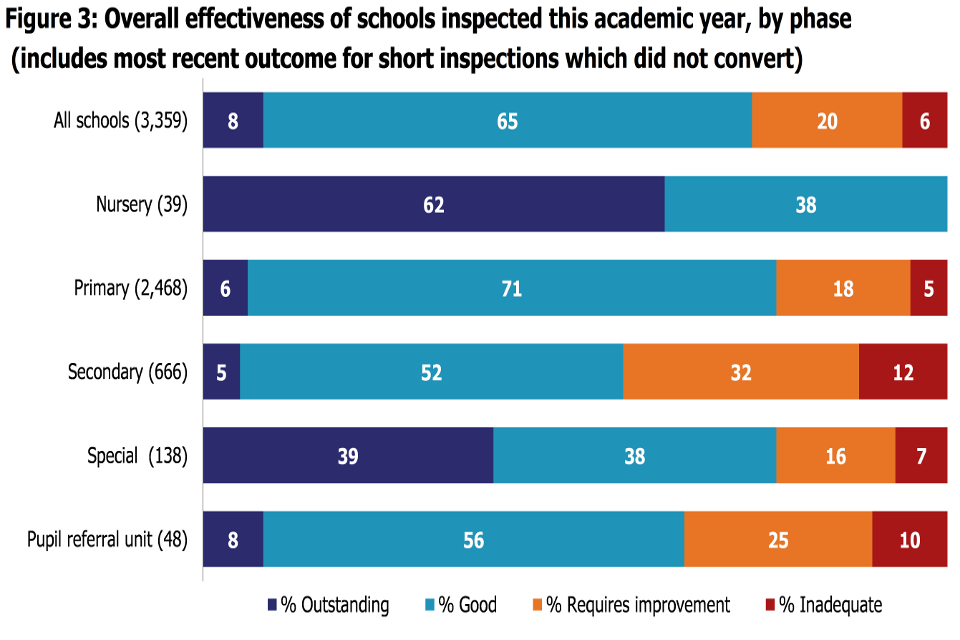
Figure 3
The main reason for the lower volume of section 5 inspections this year is the introduction of short inspections. In 2015/16 there were 958 short inspections that did not convert to a full inspection. These schools retained their most recent overall effectiveness judgement from their most recent full inspection. Additionally, the common inspection framework was introduced with a planned slower start to inspections in Autumn 2015, and there was a change in the timing of the inspections of new schools. New schools are now inspected during their third year of operation rather than in their fifth term.[footnote 2]
Combining the number of full section 5 inspections with the number of short inspections that did not convert, there were 3,359 inspections in total this year. Seventy four percent of these inspections resulted in the school receiving a good or outstanding grade for overall effectiveness[footnote 3]. When short inspections are included, a higher proportion of both primary and secondary schools were judged to be good or outstanding in 2015/16 compared to in 2014/15; 78% of primary schools compared to 73% in 2014/15, and 57% of secondary schools compared to 51% in 2014/15.
There were no integrated inspections of education and boarding provision in maintained schools and academies in 2015/16.[footnote 4]
3. Short inspections
In 2015/16, a total of 1,471 short inspections had been carried out. Just over a third of these (35%) converted to a full section 5 inspection.
Of the inspections that converted, just over half (54%) resulted in a good or outstanding judgement; this is made up of 25% that retained their good or outstanding grade and a further 29% that improved from good to outstanding. Four providers declined from outstanding to good.
Of the short inspections of primary schools in 2015/16 that converted to a full inspection, 57% remained good or improved to outstanding. This is higher than the 47% of secondary schools that remained good or improved to outstanding when their short inspection converted to a full section 5.
In the last release, we reported that the proportion of short inspections converting to a full inspection was 37%. This has decreased slightly to 35% with a full year’s inspection data. The proportion of those that converted and retained or improved their overall effectiveness judgement has increased slightly. The picture has stabilized during the year, and the figures for the full academic year are more in line with what we would expect to see compared to the figures previously reported in the December 2015 and March 2016 official statistics.
4. Revisions to previous release
Provisional data indicated that there were 1,286 inspections between 1 September 2015 and 31 March 2016, published by 30 April 2016. Revised data shows that an additional 28 inspections took place in this period which were published after 30 April 2016. Seven of these additional inspections resulted in the school being judged to be good; 9 were requires improvement and 12 resulted in inadequate judgements.
The addition of these inspections has decreased the proportion of outstanding inspections by 1 percentage point and increased the proportion of inadequate inspections by 1 percentage point for this period. Further details can be found in the revised table 2 of the charts and tables file.
5. Notes
Data in this release is from inspections undertaken between 1 September 2015 and 31 August 2016, and most recent inspections of open schools as at 31 August 2016. Outcomes are included if the inspection report was published by 30 September 2016. If an inspection report is not published by 30 September 2016 then the previous inspection, where available, will be reported as a school’s most recent inspection.
Inspections are conducted under sections 5 and 8 of the Education Act 2005. Under exceptional circumstances Ofsted may withhold publication of an inspection report.
An explanation of the key uses of this data and further contextual information and the arrangements for quality assurance is provided in the accompanying quality and methodology report.
The methodology and quality report can be found at the following webpage: www.gov.uk/government/collections/maintained-schools-and-academies-inspections-and-outcomes-as-at-31-August-2016. This report provides information about strengths and limitations of the statistics.
In 2016, the National Statistician published new guidance covering management information and official statistics.
If you have any comments or feedback on this publication, please contact Louise Butler on 03000 131 457 or Louise.Butler@ofsted.gov.uk
-
An additional fifteen inspections took place in the period but the report was not published by 30 September so the outcomes are not included in these statistics. The outcomes of these inspections will be included in the revised statistics published in spring 2017. ↩
-
See previous release for more details; Maintained schools and academies inspection outcomes as at 31 March 2016 ↩
-
This includes schools which were judged at a short inspection to be continuing to provide a good or outstanding standard of education, and the inspection therefore did not convert to a full inspection. ↩
-
Where a maintained school or academy offers residential boarding, Ofsted aims to inspect both the education and boarding provision during the same inspection. These are known as integrated inspections. In addition some inspections are aligned inspections, where education provision and boarding provision are inspected at the same time but two separate reports are produced. ↩