Local jobs, trade and investment: why does the local picture matter for trade policy?
Published 10 March 2021

© Crown copyright 2021
This publication is licensed under the terms of the Open Government Licence v3.0 except where otherwise stated. To view this licence, visit nationalarchives.gov.uk/doc/open-government-licence/version/3 or write to the Information Policy Team, The National Archives, Kew, London TW9 4DU, or email: psi@nationalarchives.gov.uk.
Where we have identified any third party copyright information you will need to obtain permission from the copyright holders concerned.
This publication is available at https://www.gov.uk/government/publications/local-jobs-trade-and-investment/local-jobs-trade-and-investment-why-does-the-local-picture-matter-for-trade-policy
Executive summary
Openness to trade and investment can lead to better quality, better paid and more jobs over time. The British labour market is heavily linked to investment and trade, particularly trade from outside the EU. The Department for International Trade’s (DIT) ambitious programme of trade negotiations and facilitation will likely increase the number of UK jobs being supported by exports. However, there will be winners and losers.
Local specialisation and labour market conditions can mean not all firms, industries and parts of the country are able to exploit the new opportunities equally. Therefore, targeted local policies that help firms and workers adapt and move into expanding sectors are vital for realising the potential gains from trade. Local data and intelligence are crucial to the development of policy in all areas so that benefits can be secured in all areas of the UK. DIT supports local firms to make the most of new trade opportunities.
Introduction
The UK Board of Trade paper ‘Global Britain, Local Jobs’ sets out the case for free trade and the opportunity for the UK to herald a new era rich in jobs, higher wages and opportunity. There is strong evidence of the benefits from increased openness to trade and investment. Consumers, businesses, and workers gain from the associated lower prices, increased choice, higher productivity, and access to larger markets. These benefits come through the increased specialisation that trade encourages.
The increased specialisation at a national level also leads to increased specialisation in different parts of the UK. People and resources move between firms, industries, cities and regions across the UK, encouraged by the agglomeration effects from trade and market openness. This allows firms and the workforce to specialise in highly competitive areas to take advantage of the opportunities trade offers, but also to adapt and adjust to the challenges it brings.
The precise relationship between trade, investment and jobs is not simple but is quite nuanced. It differs by local area, occupation, industry, and gender. A person’s family ties, education, access to credit, transport and housing can all play a part in the extent to which people move from one part of the UK to another. This determines their ability to take advantage of, and respond to, the opportunities provided by trade liberalisation.
Of course, trade policy is not the only policy to affect the UK labour market. Other factors such as increased digitalisation, automation, and remote working, interact with other drivers that will affect the labour market, and influence how different local economies will react to changes in trade opportunities.
This paper illustrates the importance of local insights using the latest evidence. It discusses how DIT can continue to develop its local understanding and includes results from a methodology for identifying the number of employees in nationally export intensive sectors at the constituency level.
1. UK jobs, trade and investment
The British labour market is heavily linked to investment and trade, particularly from outside the EU.
1.1 The UK’s trade reflects the complexity and integrated nature of modern supply chains and a sophisticated service-based economy. UK total trade was equivalent to almost 55% of GDP[footnote 1] in 2020. Services trade accounted for 36%[footnote 2] of total trade in 2020. In terms of value added, services trade accounted for around 69% of British exports in 2015[footnote 3], as many services are embedded in manufactured goods.
1.2 Many sectors rely on both imports and exports. Exports increasingly include imported inputs, as increased specialisation by firms in specific tasks or parts of the production process has supported the expansion of global value chains. In 2015, more than half of the world’s manufacturing and services imports were intermediate[footnote 4] products (primary goods, parts and components, semi-finished goods, services).[footnote 5]
1.3 Trade and investment have become increasingly intertwined in sophisticated global value chains (GVCs). There is strong evidence that GVCs are a powerful driver of productivity, growth, and job creation.[footnote 6] In 2014, multinational enterprises accounted for around one third of global output and world GDP, and half of global exports.[footnote 7] These firms do not make trade and investment decisions in isolation because they can access local markets through trade, local sales by affiliates, setting up franchises, licensing local firms, and other forms of partnerships. Therefore, when considering whether jobs are dependent on or supported by trade, ideally we would consider the nature of the firm and whether it is part of a wider network or multinational firm.
1.4 Combined with measures of labour productivity, the value added to products and services by UK businesses before they are exported and sold overseas determines how workers and shareholders gain from trade. Understanding value-added frames how trade contributes to UK prosperity, as UK businesses add value to products and services sold overseas, specialising in the activities they are best at in global value chains. This value added (the contribution of UK workers and businesses to the final value of goods and services paid for by consumers across the world) is what enables businesses to pay their workers and shareholders more. So growth in UK value added is a key measure of the UK’s success as a trading nation, highlighting the valuable contribution UK businesses make through trade.
By identifying where value is created in global value chains, the OECD’s estimates of Trade in Value Added provide a more rounded view of trade patterns and how they benefit trading economies than gross trade statistics. The OECD has estimated export-supported employment using TiVA data, which suggests that in the UK, the share of domestic employment supported by gross exports increased from 18.7% in 2005 to 21.2% in 2015.[footnote 8]
1.5 UK exports are a major driver of UK labour market outcomes. The Fraser of Allander Institute (FAI) estimate that UK export production supported around 6.5 million full-time equivalent (FTE) jobs, or 23% of total UK FTE jobs, in 2016.[footnote 9] Around 58% (3.8 million) of these jobs were in exporting industries (jobs supported ‘directly’ by exports) and 42% (2.7 million) were in the UK supply chain of exporting industries (jobs supported ‘indirectly’ by exports).
1.6 UK jobs are particularly dependent on non-EU exports across all areas of the country. Exports to the EU and the Rest of the World supported around 2.8 million and 3.7 million UK FTE jobs in 2016, respectively.[footnote 10] Over the same period, by individual export destination, exports to the United States supported the largest number of jobs; around 1.3 million UK direct and indirect jobs (or 4% of all UK FTE jobs).
2. Trade, investment, jobs and geography
The relationship between trade, investment and jobs varies between geographic locations.
2.1 Not all industries, or firms, trade to the same extent. Export intensive industries are distributed unevenly across Great Britain, which means that whether a region or local area depends on exports is down to the export intensity of the firms in that area.
2.2 Labour markets in London and the South East are significantly more supported by exports than the rest of the country. The FAI estimates that in 2016, 26% of all FTE jobs supported directly and indirectly by exports were in London, while only 2.6% were in the North East.[footnote 11] See Figure 1.
Figure 1: UK FTE jobs supported (directly and indirectly) by exports, by broad destination and NUTS 1 regions, ESJ basis, 2016
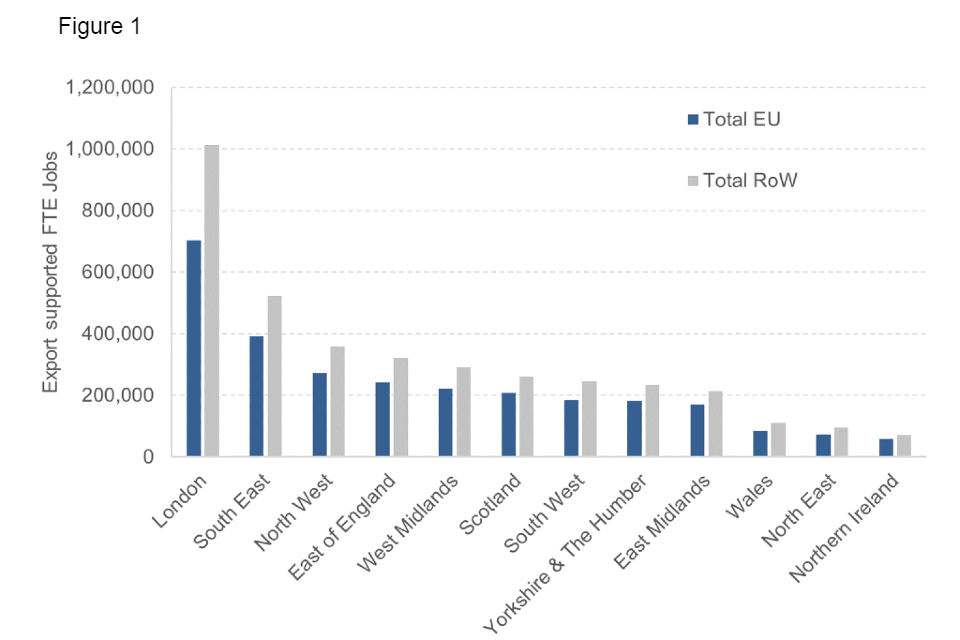
Figure 1: export-supported FTE jobs in the UK
2.3 Trying to understand the impact of trade on jobs at a local level is not straightforward. Data limitations inhibit our ability to know the location of firms and factories engaged with trade and how those firms provide employment in local economies. Moreover, we must be careful not to generalise between firms within industries because differences in productivity levels mean that firms across the UK will not be equally as competitive on international markets.
2.4 Nationally export intensive industries are distributed unevenly across Great Britain. Figure 2 presents DIT estimates of shares of employment in nationally export intensive industries in constituencies across the UK. For example, 38% of employees in Altrincham and Sale West work in sectors in the top quartile of nationally export intensive industries, driven by high employment in legal, accounting and management services (see Figure 2. The estimate for West Derby, Liverpool is only 5%, because of the high share of health, social care, and the employment services sector in the constituency (see Figure 3). The methodology to calculate these is set out in Annex 1.
2.5 In addition, industries vary in the degree to which they depend on imports to source inputs for their production. The location of these industries also mean that localities depend on imports for production inputs to varying degrees. Washington and Sunderland West is the constituency with the highest proportion of employment in sectors in the top quartile nationally import intensive industries, driven by the importance of imported inputs into auto manufacturing. Figure 3 shows that nationally import intensive areas are dispersed across all areas of the UK.
Figures 2 and 3: Share of total employees working in import/export nationally intensive industries by constituency

Figures 2 and 3: employee count (2019) in nationally import intensive (2016) industries as a share of total constituency employee count
Sources: ONS BRES (2019), NISRA BRES (2019), ONS UK Input-Output Analytical Tables (2016), DIT Calculations.
Notes: The proportion of employees (2019 BRES ONS and NISRA) in each constituency that work in ‘import intensive sectors’ – defined as the top quartile of UK sectors that have the highest share of imports as a share of intermediate consumption at the national level (according to 2016 ONS input-output data).
This calculation does not account for within sector and across constituency differences in import intensity and so does not tell us how import intensive or how many jobs are supported by imports at the constituency level.
See DIT (2021) ‘Local jobs, trade and investment’, for caveats and data coverage.
Estimates for Northern Ireland are for Northern Ireland as a whole and agriculture is excluded.
Notes: The proportion of employees (2019 BRES ONS and NISRA) in each constituency that work in ‘export intensive sectors’ – defined as the top quartile of UK sectors that have the highest share of exports as a share of total domestic output at the national level (according to 2016 ONS input-output data).
This calculation does not account for within sector and across constituency differences in export intensity and so does not tell us how export intensive or how many jobs are supported by exports at the constituency level.
See DIT (2021) ‘Local jobs, trade and investment’, for caveats and data coverage.
Estimates for Northern Ireland are for Northern Ireland as a whole and agriculture is excluded. $CTA
Figures 4 and 5: Share of total employees working in import nationally intensive industries* by constituency.
DIT analysis of the ONS Business Structural Database.

Figures 4 and 5: proportions of foreign-owned business turnover and foreign business employment
*Import intensive defined as sectors in the top quartile of all sectors in terms of exports as a share of total use
2.6 What matters for sustained employment is trade in value added, which is not captured by traditional trade statistics. The OECD found that 20% of employment in the UK in 2015 was sustained by foreign final demand in G20 countries,[footnote 12] including over 1.1 million people employed by final demand from the USA alone. In 2015 over £132 billion of UK employee wages were supported by non-EU final demand, compared to £76 billion from EU final demand.[footnote 13]
2.7 FDI also generates jobs. While we cannot identify the number of jobs associated with FDI by each region, the data in Figures 3 and 4 show FDI dependent firms are located across all regions of the UK, although they are not evenly distributed.[footnote 14] Foreign owned businesses constitute 17% of all employment in the North West, 16% in the North East and 13% in Wales, Scotland and Northern Ireland. In Inner London East, Berkshire, Buckinghamshire and Oxfordshire, Outer London (West and North West), and North Eastern Scotland they accounted for over a fifth of business employment. Business employment in Cornwall and Isles of Scilly, Highlands and Islands, Cumbria, Devon had the lowest proportions attributable to FDI involved firms, with less than 10% in each.
3. The relationship between trade, investment, and the labour market
Openness to trade and investment can lead to better quality, better paid and more numerous local jobs, although there will be winners and losers.
3.1 Greater openness is important as it can contribute to Britain maintaining its comparative advantage in high value sectors, while building new areas of expertise in the goods and services of tomorrow’s global economy.
3.2 The sectors in which Britain has global strengths depend on high skilled labour, which command higher wages. Exporters in developed economies tend to provide more high skilled vacancies than non-exporters and these jobs command a higher wage.[footnote 15] International trade facilitates the growth of competitive firms, rebalancing the demand for workers towards high-wage industries.[footnote 16]
3.3 Studies suggest that trade-enhancing policies, when combined with a sound macroeconomic environment, play an important role in realising wage and employment gains.[footnote 17] Even when the characteristics of employees in different firms have been accounted for, studies find that an ‘exporter wage premium’ persists over a range of sectors.[footnote 18]
3.4 Addressing the UK’s poor productivity is of particular importance if firms and workers are to reap the benefits from trade. Real wages and productivity have stagnated since 2007.[footnote 19] Output per worker in 2019 was around 21% lower than under a counterfactual scenario where UK productivity continued to grow at its pre-downturn trend since 2007.[footnote 20] Policies which seek to raise the UK’s productivity are therefore important in realising the benefits form trade.
3.5 Openness to trade can lead to enhanced technology adoption. One study finds increased trade with China accounted for 14% of European technology upgrading between 2000 and 2007, half due to firms investing in more R&D and half due to the downsizing of low technology firms.[footnote 21]
3.6 The exchange of ideas and higher profits associated with trade can also result in greater returns from research and development in the long term. An influential study found substantial productivity gains associated with learning through exporting, ranging up to 7%.[footnote 22]
3.7 There is also good evidence that FDI dependent firms have positive impacts on host economies. In 2018, businesses with any FDI link[footnote 23] were 59% more productive than those without any FDI link . The average R&D intensity in Great Britain was estimated to be 0.4% for domestically owned non-exporters and 1.3% for domestically owned exporters respectively, whereas the figure is estimated at 6.4% for foreign-owned exporters.[footnote 24]
3.8 Access to high-quality competitive imports in global value chains helps British producers to keep their own products competitive on international markets. DIT analysis of import intensity indicated that 49% of intermediate consumption in the manufacturing of UK autos are imports.[footnote 25]
3.9 Importing products in which Britain is less comparatively good at producing allows the British economy to further specialise. Focussing on what Britain is best at means workers have access to jobs that pay more and are more secure, while businesses can earn more profit and pass some of that on to shareholders. One study finds that if the UK did not trade, real income would be one third lower.[footnote 26]
3.10 However, in the short term, increased competition from trade has local losers as well as winners. Trade can lead to resources being reallocated away from firms that do not respond to the increase in openness, which includes unproductive and inefficient firms.[footnote 27] The gains from trade are diffused across the whole economy whilst the losses can be concentrated amongst a few firms and local areas.[footnote 28] Increasing imports puts competitive pressure on domestic producers which may lead to domestic industry and sectors declining, and thus losing out from trade.[footnote 29] Likewise, the increase in productivity and competition from FDI may have negative impacts on employment in the host country, but the extent of this is not certain.[footnote 30]
3.11 If unchecked, short term costs can translate into longer term scarring of the economy. However, evidence suggests recent labour market shocks have been more driven by technology than trade. The local impact of trade and technology shocks can be long lasting,[footnote 31] leading to lower lifetime earnings.[footnote 32] Loss of motivation and skills during unemployment can lead workers to stop looking for work altogether.[footnote 33] Advanced technology and imports are often substituted for low-skilled workers whilst increasing demand for high-skilled workers.[footnote 34] This can lead to wage polarisation, as middle-skilled workers are exposed to downward mobility.[footnote 35] Both technological change and trade have contributed to this shift, with evidence suggesting technology could be the predominant factor.[footnote 36]
4. The distribution of future trade opportunities
Local specialisation and labour market frictions means these future opportunities will not fall evenly across the country.
4.1 Specialisation will also continue to occur between different areas of the UK. A large pool of skilled labour, access to new ideas and a large network of suppliers can mean that entire areas can benefit from economies of scale. This can increase productivity and build resilient globally competitive industries. For example, Cumbria’s nuclear sector represents an international centre of excellence and has strong links to the county’s advanced manufacturing sector. Significant employers in the area include BAE systems, GlaxoSmithKline (GSK) and Siemens.[footnote 37]
4.2 Geographical agglomeration can mean the gains from trade are unevenly distributed. If workers are unable to develop new skills and find employment in new and expanding sectors, areas that have historically specialised in uncompetitive industries can disproportionately bare the adjustment costs of trade liberalisation. Whereas in areas benefiting from trade, tradable sectors and exporters pay higher wages and the expansion of exports leads to the creation of jobs in other non-tradeable sectors, through the ‘local employment multiplier’.[footnote 38]
4.3 Studies have shown that previous episodes of trade liberalisation have had distinct regional impacts. The proximity to Europe had some impact on the spatial distribution of UK manufacturing following accession to the EEC, with more activity relocating towards ports in the South East.[footnote 39] Evidence from America suggests workers in commuting zones most exposed to foreign competition experienced higher unemployment rates and job churn.[footnote 40]
4.4 Studies show costs to switching occupations, industries, or regions can make trade adjustments more costly and prolonged.[footnote 41] Barriers to housing, credit, transport and training can limit the ability of workers to reap the benefits from trade. A World Bank study assessing the labour market frictions in relation to international trade shocks suggest that mobility costs in the UK are high but less than the average for developed economies.[footnote 42]
4.5 The skill makeup of the local workforce determines the ability to adjust to trade shocks. Low skilled workers face more import competition, and their labour inputs may be easier to replace and/or offshore.[footnote 43] High-skilled workers tend to be more geographically mobile and more likely to switch industries.[footnote 44] For the US, 14% of the change in the wage premium commanded by skilled labour from 1990 to 2007 was because of a decline in trade costs.[footnote 45] Managerial and entrepreneurial skills are key to the ability of firms to innovate, adapt and succeed.
4.6 Demographics can impact resilience to trade shocks. Men (particularly low skilled) tend to be employed in industries with higher exposure to trade shocks than women.[footnote 46] Male workers displaced from manufacturing occupations can struggle to move into new jobs, notably in services, due to the number of women and young-people in these low-paid positions, which leads to increased competition for these jobs.[footnote 47] Young workers with less experience are more exposed to negative trade shocks, although a study in the US finds that the youth can benefit disproportionately from new export opportunities, relative to the rest of workplace.[footnote 48]
4.7 Remote working can significantly impact the distribution of trade shocks. An acceleration of offshoring service jobs could mean that the next wave of globalisation impacts services more than manufacturing. Teleworking could mean a more balanced distribution of income across the UK. The annual GDP of East Renfrewshire has increased by over £1 million, while for the City of London it has fallen by around £2.5 million according to one study, suggesting that COVID-19-induced teleworking has resulted in a large shift in economic activity to suburban local authorities.[footnote 49]
5. How to spread the gains from trade
Policies that help workers adapt and move into expanding sectors are vital for realising these potential gains.
5.1 Training and education are some of the most effective levers for tacking the unequal distribution of the long-term gains from trade. A high skilled workforce is vital for attracting firms in expanding sectors. It is more dynamic, mobile and innovative in the face of the challenges and opportunities associated with an open economy. Trade increases demand for skills in social interaction, communication, and non-routine abstract thinking.[footnote 50]
5.2 A local economy can create a comparative advantage in high value sectors through targeted forward-looking skill programmes. The WTO and ILO find that well integrated countries, with well-diversified, high value-added exports, have developed systems of continuing education and training which are responsive to the current and future demands of exporting industries.[footnote 51]
5.3 Even with a highly skilled workforce, government support is still required to ensure short-term adjustment costs do not translate into longer term scaring of local economies. Lack of access to finance may prevent a firm from investing in a new opportunity provided by liberalisation. Robust support for jobseekers, in the form of income support, information and training can help workers transition into expanding sectors.
5.4 Connecting people to new jobs and markets enables them to participate in new opportunities. Access to transport, fast broadband, and affordable housing can allow workers to transition to high productivity sectors and attract firms to regions which have experienced trade and technology shocks.
5.5 Trade and investment objectives need to be reconciled with wider societal objectives. In some cases, the pursuit of comparative advantage will not be advantageous to individuals or the wider economy, for example if it comes at the expense of family or environmental priorities.
5.6 With the right targeted policies, trade and investment are potent weapons in the mission to level up the UK, with the potential to raise productivity and wages across the country.
6. The role of local data
Local data and intelligence are crucial to the development of policy that benefits all areas of the UK. DIT’s role is to engage local firms, identify and reduce trade barriers and help companies make the most of new trade opportunities.
6.1 Targeted local policies require targeted local data. DIT is working with the ONS and other government departments to publish data important for understanding the trade story at the local level.
6.2 DIT continue to enhance the evidence base around the relationship between trade and local jobs. DIT have worked with the Fraser of Allender Institute (FAI) institute to produce estimates for the number and distribution of jobs supported by exports. The estimates include breakdowns by gender, occupation group, age group, qualifications, and UK NUTS1 region.[footnote 52]
6.3 In the absence of data linking trade to employment at the local level, DIT have been exploring how constituency level BRES survey employment data can provide insights for trade policy. Annex 1 provides details of a methodology used to identify the number of jobs supported by nationally export intensive industries at the constituency level. This does not tell how many jobs at the local level are in export intensive, because the local sectoral trade intensity can vary significantly from the national average. Considering all the associated caveats, it acts as a placeholder until more granular estimates becomes available. We can use the methodology as a starting point to engage local stakeholders to gain a more nuanced understand of trade relationships in their area.
6.4 The role of DIT is to identify market access opportunities that have the potential to benefit local economies the most. We work closely with local organisations, chambers of commerce and Local Enterprise Partnerships to identify high trade potential business and help them capitalise on new trading opportunities.
6.5 DIT have supported around 1,500[footnote 53] FDI projects across the UK 2019 to 2020, creating around 45,000 new jobs. For example, 123 projects in the North West are estimated to have created circa 4000 jobs, while 117 projects in the West Midlands are thought to have led to circa 3,700 new jobs. Figures 6 and 7 illustrate that these projects and jobs can be found across all regions of the UK.
Figures 6 and 7: DIT supported FDI projects in 2019 to 2020, NUTS1 and new employment from DIT supported FDI projects in 2019 to 2020, NUTS1

Figures 6 and 7: number of DIT-supported projects and number of jobs created from FDI projects in 2019 and 2020
Source: DIT (2020), Inward investment results: regional breakdown of FDI projects.
Annexes
Annex 1: Methodology – Constituency level estimates for number of jobs in nationally export/import intensive industries
We can estimate the sectors which are the most export (import) intensive at a national level. We can use these estimates combined with employment data to understand:
- the constituencies with the highest proportion of employees in nationally export intensive sectors.
- the constituencies with the highest proportion of employees in nationally import intensive sectors
However, this does not account for within sector and across constituency differences in export intensity.
There is no consistent data source for exports and imports by sectors at the local level, therefore, we are unable to account for differences in export (import) intensity with sectors or across regions.
Export (import) intensity
2016 ONS data can be used to indicate the extent to which employees in a constituency are employed by sectors that tend to be export intensive, when measured at a national level.
This does not tell us how many jobs in a constituency depend on exports. Firms in a constituency may be significantly more (or less) export intensive than the national average for that sector, therefore this measure would underestimate (overestimate) the actual number of employees working in firms that are highly export intensive in that constituency. It does not account for the local agglomeration of supply chains. It does not account for BRES data has significant omissions and caveats that can be found in Annex 3.
Input Output tables give the ratio of UK exports to total use (exports + domestic use) at basic prices, which can give an indication of the export intensity of a sector.

Formula for export intensity
The equivalent calculation for imports as a proportion of intermediate consumption can be used to indicate import intensity, capturing the proportion of total intermediate consumption in a sector that consist of imports.
Employees by constituency
Employee count data from the ONS and NISRA Business Register Employment Surveys (BRES) can provide an indication of how many employees work in sectors per constituency.
Using such survey data at a constituency level could lead to inaccuracies, due to small sample sizes. The quality of these estimates deteriorates as the geographies get smaller. The dataset has significant omissions which are detailed in greater length in Annex 3.
Number of employees in nationally export (import) intensive industries
Defining an ‘nationally export intensive’ as a sector in the top quartile of all sectors by the measure of export intensity given above, gives a list of 18 sectors with export intensities of 27% and above (Table 2 in annex).
Aggregating BRES employee numbers in these 18 sectors for each constituency, it is possible to derive the number of employees employed in nationally export intensive sectors (subject to the definition above).

Formula for employees in nationally export intensive industries

Formula for proportion of employees in nationally export intensive industries
This methodology can be replicated from an import perspective, to gain an understanding of the geographical areas that have a large concentration of employees in sectors that tend to be nationally import intensive.
Ranking constituencies by this metric is one approach to capturing export intensity, but it comes associated with significant caveats. The definition of ‘intensive’ is arbitrary and it can result in misleading results if a large employer in a constituency has a significantly different export intensity than the national average for that sector. It does not account for supply chains or local hubs.
2016 data may not be representative of current export intensity and 2019 data may not be reflective of employment patterns, particularly given the labour market disruption associated with COVID-19.
Annex 2 : tables
Table 1: DIT inward investment results 2019 to 2020
| Region | Projects | Estimated new jobs |
|---|---|---|
| London | 550 | 10,788 |
| South East | 137 | 3,943 |
| South West | 61 | 1,454 |
| Wales | 47 | 1,563 |
| West Midlands | 117 | 3,727 |
| Yorkshire and Humber | 75 | 1,663 |
| East Midlands | 43 | 1,250 |
| East of England | 71 | 1,609 |
| North East | 64 | 2,845 |
| North West | 123 | 4,141 |
| Northern Ireland | 32 | 1,649 |
| Scotland | 80 | 1,930 |
| Total | 1,449 | 44,830 |
Table 2: top sectors for export intensity (exports / output), 2016, UK input output tables
| Sectors | Export intensity (exports / output) |
|---|---|
| Activities auxiliary to financial services and insurance activities | 64% |
| Manufacture of motor vehicles, trailers, and semi-trailers | 63% |
| Mining and quarrying | 50% |
| Manufacture of other transport equipment | 48% |
| Water transport | 46% |
| Manufacture of chemicals and chemical products | 41% |
| Air transport | 39% |
| Manufacture of machinery and equipment not elsewhere classified. | 39% |
| Manufacture of textiles, wearing apparel and leather products | 37% |
| Fishing and aquaculture | 36% |
| Manufacture of basic pharmaceutical products and pharmaceutical preparations | 34% |
| Security, buildings, landscape activities; office & business administrative and support services | 34% |
| Manufacture of rubber and plastic products | 33% |
| Wholesale trade, except of motor vehicles and motorcycles | 31% |
| Manufacture of computer, electronic and optical products | 29% |
| Legal and accounting activities; activities of head offices; management consultancy activities | 27% |
| Financial service activities, except insurance and pension funding | 27% |
| Manufacture of coke and refined petroleum products | 27% |
Table 3: top sectors for import intensity (imports/intermediate consumption), 2016, UK input output tables
| Sector | Imports (total) / total use |
|---|---|
| Manufacturer of coke and refined petroleum products | 73% |
| Manufacture of motor vehicles, trailers and semi-trailers | 49% |
| Water transport | 49% |
| Manufacture of wood and of products of wood and cork, except furniture; manufacture of articles of straw and plaiting materials | 46% |
| Manufacture of rubber and plastic products | 43% |
| Manufacture of basic metals | 40% |
| Manufacture of fabricated metal products, except machinery and equipment | 40% |
| Manufacture of paper and paper products | 37% |
| Printing and reproduction of recorded media | 37% |
| Manufacture of chemicals and chemical products | 35% |
| Telecommunications | 34% |
| Air transport | 34% |
| Manufacture of electrical equipment | 31% |
| Manufacture of computer, electronic and optical products | 28% |
| Manufacture of machinery and equipment not elsewhere classified | 28% |
Annex 3 - DIT methodology data coverage and limitations
- Due to sample sizes and to ensure statistical disclosure controls are satisfied NISRA BRES data is not published by industry and constituency. Estimates are available by constituency and SIC section however in order to maximise industry coverage the former was chosen.
- ONS BRES data covers all Businesses registered for VAT and PAYE purposes.
- NISRA BRES data does not cover self-employed individuals so may underestimated business counts in sectors which have a high concentration of self-employed individuals.
- Both sets of employee jobs used above do not include farm agriculture.
- Employees counts are a workplace based measure This methodology will likely underestimate the importance of trade to workers from suburban constituencies, as many of them travel outside the constituency to work. Employment in low trade intensity sectors such as primary and secondary education and healthcare constitutes a higher proportion of employees in suburban areas than city centres. The exception being large manufacturing plants located in suburban constituencies.
- Estimates should be interpreted as employee counts not people, the data presents only the count of individuals in full or part time work. That is to say one person could have multiple employee jobs.
- Data has been subject to rounding therefore emphasis should not be put on point estimates.
Find more detail on the limitations of the BRES data by:
Find more detail on ONS input-output industry tables.
Annex 4 – FAI estimates caveats
- The FAI research is based on experimental methods and modelling. It is best practice to view the results as having moderately broad confidence intervals, rather than providing point estimates.
- The results by UK NUTS1 region and personal characteristics in particular, should be viewed as a ‘proof of concept’ in that their primary purpose is to demonstrate the potential of the modelling.
- While the methods and assumptions adopted to construct the NUTS1 estimates are the best currently possible, they have limitations[1], therefore results may not capture the unique export patterns of the UK regions.
- Better quality estimates would require further improvements in the underlying source data – a key recommendation of the FAI report. DIT statisticians work very closely with data producers (ONS, HMRC) to improve the quality, timeliness and granularity of the underlying data sources.
Annex 5: constituency level data
The constituency level data (ODT, 179KB) is sourced from ONS Business Register Employment Survey (BRES) (2019), NISRA BRES (2019), ONS UK Input-Output Analytical Tables (2016), DIT Calculations.
Notes
The proportion of employees (2019 BRES ONS and NISRA) in each constituency that work in ‘export intensive sectors’ – defined as the top quartile of UK sectors that have the highest share of exports as a share of total domestic output at the national level (according to 2016 ONS input-output data).
This calculation does not account for within sector and across constituency differences in export intensity and so does not tell us how export intensive or how many jobs are supported by exports at the constituency level. See DIT (2021) ‘Local jobs, trade and investment’, for caveats and data coverage. NI estimates for NI as a whole and agriculture is excluded.
-
DIT, UK Trade in Numbers Pocketbook, February 2021. ONS (2021) UK trade: December 2020. ONS (2021) GDP first quarterly estimate, UK: October to December 2020. ↩
-
OECD, Trade in Value Added (OECD 2018). ↩
-
OECD, Trade in Value Added (OECD 2018). Note products can be goods and services. ↩
-
DIT estimates based on OECD TiVA data for 2015. OECD, Trade in Value Added (OECD 2018). Note products can be goods and services. ↩
-
OECD, The relationship between GVCs and Productivity (OECD 2015) (PDF, 2,075KB). ↩
-
OECD, Multinational enterprises and global value chains: New Insights on the trade-investment Nexus (OECD (2018). ↩
-
OECD, Trade in employment indicators (OECD 2018). ↩
-
FA (2021), Estimating the relationship between exports and the labour market in the UK ↩
-
FA (2021), Estimating the relationship between exports and the labour market in the UK (DIT/FAI 2021). Please see annex for caveats. 2016 data does not account for impact of COVID-19 or EU exit. ↩
-
FAI (2021), Estimating the relationship between exports and the labour market in the UK ↩
-
OECD, Trade and Jobs, Trade Policy Brief (OECD 2019). ↩
-
EU excludes UK. OECD (2019) Trade and Jobs, Trade Policy Brief (OECD 2019). ↩
-
DIT 2021, Estimating FDI and its impact in the United Kingdom. ↩
-
Burstein, A. and Vogel, J. (2017) International trade, technology, and the skill premium, Journal of Political Economy, 125(5), pp. 1356-1412. ↩
-
Bernard, A., and Jensen, J. (1997) Exporters, skill upgrading, and the wage gap, Journal of international Economics 42(1-2), pp. 3-31. ↩
-
OECD, Policy Priorities for International Trade and Jobs (OECD (2012). ↩
-
Schank, T., Schnabel, C., and Wagner, J. (2007) Do exporters really pay higher wages? First evidence from German linked employer–employee data, Journal of international Economics, 72(1), pp. 52-74. ↩
-
ONS (2020) Productivity measurement – how to understand the data around the UK’s biggest economic issue. ↩
-
DIT Analysis of ONS (2021). Comparing actual 2019 output per worker with simulated output per worker extrapolating 1997 to 2006 percentage growth rate in output per worker to 2019. ONS Output per worker data. ↩
-
Bloom, N., Draca, M., John Van Reenen, J. (2016) Trade Induced Technical Change? The Impact of Chinese Imports on Innovation, IT and Productivity, The Review of Economic Studies, 83(1), pp. 87–117. ↩
-
De Loecker, Jan. A note on detecting learning by exporting. No. w16548. National Bureau of Economic Research, 2010. ↩
-
ONS (2020) UK Foreign direct investment trends and analysis: August 2020. ↩
-
Girma, S., Görg, H., and Hanley, A. (2008) R&D and exporting: A comparison of British and Irish firms, Review of World Economics, 144(4) pp.750-773. Data is from 2002. ↩
-
See Annex for methodology and caveats. ↩
-
Fajgelbaum, P. D., and Khandelwal, A. K. (2016) Measuring the unequal gains from trade, The Quarterly Journal of Economics 131(3) pp. 1113-1180. ↩
-
UKTPO (2019) Winners and Losers from International Trade: What do we know and what are the implications for policy?, Briefing Paper 33. ↩
-
FAI (2021), Estimating the relationship between exports and the labour market in the UK (DIT/FAI 2021). ↩
-
DIT, Estimating the relationship between exports and the labour market in the UK (DIT/FAI 2021). ↩
-
Hale, G. and Xu, M. (2016) FDI Effects on the Labor Market of Host Countries, Federal Reserve Bank of San Francisco, Working Paper 2016-25. ↩
-
UKTPO (2019) Winners and Losers from International Trade: What do we know and what are the implications for policy?, Briefing Paper 33. ↩
-
Autor, D.H., Dorn, D. Hanson, G. H. Song, J. (2014) Trade Adjustment: Worker-Level Evidence, Quarterly Journal of Economics, pp.1799-1860. Autor, D.H., Dorn, D. and Hanson, G. H. (2013) The China Syndrome: Local Labor Market effects of Import Competition in the United States, American Economic Review, 103(6) pp.2121-2168. Autor, D. H., Dorn, D. and Hanson, G. H. (2016) The China Shock: Learning from Labor-market Adjustment to Large Changes in Trade, American Economic Review, Volume 8, pp. 205-240. ↩
-
Known in economics as hysteresis, see Duval, R., Eris, M. and Furceri, D. (2010) ‘Labour Force Participation Hysteresis in Industrial Countries: Evidence and Causes’, OECD Economics Department. ↩
-
World Trade Organization and International Labour Office (2017) Investing in skills for inclusive trade. ↩
-
OECD (2017) Making trade work for all, OECD Trade and Agriculture Directorate. ↩
-
Berman, E., Bound, J. and Griliches, Z. (1994). Changes in the demand for skilled labor within U.S manufacturing: Evidence from the annual survey of manufactures, Quarterly Journal of Economics, 109(2) pp. 367–397. ↩
-
Department for Transport analysis. HS2: Getting the best out of Britain, 2017. ↩
-
Moretti, E. (2010). Local Multipliers. American Economic Review, 100(2), pp.373-377. ↩
-
Overmann, H and Winters, A, L. (2006). Trade Shocks and industrial location: the impact of EEC accession on the UK. ↩
-
Autor, D.H., Dorn, D. Hanson, G. H. Song, J. (2014) Trade Adjustment: Worker-Level Evidence, Quarterly Journal of Economics, pp.1799-1860. Autor, D.H., Dorn, D. and Hanson, G. H. (2013) The China Syndrome: Local Labor Market effects of Import Competition in the United States, American Economic Review, 103(6) pp.2121-2168. Autor, D. H., Dorn, D. and Hanson, G. H. (2016) The China Shock: Learning from Labor-market Adjustment to Large Changes in Trade, American Economic Review, Volume 8, pp. 205-240. ↩
-
IMF, World Bank and WTO (2017) Making trade an engine for growth for all - The case for trade and for policies to facilitate adjustment. ↩
-
Hollweg, C. H., Lederman, D., Rojas, D. and Bulmer, E. R. (2014) Sticky feet, how labour market fictions shape the impact of international trade on jobs and wages, (The World Bank 2017). ↩
-
Gasiorek, M., Garrett, J. and Serwicka, I. UKTPO (2019). Winners and Losers from International Trade: What do we know and what are the implications for policy?, Briefing Paper 33. ↩
-
Autor, D.H., Dorn, D. Hanson, G. H. Song, J. (2014) Trade Adjustment: Worker-Level Evidence, Quarterly Journal of Economics, pp.1799-1860. ↩
-
Parro, F (2013) Capital–skill complementarity and the skill premium in a quantitative model of trade, American Economic Journal: Macroeconomics, 5(2) pp. 72–117. ↩
-
Levell, P. and Keiller, A. (2018) The exposure of different workers to potential trade barriers between the UK and EU, Institute for Fiscal Studies. ↩
-
OECD (2017) Making Trade Work for All, OECD Trade and Agriculture Directorate. ↩
-
Olabisi, M. (2020) Trade Shocks and youth jobs, IZA Journal of Labour Policy, 10(1). ↩
-
De Fraja, G., Matheson, J., and Rockey, J. (2021) Zoomshock: The geography and local labour market consequences of working from home, Covid Economics, Issue 64 pp. 1- 41. ↩
-
WTO and International Labour Office (2017) Investing in skills for inclusive trade. ↩
-
WTO and International Labour Office (2017) Investing in skills for inclusive trade. ↩
-
FAI (2021), Estimating the relationship between exports and the labour market in the UK ↩
-
DIT (2020) Inward investment results 2019 to 2020. ↩