Liver disease profiles: statistical commentary, April 2018
Published 4 April 2018

© Crown copyright 2018
This publication is licensed under the terms of the Open Government Licence v3.0 except where otherwise stated. To view this licence, visit nationalarchives.gov.uk/doc/open-government-licence/version/3 or write to the Information Policy Team, The National Archives, Kew, London TW9 4DU, or email: psi@nationalarchives.gov.uk.
Where we have identified any third party copyright information you will need to obtain permission from the copyright holders concerned.
This publication is available at https://www.gov.uk/government/statistics/liver-disease-profiles-april-2018-update/liver-disease-profiles-statistical-commentary-april-2018
New in this update
This update includes:
-
2 new indicators on hepatitis B incidence and hepatitis C detection rates feature in the liver disease profile
-
data for the financial years 2015 to 2016 and 2016 to 2017 have been updated for both the indicators relating to hepatitis B vaccinations and hepatitis C tests, given to eligible people entering drug misuse treatment
-
data for the financial year 2016 to 2017 has been added to the hospital admissions for alcohol-specific conditions indicator
Main findings
This update shows:
- in 2016 there were 453 cases of newly diagnosed acute hepatitis B in England
- people living in more deprived areas of England experience higher incidence rates of hepatitis B than those living the less deprived areas
- 8.1% of eligible persons, who entered drug misuse treatment, in England during April 2016 to March 2017, completed a course of hepatitis B vaccination within the year
- chronic hepatitis C detection rates ranged across England’s counties and UAs from 1.6 to 222.1 per 100,000 population in 2016
- in the financial year 2016 to 2017 in England there were 298,797 hospital admission episodes for alcohol-specific conditions
- the directly standardised rate of hospital admission episodes for alcohol-specific conditions for males in the financial year 2016 to 2017 was more than double that of females
- rates of hospital admission episodes for alcohol-specific conditions is highest in the north west region
Summary
We have introduced 2 new indicators to the liver profiles on hepatitis B incidence and hepatitis C detection rates to help give more context to their implications for the future management of liver disease care.
This profile also provides updated data to 2 existing indicators on the proportions of people who are in drug misuse treatment and are eligible for hepatitis B vaccination, or to receive a hepatitis C test. The new data relates to the financial years 2015 to 2016 and 2016 to 2017. For both indicators the back series data has also been refreshed.
2016 to 2017 financial year’s data has also been added to the indicator on hospital admissions for alcohol-specific conditions, all ages, directly age standardised rate per 100,000 population for males, females and persons.
Acute hepatitis B incidence rate
This indicator newly features in the liver profiles and is designed to measure the local burden of acute hepatitis B and is an indicator of ongoing transmission. Hepatitis B is vaccine preventable and an important health protection issue that can cause serious disease.
In 2016 the rate of newly diagnosed acute hepatitis B was 0.82 per 100,000 people in England. This represents 453 new cases identified within the year. Across the districts rates varied from 0 in several areas to 5.7 in Surrey Heath.
London region diagnosed the highest number of new cases (143) in the country, almost double that of the next highest number of cases (73) which was in the North West region.
Variation in incidence rate may reflect outbreaks, differences in underlying population or variation in vaccination uptake in at risk groups . People living in more deprived areas of England experience higher incidence rates of hepatitis B than those living the less deprived areas. (Figure 1)
Figure 1: Rate of new diagnoses of confirmed acute hepatitis B per 100,000 population, by deprivation deciles, England, 2016. Data partitioned by County and UA deprivation deciles in England, Index of Multiple Deprivation (IMD) 2015
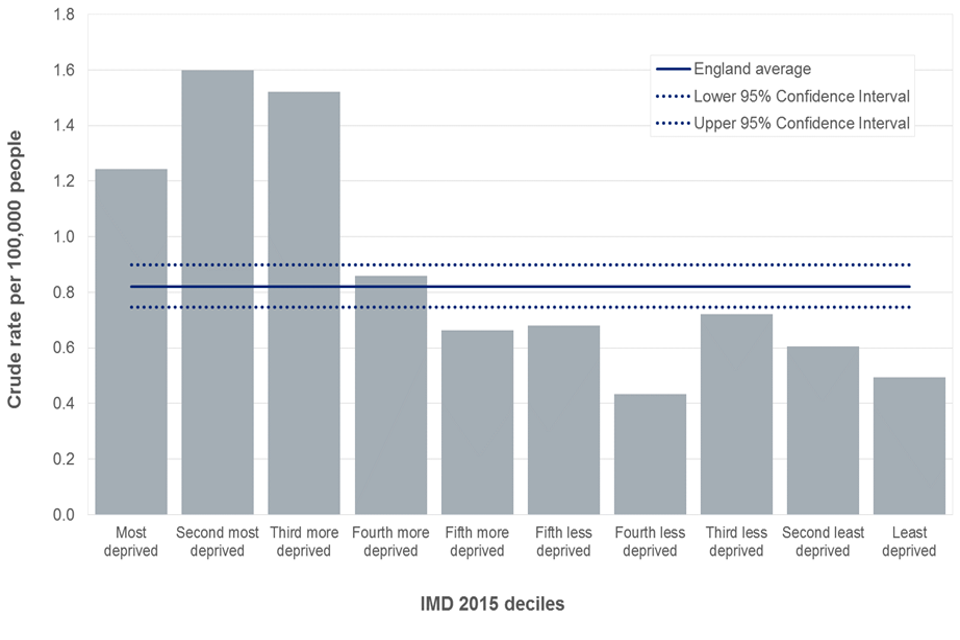
Bar chart showing rate of new diagnoses of confirmed acute hepatitis B per 100,000 population in England, 2016. Data is by County and unitary authority (UA) deprivation deciles in England using Index of Multiple Deprivation (IMD) 2015).
Bringing this indicator in the liver profiles allows users to compare it with other liver disease related indicators. An example of this is shown in Figure 2 where areas with a higher incidence of hepatitis B are shown to also have higher rates of hospital admissions for hepatitis B related end stage liver disease.
Figure 2: Comparison of acute hepatitis B incidence rate and the rate of hospital admissions for hepatitis B end stage liver disease, per 100,000 population, 2016
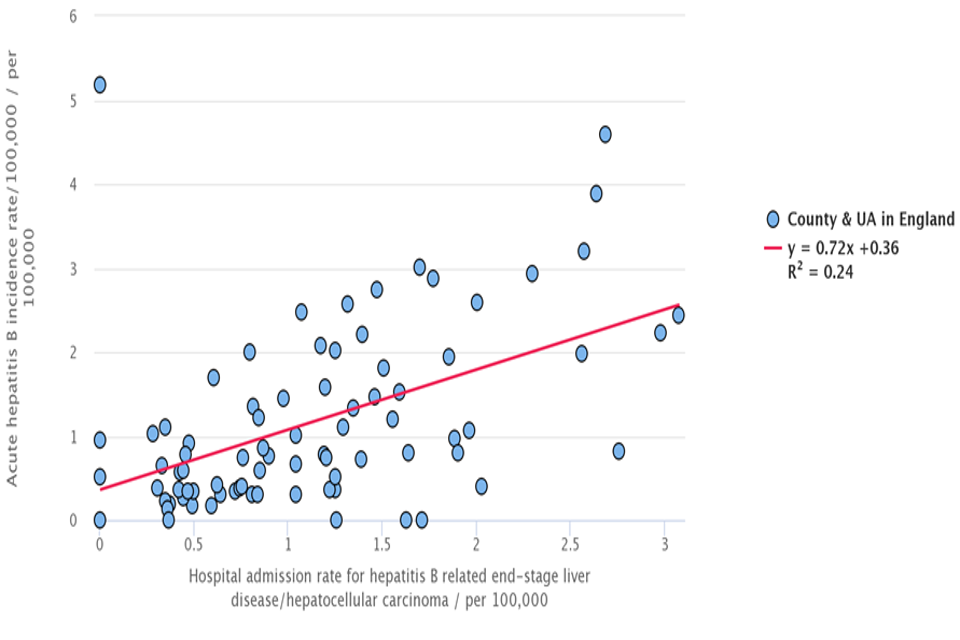
Scatter plot showing a comparison of acute hepatitis B incidence rate and the rate of hospital admissions by county and unitary authority in England, for hepatitis B end stage liver disease, per 100,000 population in 2016.
Percentage of eligible persons completing a course of hepatitis B vaccination
People who inject drugs are at a higher risk of contracting hepatitis B and C infections. This indicator reflects proportion of eligible people who were offered the hepatitis B vaccine and completed the course within the financial year. This indicator has been updated to provide new data for the financial years 2015 to 2016 and 2016 to 2017.
In England 8.1% (4,299 people) of eligible people entering drug misuse treatment completed a course of hepatitis B vaccination in the financial year 2016 to 2017. This trend has stayed at a similar level for the last 5 years. (Figure 3)
Figure 3: Box plot of the percentage of eligible persons, who entered drug misuse treatment, completing a course of hepatitis B vaccination, England, from financial year 2012 to 2013 up to financial year 2016 to 2017
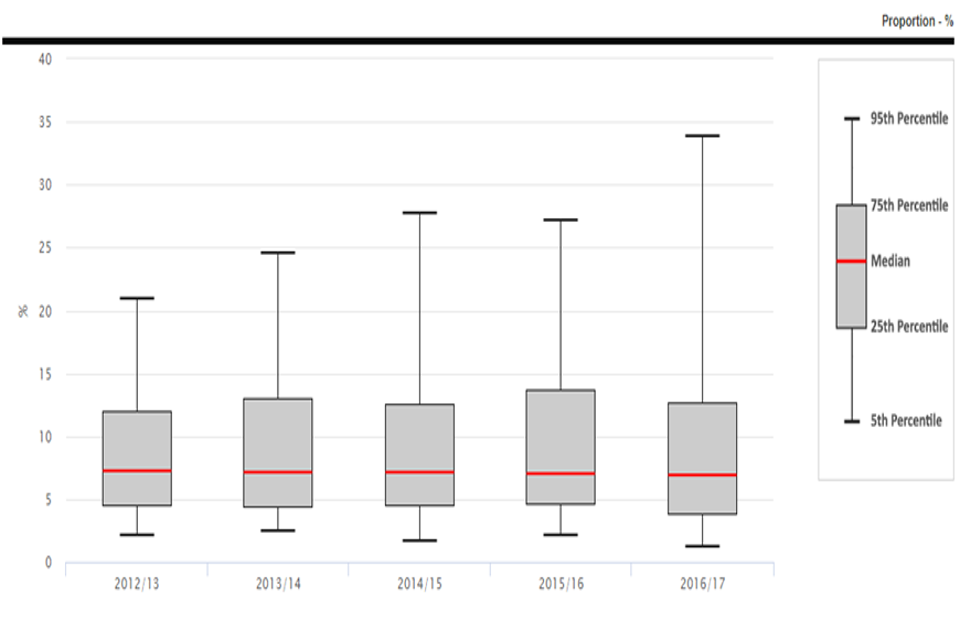
Box plot showing the percentage of eligible persons who entered drug misuse treatment, completing a course of hepatitis B vaccination in England from 2012 to 2013 up to 2016 to 2017
Across the country percentages varied with Redbridge UA in London having the highest proportion, 82.7% completing a course of hepatitis B vaccination within the treatment year. Many areas had 0% completion. The median level of completion was 6.9%.
Chronic hepatitis C detection rate
Hepatitis C is difficult to diagnose. It is estimated that about a third of people infected with hepatitis C virus will eventually develop liver cirrhosis, where normal liver tissue is replaced by scar tissue, accompanied with an increased risk of developing liver cancer. It is therefore useful to be able to view this indicator alongside other indicators within the liver profiles.
In 2016 the average detection rate for chronic hepatitis C was 19.7 per 100,000 population aged 1 and over in England. This represents 10,565 people.
Across the English counties and UAs, directly standardised detection rates per 100,000 population aged over 1, ranged from 1.6 reported in both Leicestershire county and the Wirral Metropolitan Borough and 222.1 in Hammersmith and Fulham London borough (Figure 4). Variation in detection rates may reflect differences in local testing activity for a given population as well as the underlying population (for example, larger proportion of risk groups, such as people who inject drugs).
Figure 4: Map of chronic hepatitis C detection directly standardised rate, 2016
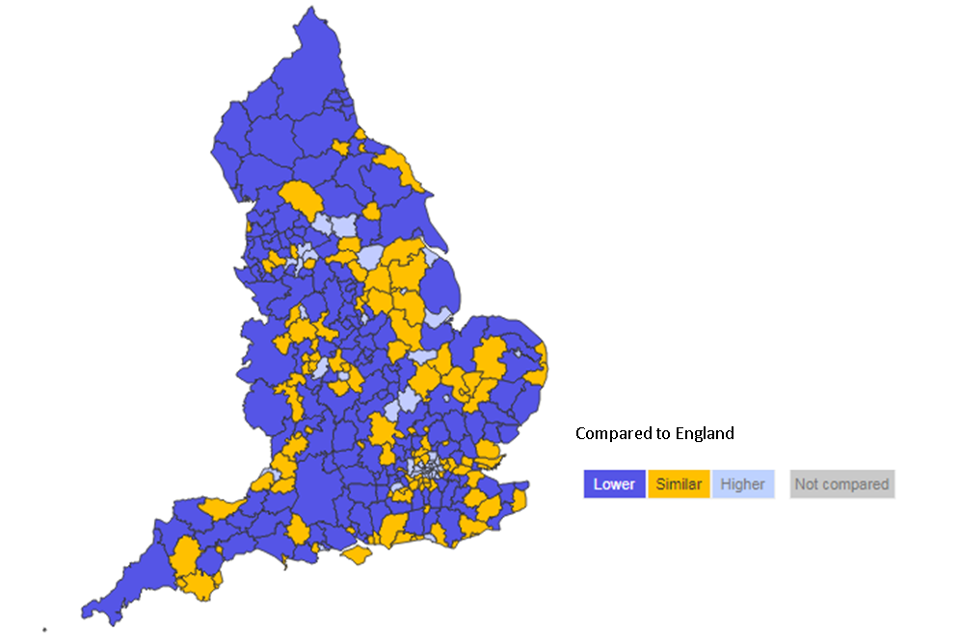
Map of chronic hepatitis C detection directly standardised rate across English countries and unitary authorities compared to England in 2016.
Percentage of eligible persons, who have injected drugs and are in drug misuse treatment, that have received a hepatitis C test
In England on average 83% (77,432 people) of eligible people aged over 18 in drug misuse treatment had received a hepatitis C test in the financial year 2016 to 2017. In Cumbria County almost 98% of eligible persons had received a test, whereas Plymouth UA had the lowest proportion (43%).
Figure 5: The variation in proportion of people receiving a hepatitis C test across England’s Counties and UAs, financial year 2016 to 2017
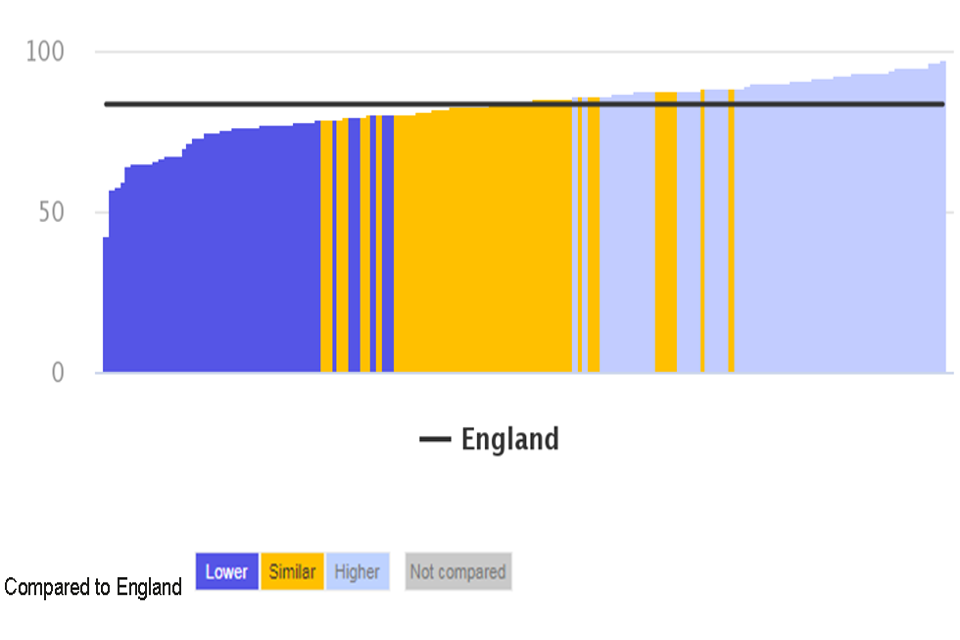
Chart showing the variation in the proportion of people receiving a hepatitis C test across England’s counties and unitary authorities, compared to England in 2016 to 2017.
Hospital admission episodes for alcohol-specific conditions
In England, the directly standardised rate for hospital admission episodes for alcohol-specific conditions was 563 per 100,000 people. For males this figure was 784 per 100,000 which was more than double the rate of females at 355 per 100,000.
People living in the poorest areas of the county have a much higher (793 per 100,000) admission rate for alcoholic specific conditions than those in more affluent areas (354 per 100,000) (Figure 6).
Figure 6: Directly standardised rate of hospital admission episodes for alcohol-specific conditions per 100,000 people of all ages, financial year 2016 to 2017 by level of deprivation, at a district UA level
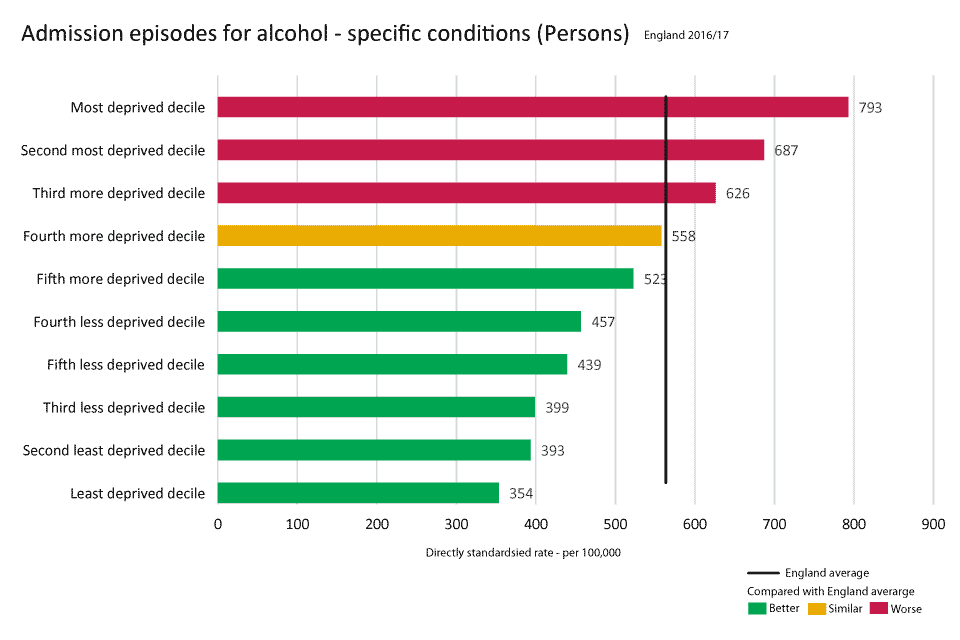
Horizontal bar chart showing directly standardised rate for hospital admission episodes for alcohol-specific conditions per 100,000 people of all ages in 2016 to 2017, by level of deprivation at a district unitary authority level.
At a district level, rates of alcohol-specific admissions were lowest in Rochford (232 per 100,000). The five areas with the highest rates were all in the North West (St. Helens 1,118, Wirral 1,172, Liverpool 1,198, Blackpool 1,359, Salford 1,565). Rates in the North West were more than double that of the East of England (Table 1).
Table 1: Directly standardised rate of hospital admission episodes for alcohol-specific conditions per 100,000 people of all ages, financial year 2016 to 2017 by Region
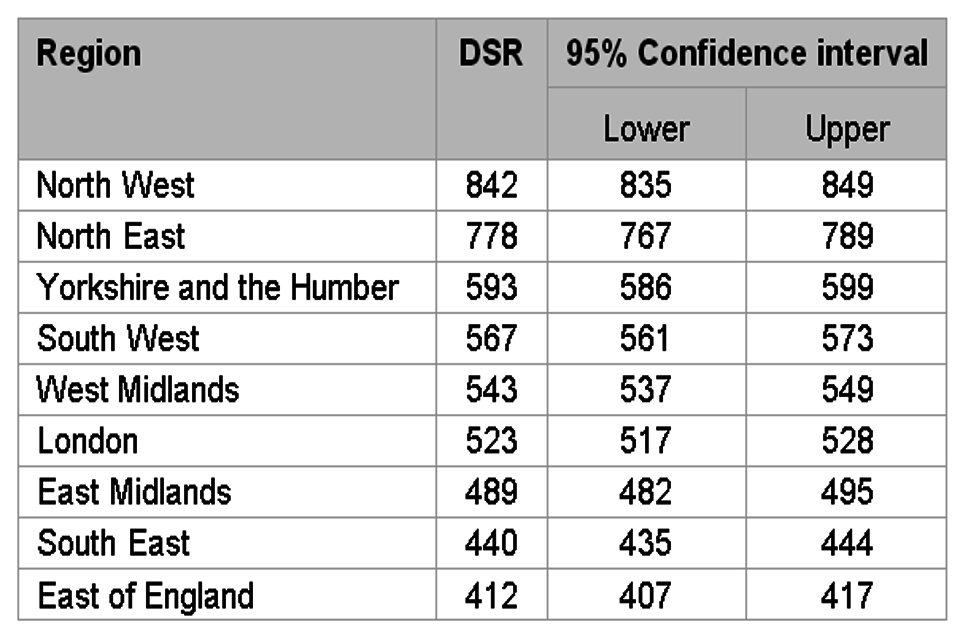
Table of directly standardised rate of hospital admission episodes for alcohol-specific conditions, per 100,000 people of all ages, in 2016 to 2017, by region
Background and further information
Liver disease is almost entirely preventable with the major risk factors: alcohol, obesity and hepatitis B and C accounting for up to 90% of cases.
The liver disease profiles provide an invaluable resource relating to one of the main causes of premature mortality nationally; a disease whose mortality rates are increasing in England, while decreasing in most EU countries. The local authority profiles will support the development of Joint Strategic Needs Assessments and work of health and wellbeing boards presenting local key statistics and highlighting questions to ask locally about current action to prevent liver disease.
The website contains data for upper tier local authorities, former Government Office regions, England and where available lower tier local authorities.
The profiles, aimed at primarily LAPH were developed following recommendations in March 2014 from the All-Party Parliamentary Hepatology Group (APPHG) inquiry into improving outcomes in liver disease. Recommendations the LA profiles aim to address were:
- PHE should address the worrying lack of data on all aspects of liver disease by developing a dataset to allow performance management of liver disease across CCGs, local authorities and health and wellbeing boards
- health and wellbeing boards should monitor early detection, treatment and mortality rates from liver disease; assessing progress on tackling liver disease should be made a mandatory part of the joint strategic planning process for CCGs and local authorities
Further details about the profile methodology are available within the definitions section of the online version of the liver disease profile.
Responsible statistician, product lead: Liz Rolfe, Julia Verne
For queries relating to this document, please contact: liverdisease@phe.gov.uk