Litter and littering in England 2017 to 2018
Updated 13 January 2022
Applies to England

© Crown copyright 2022
This publication is licensed under the terms of the Open Government Licence v3.0 except where otherwise stated. To view this licence, visit nationalarchives.gov.uk/doc/open-government-licence/version/3 or write to the Information Policy Team, The National Archives, Kew, London TW9 4DU, or email: psi@nationalarchives.gov.uk.
Where we have identified any third party copyright information you will need to obtain permission from the copyright holders concerned.
This publication is available at https://www.gov.uk/government/publications/litter-and-littering-in-england-data-dashboard/litter-and-littering-in-england-2017-to-2018
This publication explains the government’s approach to understanding the extent of litter and littering in England.
These figures are based on data from 2017 to 2018 and unless otherwise indicated, data relates to the period April 2017 to March 2018.
This is the period immediately before, and immediately after the publication of the Litter Strategy in April 2017. It is therefore too soon to see any trends, or to attribute any changes to the Litter Strategy itself. The dashboard will continue to evolve as more data sources become available.
We have summarised some key figures in the following dashboard:
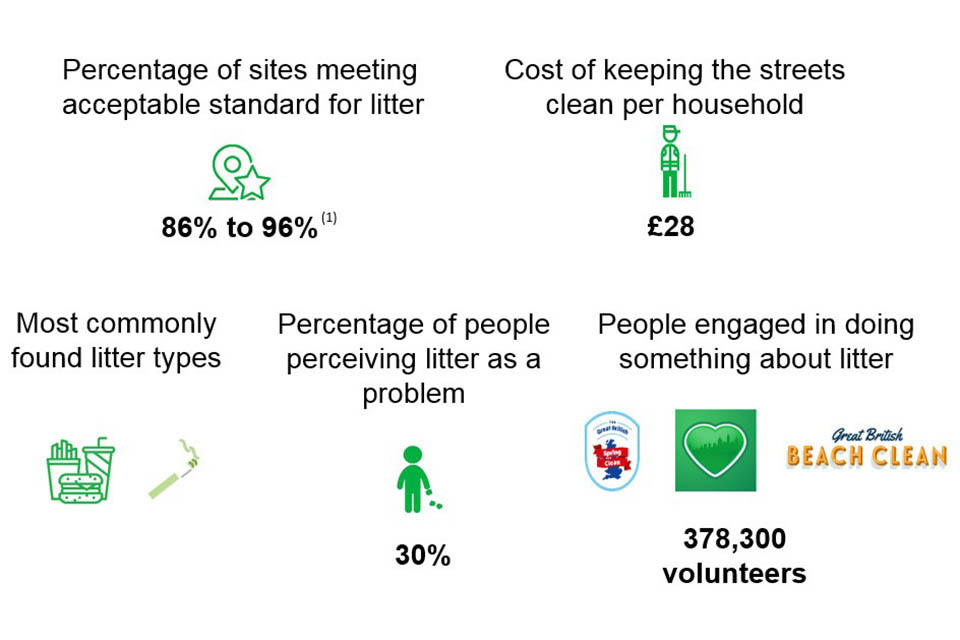
Litter dashboard 2017 to 2018
(1) Based on figures from Keep Britain Tidy and Association for Public Service Excellence
Litter on the ground and site cleanliness
Usually, the more litter there is on the ground the greater the impact it has on how clean a place appears to be, which in turn can affect people’s willingness to drop litter there. We use data from 4 sources to understand how much litter is found on the ground in England, and what types of items are most often found on our streets and beaches.
Measuring litter
There’s no one perfect way to measure litter – for example:
- if we measured litter by weight, we wouldn’t know if we were counting a small number of heavy items, or a large number of light items
- if we measured the number of litter items this wouldn’t necessarily reflect the impact on the way a place looks – a small number of large items might make a place appear more littered than a large number of small items
- measuring only the presence or absence of litter does not show how long the litter has been there, or how much of it is present
We are therefore publishing a group or ‘dashboard’ of indicators. The ‘dashboard’ covers litter from 5 angles:
- litter on the ground (including beach litter)
- public perception of litter
- cleanliness of public places
- involvement of the public in doing something about litter
- the cost to the public of keeping the streets clean
The dashboard is not a definitive measure of litter. It illustrates what is happening now using data we have available, by looking at litter from different angles and bringing different figures together in one document.
Over time we may include additional indicators or improve existing ones if we find new suitable data emerging.
These indicators should be viewed as a group (to keep each one in context). For example, an increase in reported incidents could be because more people are getting involved in tackling litter and using an app to report problems, rather than an actual increase in litter on the ground.
All data refers to England only, unless stated otherwise.
How were the indicators chosen?
The Litter Strategy Working Group for Data and Monitoring has identified key indicators that cover litter from different angles and so are suitable for inclusion in the dashboard and observing changes over time.
How much litter is there?
Survey data from Keep Britain Tidy and the Association for Public Service Excellence (APSE)
Both Keep Britain Tidy, in their Local Environmental Quality Survey of England, and the Association for Public Service Excellence looked at the cleanliness of sites within England. Sites are graded by their level of cleanliness:
- grade A meaning no litter is present
- grade B meaning - the area is predominantly free with some minor instances of litter
- grade C meaning widespread distribution of litter and refuse, with minor accumulations
- grade D meaning heavily affected with litter, with significant accumulations
Grades A and B are classed as meeting an acceptable standard.
As the sample selection differs between the two surveys, the percentage of sites meeting an acceptable level of cleanliness is shown as a range in the dashboard. For 2017 to 2018, this range is from 86% to 96%.
Keep Britain Tidy’s data is based on an annual survey of site cleanliness based on a sample of sites which are designed to be representative geographically and of different levels of deprivation in England, based on the Index of Multiple Deprivation. The most recent survey, 2017 to 2018, covered 25 local authorities. In 2017 to 2018 the average number of sites that were graded as acceptable or higher was 86%.
Source: Keep Britain Tidy Litter in England survey 2017-2018
The Association of Public Service Excellence collects site cleanliness data from a number of local authorities who voluntarily provide the data. In 2017 to 2018 data was collected from 46 local authorities. Although the data was from a self-selecting sample of local authorities, the sample represented a range of geographical regions and levels of deprivation in England, based on the Index of Multiple Deprivation. In 2017 to 2018 the average number of sites that were graded as acceptable or higher was 96%.
Source: APSE Street Cleanliness Report
Limitations of these datasets:
- site cleanliness measures presence of litter and how conspicuous litter is, not the quantity or composition
- differences in sampling between this year and last mean that this year’s data cannot be directly compared with last year’s, or any other previous year
Great British Beach Clean data
Marine Conservation Society’s (MCS) Great British Beach Clean is an annual beach clean, run in September, where volunteers, either individuals or groups, meet to collect litter from beaches. The data is recorded by the groups as they are collecting. The data is analysed to show how many items were present per 100 metres of beach. In the Great British Beach Clean 2017, in England, there were 911 items of litter per 100 metres. This compares to 802 items of litter per 100 metres in 2016.
Source: Marine Conservation Society
Limitations of this data:
- the weather before and during the beach clean will affect how much the beach has been used prior to the clean and how much litter has been washed ashore during bad weather
- beaches selected for cleaning are not consistent each year and tend to be situated in popular urban areas, and are dependent on volunteers being available
- these figures cannot be directly compared with those for 2016 to 17 because the methodology used by Defra to calculate them has changed, to bring it in line with MCS methodology
Reports made through the Love Clean Streets app
Around 2,700 people used the Love Clean Streets app to report litter incidents in the year ended 31 March 2018. In total they reported around 5,700 incidents of litter from 98 local authorities.
Source: BBits – Love Clean Streets, unpublished.
Limitations of this data:
- these figures cannot be directly compared with those published last year because users differ each year - new users start using the app or existing users stop using it
- this data is not geographically or nationally representative: users are (and therefore also reports) tend to be concentrated in more densely-populated areas, so they are not a representative sample of sites across the country
- the app can also be used for reporting other issues (such as fly-tipping), so its usage for litter can vary. If users are more preoccupied by other issues in their local area, usage of the app to report littering may decrease
- the quantity reported in each report will differ so some reports will be multiple amounts of litter, others will be one individual item
What type of litter is there?
Keep Britain Tidy - Litter in England survey 2017 to 2018
Data on the most commonly-found types of litter was recorded as part of Keep Britain Tidy’s Litter in England survey. In 2018, smoking-related litter was the most commonly-found type of litter (79% of sites), followed by confectionery packs (60%) and non-alcoholic drinks-related (52%).
| Types of litter | Percentage of litter recorded |
|---|---|
| Smoking-related litter | 79% |
| Confectionery packs | 60% |
| Non-alcoholic drinks-related | 52% |
| Fast food-related | 33% |
| Alcoholic drinks-related | 25% |
| Packaging | 25% |
| Snack packs | 20% |
| Vehicle parts | 14% |
| Discarded food/drink | 12% |
| Clothing | 11.8% |
Source: Keep Britain Tidy Litter in England survey 2017-2018
Description of litter items used in the above chart:
Alcoholic drinks-related – all items associated with alcoholic drinks. This includes cans, bottles, wine cartons, identifiable bottle tops and ring pulls
Confectionery packs – all types of confectionery material, such as sweet wrappers, chocolate wrappers, lollipop/iced lollipop sticks, chewing gum wrappers, but not the confectionery itself.
Discarded food/drink – small amounts of dropped or spilt food and drink.
Fast food-related – packaging and paraphernalia related to freshly prepared ready-to-eat food and drink that is eaten on the go. This includes wrappings, boxes, drinks containers, plastic straws, plastic cutlery, branded paper napkins, all sandwich cartons and salt sachets
Non-alcoholic drinks related – all items associated with non-alcoholic drinks, including cans, bottles, cartons, identifiable bottle tops and ring-pulls.
Packaging - any packaging material which is deemed to have been dropped by a member of the public, an example of packaging is cellophane wrapping
Smoking-related litter – all types of items discarded by people using tobacco products, including cigarettes and cigarette ends, cigars, matchsticks/boxes, cigarette and cigar boxes or wrappers, disposable lighters
Snack packs – all items of packaging litter that are associated with pre-baked or pre-prepared snack foods, for example crisp packets, biscuit packaging and cake wrappers.
Vehicle parts – these include any part of a motorised vehicle, including bodywork, engine parts, number plates, wheel trims, exhaust (or part(s) of), and light or window glass, which appear to have originated from a vehicle
Limitations of this data:
- this dataset records whether or not a particular type of litter was found on each site (for example, how often types of litter are found). It does not record how many items of that type were present on each site
Great British Spring Clean reports
All participants in the Great British Spring Clean (GBSC) are encouraged to report data on the types of litter they find. In 2018, the most commonly-found type of litter by participants in the Great British Spring Clean 2018 was non-alcoholic drinks-related (77% of participants), followed by alcoholic drinks-related (61%) and fast-food litter (54%).
| Types of litter | Percentage of litter recorded |
|---|---|
| Non-alcoholic drinks-related | 79% |
| Alcoholic drinks-related | 61% |
| Fast food-related | 54% |
| Wrappers from sweets, crisps, chocolate | 49% |
| Dog faeces | 19% |
| Smoking-related litter | 18% |
| Plastic bags | 18% |
| Chewing gum | 2% |
| Paper tissues | 2% |
Limitations of this data:
- data reported by participants is not independently quality-assured or verified. There may be some inconsistency in how types of litter are classified by participants. Not all participants report this data
- some participants may choose to prioritise collection or reporting of certain types of litter (for example, single-use plastic or drinks containers) which may affect the frequency with which some types of litter are recorded
- this data is not geographically or nationally representative: GBSC litter-picks take place at locations chosen by users and not a representative sample of sites from across the country
- this data relates to litter collected in March 2018 as part of the Great British Spring Clean: the composition of litter can vary seasonally, and these figures may not reflect the composition of litter at other times of year
Great British Beach Clean
The Great British Beach Clean looks at type of litter found, and standardises it to how many items are found per 100 metres of beach. In 2017, in England, the top item found was small pieces of plastic and polystyrene (239 per 100 metres), then packets - crisps, sweets, lolly, sandwich (54 per 100 metres), then cigarette stubs (49 per 100 metres).
| Types of litter | How many items found (per 100 metres of beach) |
|---|---|
| Plastic/polystyrene pieces | 239 |
| Packets (crisp, sweet, lolly, sandwich) | 55 |
| Cigarette stubs | 49 |
| Caps and lids | 46 |
| Glass | 37 |
| String/cord | 36 |
| Cotton bud sticks | 31 |
| Fishing line | 24 |
| Cutlery, trays and straws | 22 |
| Fishing net | 17 |
Source: Marine Conservation Society
Limitations of this data:
- the weather before and during the beach clean will affect how much the beach has been used prior to the clean and how much litter has been washed ashore during bad weather
- beaches selected for cleaning are not consistent each year and tend to be situated in popular urban areas, and are dependent on volunteers being available
- these figures cannot be directly compared with those for 2016 to 17 because the methodology used by Defra to calculate them has changed, to bring it in line with MCS methodology
How much does littering cost?
In 2017 to 2018 it cost local authorities £663 million or £28 per household to keep our streets clean. This figure does not include spending by other authorities whose role involves clearing litter, such as Highways England.
Source: MHCLG data
How big a problem do people think litter is?
In April 2017 to March 2018, 30 per cent of people in England said there was a very or fairly big problem with litter and rubbish in their area. This has been a fairly consistent picture with the figure changing little in recent years.
Source: Office for National Statistics
How engaged are people in doing something about it?
Around 371,000 people took part in the Great British Spring Clean throughout the UK, around 4,500 people took part in the Great British Beach Clean in England and 2,700 users reported litter via the Love Clean Streets App.
Limitations of this data:
- the number of volunteers for these activities might include the same people more than once, if they attend more than one clean up or use the app