Litter and littering in England 2016 to 2017
Updated 13 January 2022
Applies to England

© Crown copyright 2022
This publication is licensed under the terms of the Open Government Licence v3.0 except where otherwise stated. To view this licence, visit nationalarchives.gov.uk/doc/open-government-licence/version/3 or write to the Information Policy Team, The National Archives, Kew, London TW9 4DU, or email: psi@nationalarchives.gov.uk.
Where we have identified any third party copyright information you will need to obtain permission from the copyright holders concerned.
This publication is available at https://www.gov.uk/government/publications/litter-and-littering-in-england-data-dashboard/litter-and-littering-in-england-2016-to-2017
This publication explains the government’s approach to understanding the extent of litter and littering in England. These figures are based on data from 2016 to 2017 and unless otherwise indicated, data relates to the period April 2016 to March 2017.
We have summarised some key figures in the following dashboard:
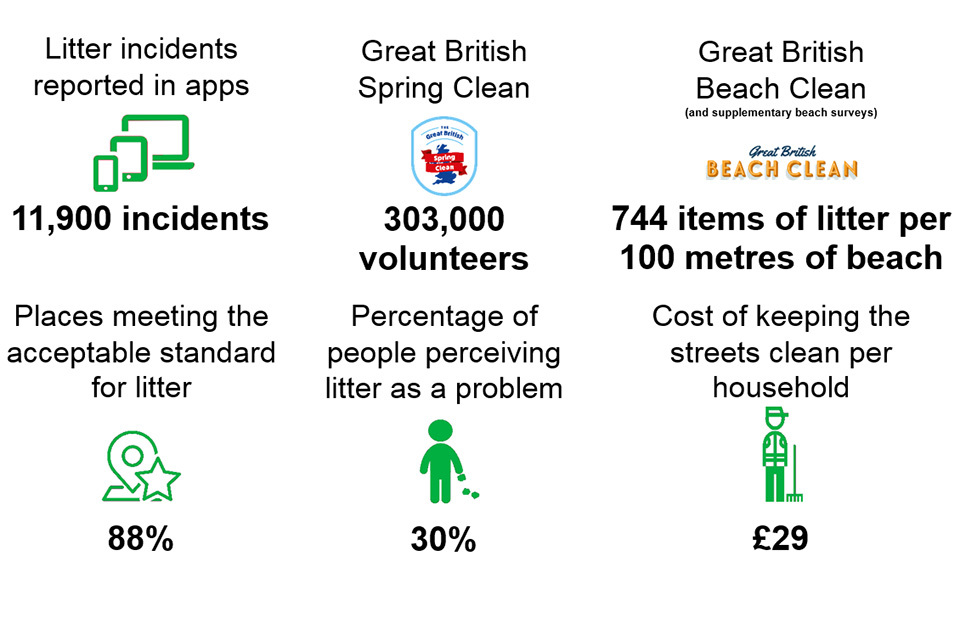
Litter dashboard 2016 to 2017
Changes in these numbers over time will help to inform policy development, and assess progress towards our goal of achieving a substantial reduction in litter and littering.
Our Litter Strategy for England shows that litter is an important national issue. We need to understand how litter affects England. We want to do so in ways that are impartial, affordable and statistically reliable.
In order to reduce litter and littering, we want to change people’s behaviour, not simply to clean up litter:
Effective cleaning ► less litter ► a cleaner environment ► improved perception ►less littering ►less litter ► a cleaner environment ► improved perception ……and so on
Measuring litter
There’s no one perfect way to measure litter - for example:
- if we measured litter by weight, we wouldn’t know if we were counting a small number of heavy items, or a large number of light items
- if we measured the number of litter items this wouldn’t necessarily reflect the impact on the way a place looks - a small number of large items might make a place appear more littered than a large number of small items
- measuring only the presence or absence of litter does not show how long the litter has been there, or how much of it is present
We are therefore publishing a group or ‘dashboard’ of indicators. The ‘dashboard’ covers litter from 5 angles:
- litter on the ground (including beach litter)
- public perception of litter
- cleanliness of public places
- involvement of the public in doing something about litter
- the cost to the public of keeping the streets clean
The dashboard is not a definitive measure of litter. It illustrates what is happening now using data we have available, by looking at litter from different angles and bringing different figures together in one document.
Over time we may include additional indicators or improve existing ones if we find new suitable data emerging.
These indicators should be viewed as a group (to keep each one in context). For example, an increase in reported incidents could be because more people are getting involved in tackling litter and using an app to report problems, rather than an actual increase in litter on the ground.
All data refers to England only.
How the indicators were chosen
The Litter Strategy Working Group for Data and Monitoring has identified key indicators that cover litter from different angles and so are suitable for inclusion in the dashboard and observing changes over time.
Litter on the ground, including beach litter
Litter is an eyesore and can be harmful to wildlife. Usually, the more litter there is on the ground the greater the impact. It is important therefore to have at least one indicator on the amount of litter in the dashboard.
App data on incidences of litter
Mobile phone apps, such as Love Clean Streets (other apps are available which carry out similar functions), are used by members of the public, local authority employees and waste management contractors to report incidents of litter to the relevant local authority.
Around 3,800 people used the Love Clean Streets app to report litter incidents in the year ended 31 March 2017. In total they reported around 11,900 incidents of litter from 151 local authorities.
By providing a picture of the level of litter incidents recorded on mobile phone apps, the data helps us understand where litter is typically found and people’s level of engagement with it. Over time the data will give us a better picture of how these are changing. The Litter Strategy for England contains a commitment to “promote the use of reporting apps to help people report litter problems and enable speedy resolution”, so we hope to see usage increase over time, improving the reliability of this data.
The app data has some limitations. For example, users (and therefore also reports) tend to be concentrated in more densely-populated areas, so they are not a representative sample of sites across the country.
Great British Spring Clean data
The Litter Strategy commits government to support national clean-up days. We therefore welcomed the announcement by Keep Britain Tidy of their intention to run a new annual clean‑up campaign, called “The Great British Spring Clean”.
The first Great British Spring Clean was held in March 2017, and involved at least 50 litter pick-up groups in England who used the Love Clean Streets app to record and count the litter collected. (Defra provided some funding support through a small grant to enable recording of the number of litter items collected, and to help develop the app for use in future events.)
Because this event will be repeated annually and at the same time of year, the data from it can help us understand whether litter is increasing or decreasing, after allowing for any change in the number of volunteers.
Figure 1: Litter recorded on mobile phone apps in the Great British Spring Clean, 3 to 5 March 2017
| Litter | Percentage of litter recorded (3,226 items in total) |
|---|---|
| Food and food packaging | 23% |
| Alcoholic drinks | 22% |
| Non-alcoholic drinks | 20% |
| Other, including tissues | 13% |
| Smokers’ litter | 12% |
| Chewing gum and wrappers | 5% |
| Dog faeces | 5% |
Source: Keep Britain Tidy, Love Clean Streets
Description of litter items used in the above chart:
Alcoholic drinks-related
All items associated with alcoholic drinks; this includes cans, bottles, wine cartons, identifiable bottle tops and ring pulls, labels from bottles and beer/spirit/shot glasses.
Chewing gum and wrappers
Discarded, chewed chewing gum that has not been squashed into the pavement. This could include gum stuck to litter bins, posts or other street furniture.
Dog faeces and bagged dog faeces
Dog faeces that are placed in a bag and left, whether the bag is on the ground or in a shrub or tree.
Food and food packaging
Small amounts of dropped or spilt food and drink. If there is evidence that it has been discarded from a food outlet or retail premises, it is classified as commercial waste. If the amounts of spilt food or drink are deemed large enough to attract vermin or produce an unpleasant odour due to decay, then they should be classified as putrescible waste.
All items of packaging litter (excluding the contents) that are associated with pre-baked or pre-prepared snack foods, for example crisp packets, biscuit packaging, cake wrappers or containers.
Packaging and paraphernalia related to freshly prepared, ready-to-eat food and drink, which is dropped by customers while sitting in, or passing through, an area. For example wrappings, boxes, drinks containers, plastic straws, plastic cutlery, branded paper napkins, all sandwich cartons and salt sachets. Fast-food premises include hot food takeaway premises, coffee shops, and all other retail outlets that sell pre-prepared foods (with short shelf lives) in a format that can be consumed in public places, including bakeries, supermarkets and mobile catering units.
Non-alcoholic drinks-related
All items associated with non-alcoholic drinks for example cans, bottles, cartons, identifiable bottle tops and ring-pulls, straws and labels from bottles. This excludes those items arising from fast food outlets, which should be classified as fast food litter.
Smokers’ materials
All types of items discarded by people using tobacco products, for example cigarettes and cigarette ends, cigars, matchsticks and matchboxes, cigarette and cigar boxes or wrappers, disposable lighters.
Other
All other items of litter.
Data on beach litter
The Marine Conservation Society organises the Great British Beach Clean each September. Volunteers across the country participate in beach cleans and record data on the litter collected.
The data in figure 2 below shows information on the types of litter collected on beaches in England by the 2016 Great British Beach Clean. This data has been supplemented with data from quarterly surveys carried out by the Marine Conservation Society, for the EU Marine Strategy Framework Directive, for the four quarters from March 2016 to February 2017.
The dataset contains 236 reports where 1 report equals a litter count along a 100 metre stretch of beach. The dataset has data from 62 local authorities.
Figure 2: Litter recorded in the Great British Beach Clean 2016 per 100 metres of beach, and from quarterly surveys of beaches in England
| Litter type | Number of items per 100 meters of beach |
|---|---|
| Plastic and polystyrene | 546 |
| Paper | 85 |
| Metal | 40 |
| Sanitary | 33 |
| Glass | 23 |
| Other** | 23 |
| Cloth | 12 |
| Rubber | 11 |
** includes wood, pottery, medical waste, pollutants and dog faeces. Source: Marine Conservation Society GBBC 2016 Report
Public perception of litter
This indicator has been chosen for the dashboard because the public’s perception of litter is important. Where people perceive that a site is badly littered they are more likely to litter themselves.
Perceptions of litter can lead to a reduction in pride in the area and give rise to a fear of crime (The Little Book of Litter - Keep Britain Tidy). Surveys have consistently shown that people rate litter as a high priority issue for the local environment (Local Environmental Quality: Valuing the neighbourhood in which we live). So it is important that we record perceptions of litter as well as actual littering.
In April 2016 to March 2017 30 per cent of people in England said there was a very or fairly big problem with litter and rubbish in their area. This has been a fairly consistent picture with the figure changing little in recent years.
Data collected via the Crime Survey for England and Wales is published as National Statistics. The data on perceptions around litter and littering are from a sample of the general population, not just victims of crime.
Source: ONS data
Cleanliness of public places
The general appearance and cleanliness of a public place from litter is important and measuring the level of cleanliness of public places provides a helpful metric.
Percentage of sites at an acceptable standard for litter
The statutory Code of Practice on Litter and Refuse sets the standards that councils and other land managers are expected to achieve when clearing their land of litter. The Code classifies sites based on four grades (A to D), where B or above (defined as “predominantly free of litter apart from some small items”) is classed as acceptable.
Keep Britain Tidy carried out an independent national survey from 2001 to 2015 which provided information on cleanliness standards across England. The last data set published by Keep Britain Tidy was for 2014 to 2015. Keep Britain Tidy has since carried out a survey in 2017 to 2018, meaning the next version of the dashboard will be able to utilise both this data and data from local authorities provided by the Association of Public Service Excellence’s (APSE) performance networks as the indicator for places meeting the acceptable standard for litter.
Currently the only data sets available are those submitted by local authorities. Some local authorities choose to voluntarily submit data each year on their performance against those standards to the APSE, for the Performance Networks benchmarking service.
This is a self-selected sample from local authorities who record and share their data. The data collection method is robust and the data comes from a spread of local authorities from the north to the south of England. However, due to sampling constraints, this data can only be used as an indication of standards of those local authorities who have submitted data, and is not necessarily nationally representative.
The 2016 to 2017 data comes from 32 local authorities. This has been added to by data from a supplementary survey which targeted some areas not covered by citizen science data. In that survey, site cleanliness results were collected from 12 local authorities. The areas were as geographically diverse as possible and the sample covered a variety of land use types and reflected variance in social deprivation (Source: KSB report).
The combined result is that when averaged across the 44 local authorities, 88 per cent of sites were at an acceptable standard for litter.
Historical data on local environmental quality can be found on the Keep Britain Tidy website. Comparisons should not be made between the APSE and Keep Britain Tidy data, however, due to differences in samples.
We recognise the limitations in the current data in terms of its comprehensiveness, and look forward to potentially improving this from 2018 with data to be supplied by both APSE performance networks and Keep Britain Tidy.
Getting people involved
There are already huge numbers of enthusiastic and dedicated volunteers who carry out litter‑picking across England, as individuals or as members of local groups.
We want to recognise the contribution made by volunteers, as well as to understand how many people are taking part in these activities.
Data on numbers of participants in organised events
This indicates the willingness of people to engage voluntarily in organised events such as litter picks. For example, in 2016 to 2017 around 303,000 people participated in the Great British Spring Clean and a further 4,000 in the Great British Beach Clean.
Data on numbers of app users
This provides an additional indication of change in the level of engagement by people who are trying to do something about litter. In April 2016 to March 2017, for the Love Clean Streets app, it was 3,800 people.
The cost of keeping the streets clean
Litter doesn’t just cost the environment, it also costs us directly as the public has to pay for it to be cleaned up.
National (Official) statistics are published each year showing how local authorities have spent their money, including on activities such as street cleaning. The data is published by authority, as well as a national figure.
This data includes the cost of cleaning up litter, but also includes other activities such as emptying public bins, clearing natural detritus and removing fly-tipped waste from public land. It does not include the cost of removing litter from roads and other highways.
The indicator we are using for the dashboard is net current (ongoing) expenditure. This measures how much money councils are spending to clean up and deal with litter.
In 2016 to 2017 it cost local authorities £682 million or £29 per household to keep our streets clean. In addition Highways England spends at least £6 million a year on collecting litter from the Strategic Road Network.
Source: MHCLG data
Icon credit: Clean area icon by Chameleon Design from Noun Project. Street cleaner icon by Piotrek Chuchla from Noun Project. Litter icon and technology icon made by Freepik from www.flaticon.com.