
UK startups & VC landscape evidence pack (HTML)
Updated 28 July 2026

© Crown copyright 2026
This publication is licensed under the terms of the Open Government Licence v3.0 except where otherwise stated. To view this licence, visit nationalarchives.gov.uk/doc/open-government-licence/version/3 or write to the Information Policy Team, The National Archives, Kew, London TW9 4DU, or email: psi@nationalarchives.gov.uk.
Where we have identified any third party copyright information you will need to obtain permission from the copyright holders concerned.
This publication is available at https://www.gov.uk/government/publications/letter-to-the-prime-minister-on-investment-in-innovative-science-and-technology-companies/uk-startups-vc-landscape-evidence-pack-html
1. Introduction
In January 2026, the Department for Science, Innovation and Technology (DSIT) and the Council for Science & Technology (CST) commissioned Dealroom to produce a snapshot of the UK’s startup and VC landscape.
2. Methodology
The report provides an overview of recent trends in VC investment, company valuations, and startup outcomes, based on Dealroom’s proprietary VC data. It is intended to inform understanding of the UK’s high‑growth startup ecosystem rather than provide a comprehensive assessment of the wider economy. Data for this report was collected in March 2026. Unless otherwise stated, all figures and charts reflect information available as of the end of December 2025.
- Startup Definition: Companies designed to grow fast founded since the information age (since 1990). Generally, such companies are VC-investable businesses.
- Venture Capital (VC): VC investment includes the following equity rounds: Convertible – Angel – Early VC – Growth Equity VC – Late VC – Media for Equity – Private Placement- VC: Seed – Series A – Series B – Series C – Series D+.
VC investments exclude debt, non-equity funding, lending capital and grants. Based on round size, investment is also divided into 3 main categories:
-
Early-stage investment: Investment raised between $0-15 million.
-
Breakout stage investment: Investment raised between $15-100 million.
-
Late-stage investment: Investment of $100 million+.
- Source of Capital: Source of capital by investor type and investor location is provided based on deal value, and percentages exclude undisclosed investors.
- Enterprise Value: The combined valuation of the tech ecosystem is based on their market cap or latest transaction value. Transaction value is realised from exit or implied unrealised valuation from the latest VC round, which is either announced or estimated by Dealroom based on benchmarks.
- Regional Scope: Enterprise value and VC investment numbers are based on UK HQ companies. Power law outcomes and graduation rates include both UK HQ companies and companies which were founded in the UK, but relocated their HQ abroad.
- Inflation Adjustment: All monetary values and investment figures are reported in nominal terms and have not been adjusted for inflation.
3. Key takeaways
3.1 UK VC is on the rise
In 2025, UK startups raised $23.7 billion, making it the third year on record with $23 billion+ in VC raised.
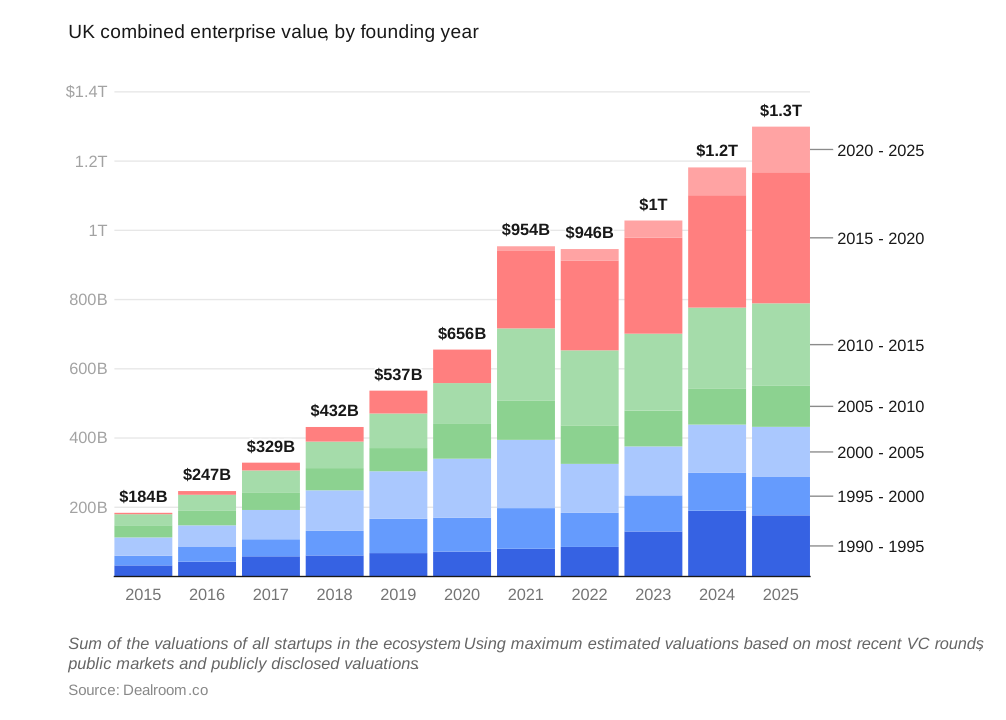
3.2 The UK tech ecosystem is worth $1.3 trillion
Since 2020, the ecosystem has grown by 2x. Half of the value belongs to private companies.
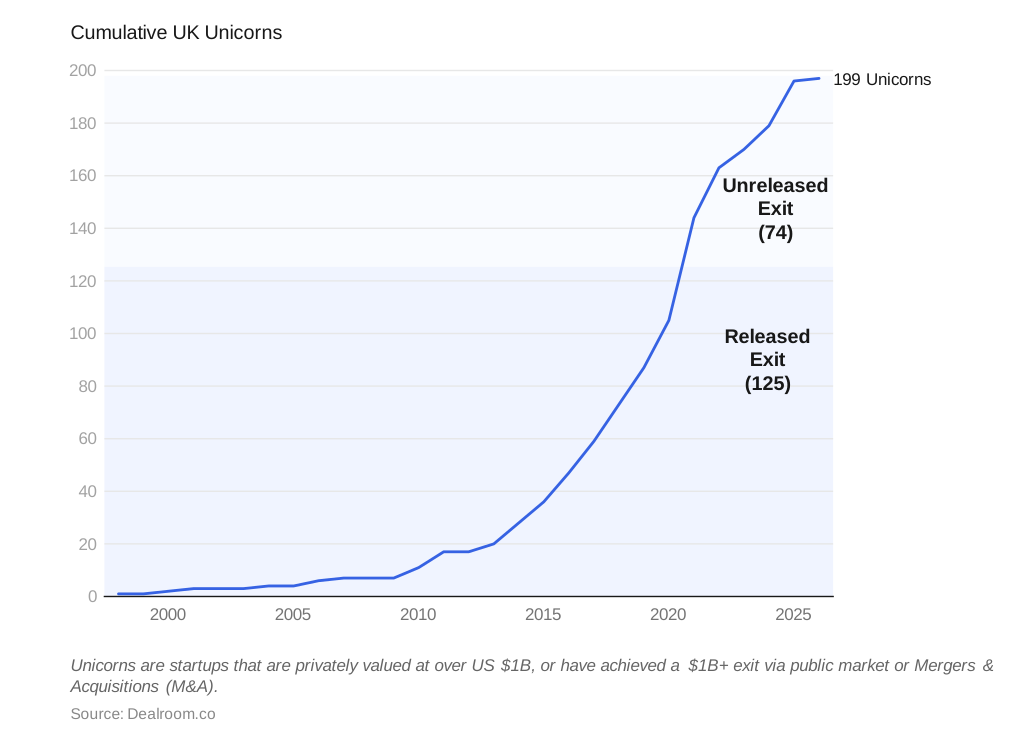
3.3 The UK has produced around 200 unicorns
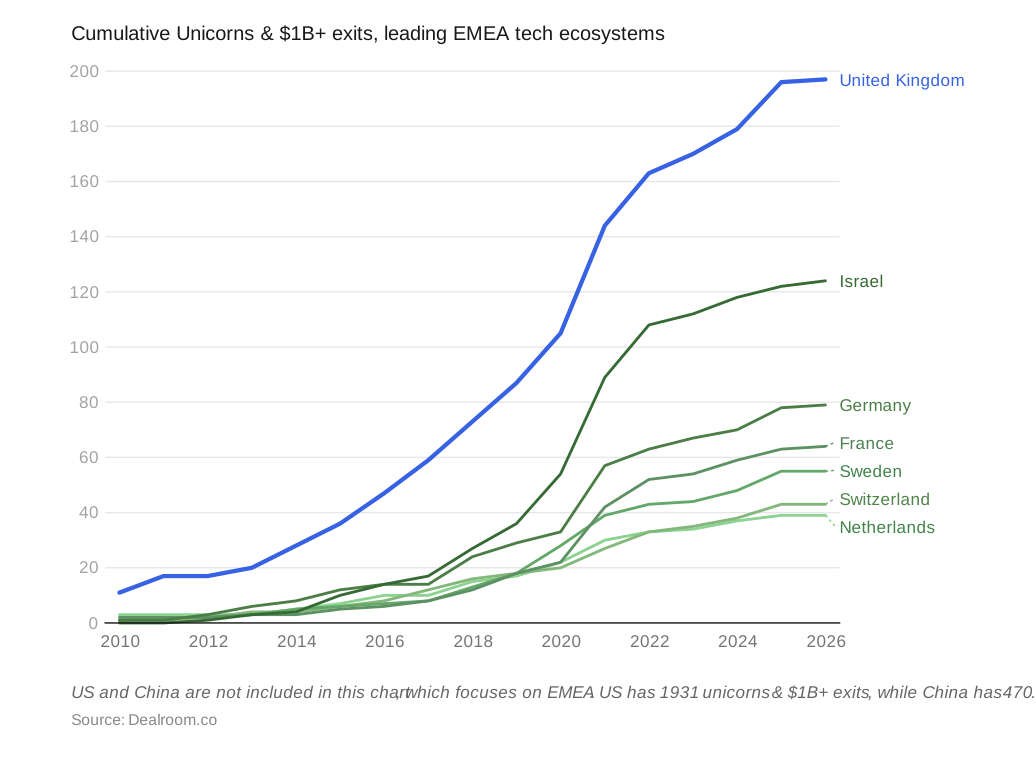
By the number of unicorns and $1 billion+ exits, the UK is the leader in Europe.
15 unicorns and $1 billion+ exits have reached decacorn status ($10 billion+ valuation).
Arm became the first UK centicorn ($100 billion+ valuation).
4. VC in the UK
The below evidence assumes that where a funding round involves multiple investors, the deal value is divided equally among all co-investors. This is unliekly to be true and since investment contributions are not disclosed, the strength of this assumption is not tested.
Source of capital by investor type and investor location is provided based on deal value, and percentages exclude undisclosed investors.
4.1. UK startups raised in $23.7 billion in 2025.
VC investment was up 33% on 2024, from $17.9 billion, and growing again for the first time in four years.
VC deals are combined into three buckets; early-stage, breakout-stage and late-stage since different series and deal types fall into different stages.
Figure 1: UK VC by Stage (rounded to the nearest million), 2015-2025

| Year | $0–15m Early-Stage | $15–100m Breakout Stage | $100m+ Late-stage |
|---|---|---|---|
| 2015 | $2,322,000,000 | $2,685,000,000 | $2,020,000,000 |
| 2016 | $2,849,000,000 | $2,822,000,000 | $3,328,000,000 |
| 2017 | $3,689,000,000 | $3,649,000,000 | $2,950,000,000 |
| 2018 | $4,161,000,000 | $5,026,000,000 | $2,269,000,000 |
| 2019 | $4,538,000,000 | $5,270,000,000 | $7,547,000,000 |
| 2020 | $4,634,000,000 | $6,748,000,000 | $5,962,000,000 |
| 2021 | $6,594,000,000 | $11,543,000,000 | $20,155,000,000 |
| 2022 | $5,748,000,000 | $10,835,000,000 | $13,761,000,000 |
| 2023 | $4,846,000,000 | $7,092,000,000 | $7,377,000,000 |
| 2024 | $4,059,000,000 | $6,977,000,000 | $6,834,000,000 |
| 2025 | $4,108,000,000 | $7,391,000,000 | $12,169,000,000 |
4.2. The US is still by far the global dominant nation by venture capital raised
Figure 2: VC by Region (rounded to the nearest million), 2020-2025

| Country | 2020 | 2021 | 2022 | 2023 | 2024 | 2025 |
|---|---|---|---|---|---|---|
| United States | $175,816,000,000 | $364,857,000,000 | $248,847,000,000 | $153,533,000,000 | $193,472,000,000 | $279,415,000,000 |
| China | $61,359,000,000 | $85,398,000,000 | $61,924,000,000 | $56,597,000,000 | $38,516,000,000 | $32,920,000,000 |
| United Kingdom | $17,361,000,000 | $38,286,000,000 | $30,344,000,000 | $19,325,000,000 | $17,859,000,000 | $23,754,000,000 |
| India | $14,345,000,000 | $39,859,000,000 | $23,436,000,000 | $11,611,000,000 | $13,492,000,000 | $12,892,000,000 |
| Israel | $5,020,000,000 | $11,185,000,000 | $8,670,000,000 | $4,352,000,000 | $3,679,000,000 | $5,736,000,000 |
4.3. Between 2015 and 2025, the UK has grown it’s share of VC investment across all stages, matching the Bay Area at early stage in 2025 - but still lags at breakout (6% UK vs 16% Bay Area) and late stage (5% UK vs 48% Bay Area).
The UK is the strongest European VC market and the Bay Area is the strongest US market, so these regions make for useful comparisons. However, it should be noted that matching the Bay Area’s relative share of international VC does not translate to UK success, as such, since this is descriptive analysis of a competitive VC market.
This does show, however, that the UK’s relative weakness is particularly evident for larger VC deals. This may suggest differences in capital availabilty, investor confidence, or company potential, and the UK should consider these underlying causes.
Figure 3: % of international VC by Region, 2015-2025


| Year | Domestic (%) | Cross‑border Europe (%) | USA (%) | Asia (%) | Rest of world (%) |
|---|---|---|---|---|---|
| 2015 | 49.9% | 10.3% | 28.7% | 9.0% | 2.1% |
| 2016 | 38.3% | 13.1% | 24.7% | 22.1% | 1.8% |
| 2017 | 46.6% | 10.7% | 28.0% | 12.8% | 1.9% |
| 2018 | 47.9% | 13.9% | 25.3% | 8.8% | 4.1% |
| 2019 | 31.2% | 13.9% | 27.0% | 25.3% | 2.6% |
| 2020 | 38.6% | 12.3% | 29.8% | 9.6% | 9.7% |
| 2021 | 30.1% | 15.9% | 35.8% | 14.5% | 3.7% |
| 2022 | 34.8% | 13.2% | 37.5% | 7.8% | 6.8% |
| 2023 | 37.8% | 11.4% | 35.5% | 10.9% | 4.5% |
| 2024 | 32.7% | 14.1% | 40.9% | 9.1% | 3.2% |
| 2025 | 26.4% | 17.1% | 37.9% | 14.6% | 3.9% |
4.4. UK startups are heavily reliant on overseas capital.
74% of UK VC investment raised (by deal value) came from abroad in 2025 - the highest share in the last ten years.
This suggests that domestic capital availability is an issue for the UK. Greater overseas capital provision may be a result of larger international cheques, or greater overseas investor confidence.
Figure 4: % of UK VC by investor region, 2015-2025

| Year | Domestic (%) | Cross‑border Europe (%) | USA (%) | Asia (%) | Rest of world (%) |
|---|---|---|---|---|---|
| 2015 | 49.9% | 10.3% | 28.7% | 9.0% | 2.1% |
| 2016 | 38.3% | 13.1% | 24.7% | 22.1% | 1.8% |
| 2017 | 46.6% | 10.7% | 28.0% | 12.8% | 1.9% |
| 2018 | 47.9% | 13.9% | 25.3% | 8.8% | 4.1% |
| 2019 | 31.2% | 13.9% | 27.0% | 25.3% | 2.6% |
| 2020 | 38.6% | 12.3% | 29.8% | 9.6% | 9.7% |
| 2021 | 30.1% | 15.9% | 35.8% | 14.5% | 3.7% |
| 2022 | 34.8% | 13.2% | 37.5% | 7.8% | 6.8% |
| 2023 | 37.8% | 11.4% | 35.5% | 10.9% | 4.5% |
| 2024 | 32.7% | 14.1% | 40.9% | 9.1% | 3.2% |
| 2025 | 26.4% | 17.1% | 37.9% | 14.6% | 3.9% |
4.5. The UK is particularly reliant on overseas for late-stage capital, with this gap having increased in the last decade.
It’s important to note that the growth in overseas capital in recent years has been across all stages, with this trend being more pronounced at later stages (with larger deal sizes).
As VC markets grow, the over-reliance on international investment creates risks for the UK companies such as overseas relocation and susceptablity to international shocks.
Figure 5: % of UK VC by stage and investor region, 2015-2025


| Geography | Startup 2015 (%) | Startup 2025 (%) | Breakout 2015 (%) | Breakout 2025 (%) | Late 2015 (%) | Late 2025 (%) |
|---|---|---|---|---|---|---|
| Domestic | 72.2% | 48.5% | 38.7% | 33.2% | 33.3% | 25.0% |
| Cross‑border Europe | 11.3% | 18.4% | 20.7% | 24.4% | 8.3% | 18.8% |
| USA | 12.8% | 20.5% | 27.9% | 30.0% | 33.3% | 37.5% |
| Asia | 2.6% | 8.6% | 9.9% | 6.5% | 16.7% | 10.9% |
| Rest of world | 1.2% | 4.0% | 2.7% | 5.9% | 8.3% | 7.8% |
4.6. VCs contributed 46% of total VC investment (by deal value) over the last five years, while Corporates and Corporate Venture Capital (CVCs) together accounted for 25%
Corporates and CVCs investing in UK startups in 2025 include: Mubadala Capital, Nvidia, Dell Technologies Capital, Goldman Sachs, JP Morgan.
Figure 6: Share of UK VC by investor type

| Investor type | Share of funding (%) |
|---|---|
| Venture capital | 46.1% |
| Corporate and CVCs | 24.6% |
| Other | 29.3% |
4.7. UK VC is very concentrated in London
In 2025, London startups raised 75% UK venture capital.
This is unsurprising, due to the scale of London-based companies, however, suggests the UK could deliver greater growth by regionally diversifying.
Figure 7: Share of UK VC by London and Rest of UK, 2015-2025

| Year | London (%) | Rest of UK (%) |
|---|---|---|
| 2015 | 66.9% | 33.1% |
| 2016 | 69.5% | 30.5% |
| 2017 | 68.9% | 31.1% |
| 2018 | 60.9% | 39.1% |
| 2019 | 76.4% | 23.6% |
| 2020 | 71.6% | 28.4% |
| 2021 | 72.5% | 27.5% |
| 2022 | 71.7% | 28.3% |
| 2023 | 64.5% | 35.5% |
| 2024 | 64.0% | 36.0% |
| 2025 | 74.7% | 25.3% |
4.8. The UK is showing a better graduation rate than Europe but still has a growth gap compared to the US
To ensure comparability across ecosystems, graduation rates are standardised using a consistent classification framework. Rounds were reviewed and re-labelled based on round size, timing since company founding, and sequencing of investments. Rounds that could not be reliably qualified were excluded. For more view The Journey to Series A in Europe – Part 3.
The growth gap refers to the difference in growth rates between two countries, indicating how much faster one is growing compared to the other.
The chart below shows the graduation rate:
Figure 8: Graduation rates between VC rounds by Region, 2010-2020

| Geography | Series A (%) | Series B (%) | Series C (%) | Series D (%) | Unicorns (%) |
|---|---|---|---|---|---|
| United Kingdom | 27.4% | 12.5% | 6.0% | 2.4% | 1.7% |
| United States | 29.5% | 15.8% | 9.3% | 4.6% | 4.1% |
| Rest of Europe | 21.2% | 9.9% | 4.8% | 2.4% | 1.9% |
5. Enterprise Value
The combined valuation of the tech ecosystem is based on their market cap or latest transaction value. Transaction value is realised from exit or implied unrealised valuation from the latest VC round, which is either announced or estimated by Dealroom based on benchmarks.
The below findings sum all valuations of startups in the ecosystem, using maximum estimated valuations based on the most recent VC rounds public markets and publicly disclosed valuations.
5.1. The UK is worth a combined $1.3 trillion in enterprise value
UK tech value creation is accelerating. The most valuable cohort of companies is one of the youngest, those founded from 2015-2020.
The UK ecosystem is worth 2.5x more than those of France or Germany, but the gap to the US — the global leader — remains vast.
Figure 9: UK Tech ecosystem value by Founding Year (rounded to the nearest million), 2015-2025
| Year/Founding Year | 1990–95 | 1995–00 | 2000–05 | 2005–10 | 2010–15 | 2015–20 | 2020–25 |
|---|---|---|---|---|---|---|---|
| 2015 | $32,052,000,000 | $27,765,000,000 | $52,958,000,000 | $35,159,000,000 | $31,930,000,000 | $3,996,000,000 | $60,000,000 |
| 2016 | $42,507,000,000 | $43,977,000,000 | $61,055,000,000 | $41,717,000,000 | $46,495,000,000 | $10,835,000,000 | $73,000,000 |
| 2017 | $58,795,000,000 | $49,185,000,000 | $84,615,000,000 | $51,050,000,000 | $63,140,000,000 | $22,443,000,000 | $130,000,000 |
| 2018 | $60,790,000,000 | $70,952,000,000 | $117,174,000,000 | $64,120,000,000 | $76,562,000,000 | $42,152,000,000 | $128,000,000 |
| 2019 | $67,536,000,000 | $99,000,000,000 | $137,416,000,000 | $66,970,000,000 | $99,851,000,000 | $65,950,000,000 | $153,000,000 |
| 2020 | $71,988,000,000 | $98,004,000,000 | $170,192,000,000 | $100,323,000,000 | $118,111,000,000 | $95,574,000,000 | $1,681,000,000 |
| 2021 | $79,891,000,000 | $117,390,000,000 | $197,159,000,000 | $112,701,000,000 | $209,246,000,000 | $223,689,000,000 | $13,603,000,000 |
| 2022 | $85,057,000,000 | $98,333,000,000 | $141,547,000,000 | $111,319,000,000 | $216,701,000,000 | $259,673,000,000 | $32,933,000,000 |
| 2023 | $130,155,000,000 | $104,265,000,000 | $141,321,000,000 | $103,431,000,000 | $222,253,000,000 | $277,160,000,000 | $49,809,000,000 |
| 2024 | $190,072,000,000 | $109,292,000,000 | $139,459,000,000 | $104,720,000,000 | $233,247,000,000 | $324,650,000,000 | $80,321,000,000 |
| 2025 | $176,702,000,000 | $110,813,000,000 | $144,802,000,000 | $118,387,000,000 | $238,453,000,000 | $378,610,000,000 | $131,788,000,000 |
5.2. Private companies account for half of the UKʼs tech value
Figure 10: UK Private and Exited companies value by Year (rounded to the nearest million), 2015-2025

| Year | Private ($) | Exited ($) |
|---|---|---|
| 2015 | $31,073,000,000 | $152,846,000,000 |
| 2016 | $43,511,000,000 | $203,148,000,000 |
| 2017 | $64,825,000,000 | $264,532,000,000 |
| 2018 | $87,965,000,000 | $343,914,000,000 |
| 2019 | $132,666,000,000 | $404,211,000,000 |
| 2020 | $175,261,000,000 | $480,613,000,000 |
| 2021 | $340,242,000,000 | $613,437,000,000 |
| 2022 | $436,196,000,000 | $509,368,000,000 |
| 2023 | $465,090,000,000 | $563,305,000,000 |
| 2024 | $547,296,000,000 | $634,465,000,000 |
| 2025 | $642,579,000,000 | $656,975,000,000 |
Some of the top exits by valuation this year include Verona Pharma (acquisition), eToro (IPO) and Deliveroo (acquisition).
6. Power Law Outcomes
Unicorns: Startups that reached US$1 billion+ valuation or exited at this level.
Decacorns: A subset of unicorns valued at US$ 10 billion+.
Centicorn: A subset of unicorns valued at US$ 100 billion+.
Thoroughbreds: Startups generating US$ 100 million+ in revenue.
Companies may be counted as part of multiple categories, as many unicorns also qualify as thoroughbreds, and all decacorns are unicorns.
These findings include both UK HQ companies and companies which were founded in the UK, but relocated their HQ abroad.
6.1 The UK has now created 199 unicorns, with 18 new additions since 2025
Figure 11: UK Cumulative Unicorns by Year
| Year | 1998 | 1999 | 2000 | 2001 | 2002 | 2003 | 2004 | 2005 | 2006 | 2007 | 2008 | 2009 | 2010 | 2011 | 2012 | 2013 | 2014 | 2015 | 2016 | 2017 | 2018 | 2019 | 2020 | 2021 | 2022 | 2023 | 2024 | 2025 |
|---|---|---|---|---|---|---|---|---|---|---|---|---|---|---|---|---|---|---|---|---|---|---|---|---|---|---|---|---|
| Total | 1 | 1 | 2 | 3 | 3 | 3 | 4 | 4 | 6 | 7 | 7 | 7 | 11 | 17 | 17 | 20 | 28 | 36 | 47 | 59 | 73 | 87 | 105 | 144 | 163 | 170 | 181 | 199 |
6.2 The UK is the leader in Europe, the Middle East and Africa (EMEA) for producing unicorn startups
Figure 12: Number of unicorns by Region and Year, 2010-2025
| Year | UK | Israel | Germany | France | Sweden | Switzerland | Netherlands |
|---|---|---|---|---|---|---|---|
| 2010 | 11 | 0 | 1 | 2 | 1 | 1 | 3 |
| 2011 | 17 | 0 | 1 | 2 | 2 | 1 | 3 |
| 2012 | 17 | 1 | 3 | 2 | 2 | 2 | 3 |
| 2013 | 20 | 3 | 6 | 3 | 3 | 4 | 3 |
| 2014 | 28 | 4 | 8 | 3 | 5 | 4 | 5 |
| 2015 | 36 | 10 | 12 | 5 | 6 | 6 | 7 |
| 2016 | 47 | 14 | 14 | 6 | 7 | 8 | 10 |
| 2017 | 59 | 17 | 14 | 8 | 8 | 12 | 10 |
| 2018 | 73 | 27 | 24 | 12 | 13 | 16 | 15 |
| 2019 | 87 | 36 | 29 | 18 | 18 | 18 | 17 |
| 2020 | 105 | 54 | 33 | 22 | 28 | 20 | 22 |
| 2021 | 144 | 89 | 57 | 42 | 39 | 27 | 30 |
| 2022 | 163 | 108 | 63 | 52 | 43 | 33 | 33 |
| 2023 | 170 | 112 | 67 | 54 | 44 | 35 | 34 |
| 2024 | 181 | 118 | 70 | 59 | 48 | 38 | 37 |
| 2025 | 199 | 122 | 78 | 63 | 55 | 43 | 39 |
US and China are not included in this chart. At the time of producing this analysis, the US had 1,931 unicorns & $1bn exits whilst China had 470.
6.3 Outside of the US and China, the UK is top 3 for unicorns in almost every sector
Dealroom’s proprietary tech taxonomy consists of 32 fixed industries, 77 sub-industries, and thousands of tags for niche, granular company categorization. The top industries are shown here.
Figure 13: International Unicorns & $1 Billion+ exits comparisons, by industry
| Industry | United States | China | United Kingdom | Israel | India | Germany | France |
|---|---|---|---|---|---|---|---|
| Total unicorns & $1bn+ exits | 1,931 | 470 | 199 | 126 | 121 | 80 | 64 |
| Fintech | 312 | 43 | 56 | 23 | 35 | 12 | 16 |
| Enterprise software | 591 | 54 | 40 | 47 | 21 | 18 | 19 |
| Health | 442 | 60 | 33 | 9 | 8 | 12 | 9 |
| AI | 402 | 85 | 31 | 43 | 12 | 13 | 13 |
| Security | 167 | 6 | 12 | 41 | 2 | 5 | 5 |
| Transportation | 115 | 95 | 12 | 12 | 15 | 6 | 4 |
| Media | 109 | 33 | 12 | 7 | 3 | 3 | 2 |
| Energy | 87 | 38 | 11 | 2 | 0 | 2 | 5 |
| Gaming | 37 | 11 | 11 | 3 | 3 | 0 | 2 |
6.4 The UKʼs tech ecosystem has been on a long term growth trajectory
Figure 14: Total VC (rounded to nearest million) and number of Unicorns and Thoroughbreds, 2010-2025

| Year | VC investment ($) | Unicorns & $1 billion+ exits | Thoroughbreds |
|---|---|---|---|
| 2010 | $1,970,000,000 | 11 | 15 |
| 2015 | $6,732,000,000 | 36 | 56 |
| 2020 | $17,415,000,000 | 105 | 151 |
| 2025 | $23,701,000,000 | 199 | 249 |
6.5 Recent unicorns are reaching decacorn status more quickly
Figure 15: Years taken from Unicorn to Decacorn

| Company | How many years it took to growth from Unicorn to Decacorn |
|---|---|
| Quantinuum | 1 |
| Blockchain.com | 1 |
| ElevenLabs | 2 |
| Checkout.com | 2 |
| Verona Pharma | 3 |
| Revolut | 3 |
| FNZ | 4 |
| The Access Group | 4 |
| Global Switch | 4 |
| FanDuel | 5 |
| Anaplan | 6 |
| Just Eat | 6 |
| WorldPay | 8 |
| Admiral Group | 13 |
| ARM | 18 |
Decacorn is a unicorn with $10-100 billion valuation. Source:Dealroom.co
In total 15 UK unicorns and $1 billion+ exits have reached decacorn status.
Arm is the first UK unicorn and $1B+ exit to reach centicorn (>$100 billion valuation) status.
6.5 The UK has more companies with $25 million+ revenue than France, Germany and Sweden combined - with a third of Europe
Figure 16: Number of VC backed companies by revenue and country, up to 2025

| Country | Colts ($25 – 100 million) | Thoroughbreds ($100 million+) |
|---|---|---|
| United Kingdom | 625 | 249 |
| France | 244 | 106 |
| Germany | 154 | 119 |
| Sweden | 138 | 73 |
| Spain | 79 | 36 |
| Netherlands | 56 | 45 |
| Italy | 63 | 26 |
| Norway | 45 | 21 |
| Denmark | 36 | 30 |
| Switzerland | 28 | 34 |