Equality Information Report 2016
Published 31 January 2017
Applies to England and Wales

© Crown copyright 2017
This publication is licensed under the terms of the Open Government Licence v3.0 except where otherwise stated. To view this licence, visit nationalarchives.gov.uk/doc/open-government-licence/version/3 or write to the Information Policy Team, The National Archives, Kew, London TW9 4DU, or email: psi@nationalarchives.gov.uk.
Where we have identified any third party copyright information you will need to obtain permission from the copyright holders concerned.
This publication is available at https://www.gov.uk/government/publications/land-registry-equality-information-2016/equality-information-report-2016
1. Our staff
The equality and diversity figures in this report are based on a headcount total of 4,536 members of staff on 31 March 2016 and are taken from Land Registry’s Human Resources (HR) system unless otherwise stated. Staff on loan and not paid directly by Land Registry are not included in the analysis, nor are agency staff/contractors.
This covers:
- Overall workforce
- Diversity data by grade
- Recruitment
- Promotion
- Development opportunities
- Maternity leave
- Leavers
- Performance markings
- Training and development
- Grievances and disciplinary
- Employee engagement
Table 1: Declaration rates held for Land Registry workforce
| Characteristic | % of workforce with data |
|---|---|
| Gender | 100% |
| Age | 100% |
| Ethnic origin | 96% |
| Disability | 98% |
| Religion and belief | 80% |
| Sexual orientation | 80% |
1.1 Overall workforce
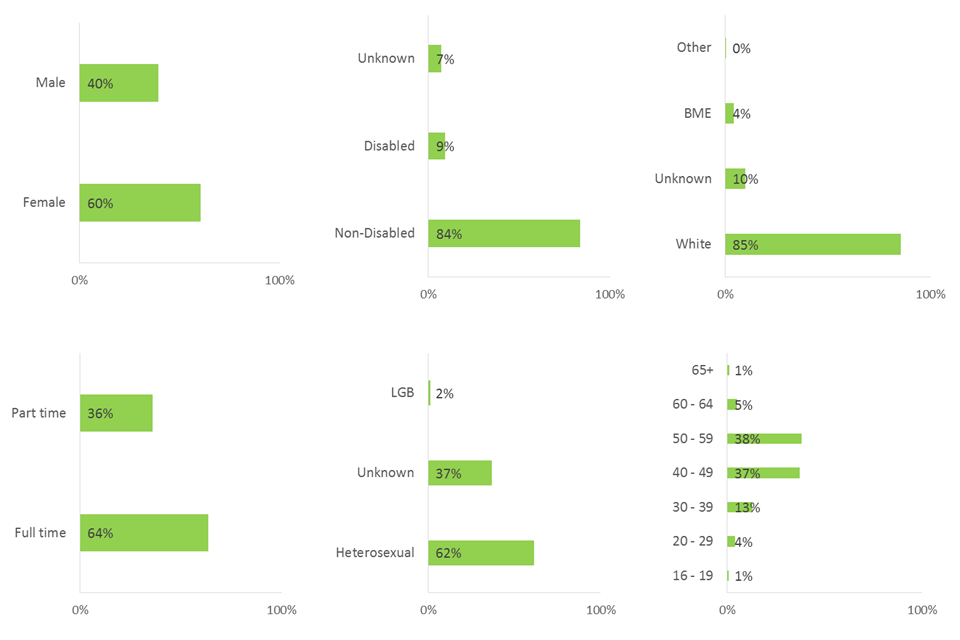
The data presented here shows Land Registry’s workforce by protected characteristic at 31 March 2016.
This tells us that:
- women accounted for 60% of the workforce
- 75% of the workforce were aged between 40 to 59
- part-time workers comprised 36% of the workforce
Figure 1: Workforce composition by gender, disability, ethnicity, working pattern, sexual orientation and age.
1
1.2 Diversity data by grade
The data presented here shows Land Registry’s workforce by grade as percentages in relation to the protected characteristics and working pattern as at 31 March 2016.
There are 10 pay grades within Land Registry which are shown in the table below with the Civil Service equivalent grade.
Table 2: Grade structure
| Land Registry grade | Civil Service grade |
|---|---|
| Senior Civil Service (SCS) | SCS |
| Senior Registration Administrator 1 (SRA1) | Grade 6 |
| Senior Registration Administrator Lawyer (SRAL) | Grade 7 |
| Senior Registration Administrator 2 (SRA2) | Grade 7 |
| Senior Registration Executive (SRE) | Senior Executive Officer (SEO) |
| Registration Executive 1 (RE1) | Senior Executive Officer (SEO) |
| Registration Executive 2 Upper (RE2U) | Higher Executive Officer (HEO) |
| Registration Executive 2 Lower (RE2L) | Executive Officer (EO) |
| Registration Officer (RO) | Administrative Officer (AO) |
| Registration Assistant (RA) | Administrative Assistant (AA) |
| Apprentice (APP) | Apprentice |
Land Registry sets its own internal targets for the immediate feeder grades for the SCS. The targets for the year 2015/16 are shown in Table 3.
Table 3: Land Registry targets 2016
| A APP/RA/RO (AA/AO/APP) |
B RE2L/U (EO/HEO) |
C RE1/SRE (SEO) |
D SRA2/1 (G6/7) |
E SRAL (G7 Legal) |
|
|---|---|---|---|---|---|
| Women: at 31.03.15 | 56% | 64% | 41% | 44% | 50% |
| Women: target 2016 | 40% | 40% | |||
| Women: at 31.03.16 | 57% | 64% | 41% | 46% | 54% |
| Black and minority ethnic (BME): at 31.03.15 | 8% | 4% | 4% | 5% | 10% |
| BME: target 2016 | 5% | 5% | 6% | ||
| BME: at 31.03.16 | 9% | 4% | 4% | 3% | 7% |
| Disabled*: at 31.03.15 | 11% | 8% | 5% | 6% | 8% |
| Disabled*: at 31.03.16 | 14% | 9% | 6% | 8% | 8% |
| *overall disability target is 8% excluding Senior Civil Service (SCS) |
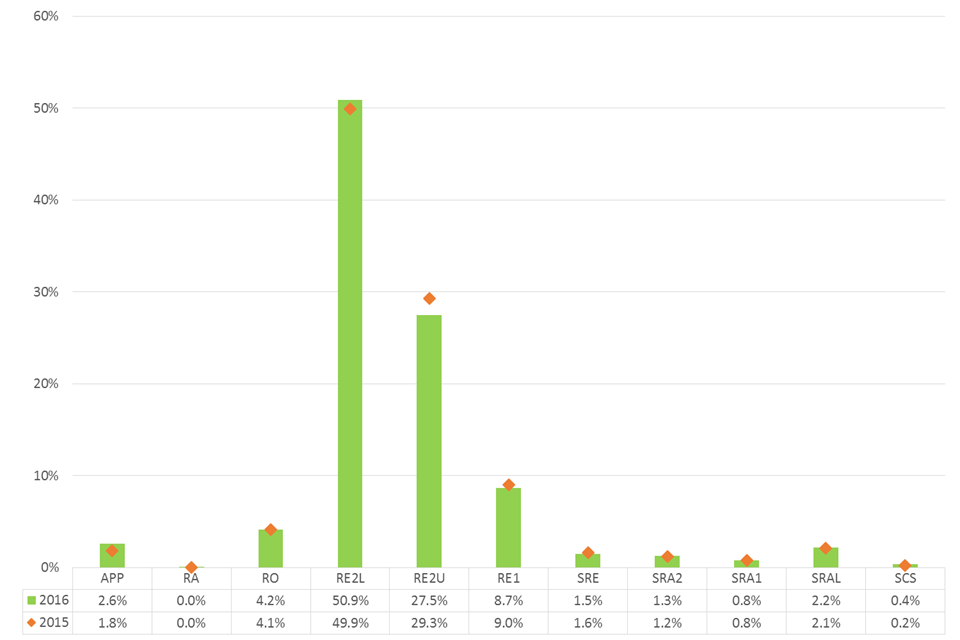
This tells us that:
- the majority of the workforce (78%) were in grades RE2L and RE2U
- no SCS had declared a disability
- less than 1.1% of those aged between 20 to 29 were in grades higher than RE2U
Figure 2.1: Percentage of Land Registry staff across grades
2.1
Figure 2.2: Gender distribution by grade
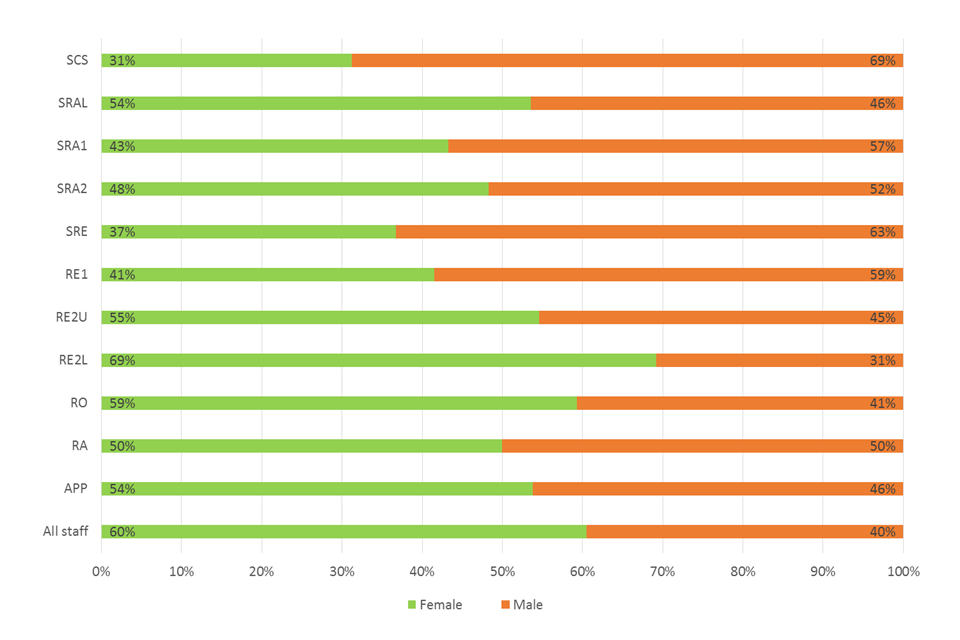
2.2
Figure 2.3: Age distribution by grade
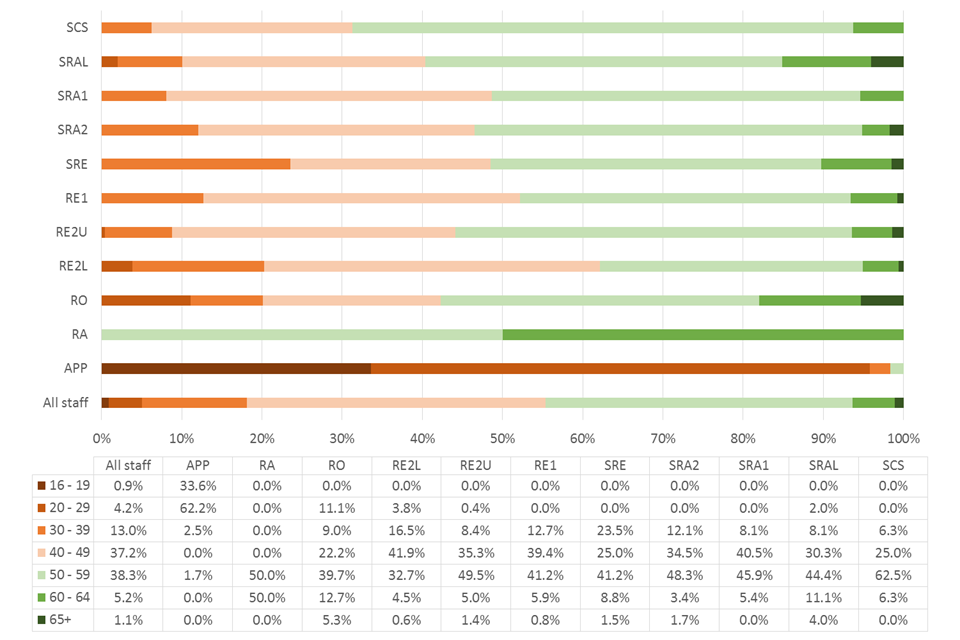
2.3
Figure 2.4: Disability distribution by grade
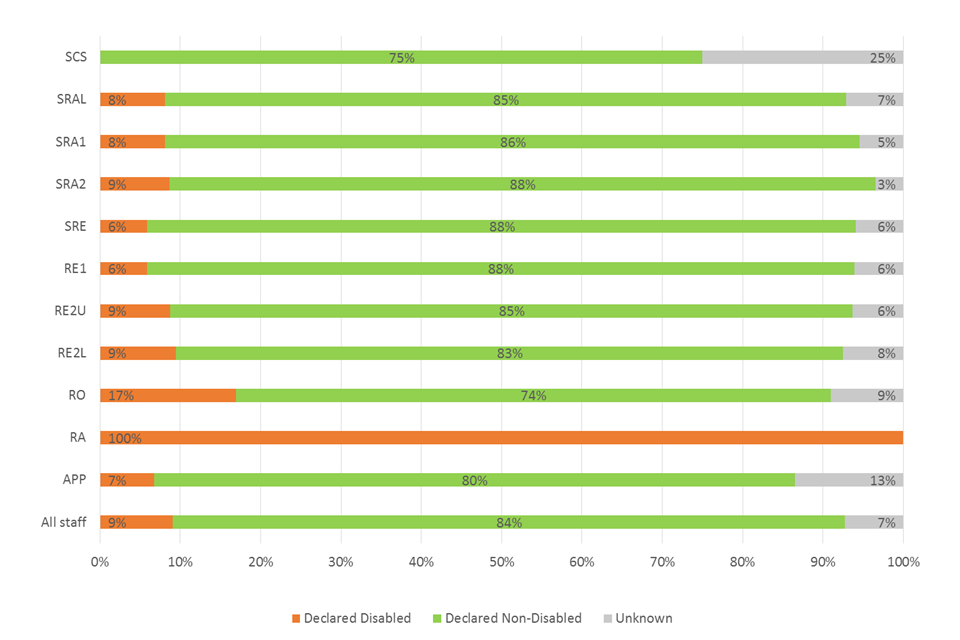
2.4
Figure 2.5: Ethnicity distribution by grade
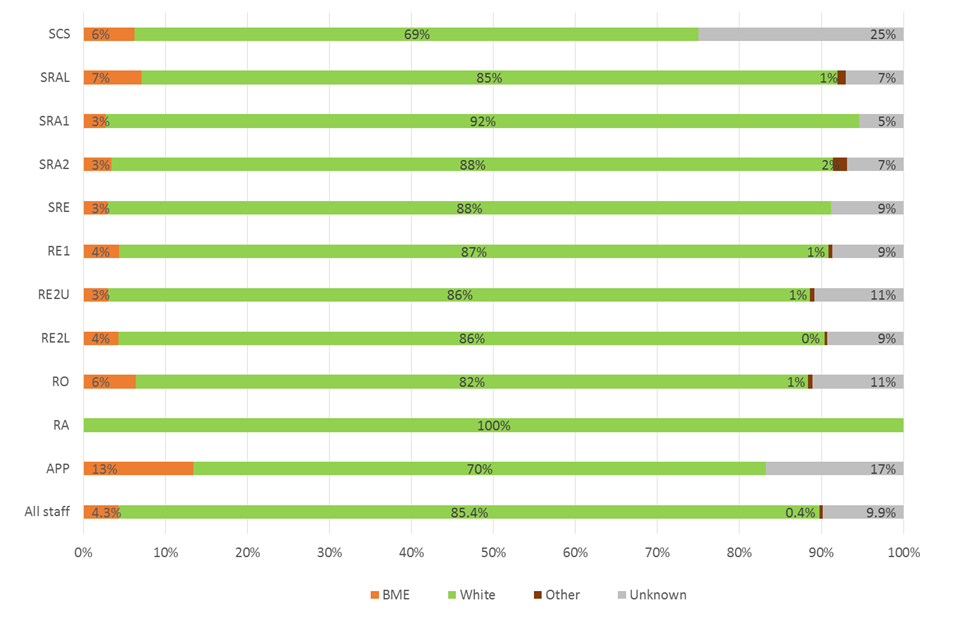
2.5
Figure 2.6: Working pattern distribution by grade
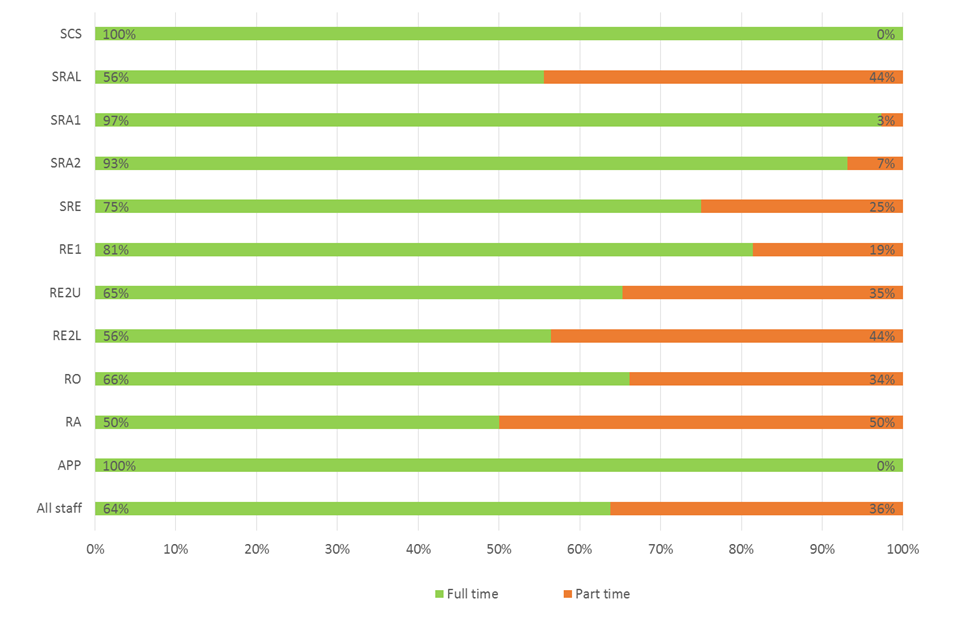
2.6
1.3 Recruitment
The data below shows the percentage of applicants at different stages of the recruitment process for vacancies advertised Civil Service-wide and externally which were filled between 1 April 2015 and 31 March 2016. This is shown against their status in relation to each of the following protected characteristics: gender, ethnicity and disability. The raw data is provided by Civil Service Resourcing.
This tells us that:
- the success rate for applicants with a disability had increased in comparison to last year (4.2%)
- the percentage of female applicants appointed was higher than the percentage for male
Figure 3.1: Percentage of applicants at different stages of the recruitment process by gender
| Gender | % of applications received | % of rejected after sift (online test and screening) |
% of appointed |
|---|---|---|---|
| Female | 43.2% | 42.0% | 53.2% |
| Male | 55.6% | 57.0% | 46.0% |
| Unknown | 1.2% | 1.0% | 0.8% |
The success rate for males was 8.0% and 11.9% for females.
Figure 3.2: Percentage of applicants at different stages of the recruitment process by ethnicity
| Ethnic origin | % of applications received | % of rejected after sift (online test and screening) |
% of appointed |
|---|---|---|---|
| BME | 21.7% | 23.9% | 13.6% |
| Non-BME | 75.7% | 73.1% | 85.7% |
| Unknown | 2.7% | 3.0% | 0.8% |
The success rate for applicants from a BME background was 6.1% and 11.0% for applicants who indicated that were non-BME.
Figure 3.3: Percentage of applicants at different stages of the recruitment process by disability
| Disability | % of applications received | % of rejected after sift (online test and screening) |
% of appointed |
|---|---|---|---|
| Disabled | 5.0% | 4.9% | 4.2% |
| Non - disabled | 91.6% | 91.7% | 94.3% |
| Unknown | 3.3% | 3.4% | 1.5% |
The success rate for applicants with a disability was 8% compared with 10% for non-disabled applicants.
1.4 Promotion
The data analysis presented here shows employees promoted in relation to the protected characteristics: disability, ethnic origin and gender during the period 1 April 2015 to 31 March 2016 (calculations based on employees as at 31 March 2016). Working pattern has also been included.
Between 1 April 2015 and 31 March 2016, 66 staff at Land Registry gained promotion.
This tells us that:
- the gap between percentage of group promoted for each of the characteristics (male/female, disabled/non-disabled, BME/white) had increased
- employees from a BME group had a higher percentage of promotions than those from the white ethnic group.
Figure 4.1: Promotion by gender
| Gender | % of promotions | % of total headcount | % of group promoted |
|---|---|---|---|
| Female | 51.5% | 60.5% | 1.2% |
| Male | 48.5% | 39.5% | 1.8% |
| Total | 100% | 100% | - |
Figure 4.2: Promotion by ethnicity
| Ethnic origin | % of promotions | % of total headcount | % of group promoted |
|---|---|---|---|
| BME | 6.1% | 4.3% | 2.1% |
| White | 83.3% | 85.4% | 1.4% |
| Total | 89.4% | 89.7% | - |
Figure 4.3: Promotion by disability
| Disability | % of promotions | % of total headcount | % of group promoted |
|---|---|---|---|
| Disabled | 3.0% | 9.1% | 0.5% |
| Non-disabled | 89.4% | 83.7% | 1.6% |
| Total | 92.4% | 92.8% | - |
Figure 4.4: Promotion by working pattern
| Working Pattern | % of promotions | % of total headcount | % of group promoted |
|---|---|---|---|
| Full-time | 84.9% | 63.8% | 1.9% |
| Part-time | 15.2% | 36.2% | 0.6% |
| Total | 100% | 100% | - |
Definition of terms used in the table above:
- % of promotions:
percentages shown are the number of employees promoted by protected characteristic over the total number of employees promoted - % of total headcount:
organisational profile for protected characteristic - % of group promoted:
percentages shown are the number of employees promoted by protected characteristic over the total number of employees in the organisation that have declared the protected characteristic. An even distribution is shown where the figures for the protected characteristic and outside the protected characteristic are equal
1.5 Development opportunities
The data analysis presented here shows employees who were on temporary promotion between 1 April 2015 and 31 March 2016 in relation to the protected characteristics: disability, ethnic origin and gender (calculations based on employees as at 31 March 2016). Working pattern has also been analysed.
There were 159 employees recorded as being on temporary promotion for any period during 2015/16.
This tells us that:
- the percentage of female employees on temporary promotions were similar to male
- the percentage of disabled staff on temporary promotions were lower than last year and at a lower level to the representation of the workforce, however the percentage of unknowns should be taken into account.
Figure 5.1: Temporary promotion by gender
| Gender | % of promotions | % of total headcount | % of group promoted |
|---|---|---|---|
| Female | 59.7% | 60.5% | 3.5% |
| Male | 40.3% | 39.5% | 3.6% |
| Total | 100% | 100% | - |
Figure 5.2: Temporary promotion by ethnicity
| Ethnic origin | % of promotions | % of total headcount | % of group promoted |
|---|---|---|---|
| BME | 5.0% | 4.3% | 4.1% |
| White | 88.1% | 85.4% | 3.6% |
| Total | 93.1% | 89.7% | - |
Figure 5.3: Temporary promotion by disability
| Disability | % of promotions | % of total headcount | % of group promoted |
|---|---|---|---|
| Disabled | 3.8% | 9.1% | 1.5% |
| Non-disabled | 93.1% | 83.7% | 3.9% |
| Total | 96.9% | 92.7% | - |
Figure 5.4: Temporary promotion by working pattern
| Working Pattern | % of promotions | % of total headcount | % of group promoted |
|---|---|---|---|
| Full-time | 77.4% | 63.8% | 4.3% |
| Part-time | 22.6% | 36.2% | 2.2% |
| Total | 100 | 100 | - |
Definition of terms used in the table above:
- % of promotions:
percentages shown are the number of employees promoted by protected characteristic over the total number of employees promoted - % of total headcount:
organisational profile for protected characteristic - % of group promoted:
percentages shown are the number of employees promoted by protected characteristic over the total number of employees in the organisation that have declared the protected characteristic. An even distribution is shown where the figures for the protected characteristic and outside the protected characteristic are equal
1.6 Maternity leave
The data presented in this section shows the choices made by staff at the end of maternity leave between 1 April 2015 and 31 March 2016. There were 32 members of staff whose maternity leave ended in this period.
This tells us that:
- no staff chose to leave after their maternity leave ended
- 53% returned on the same hours
- 41% returned on reduced hours
- 6% decided to take a career break
Figure 6.1: Number of staff returned from maternity leave
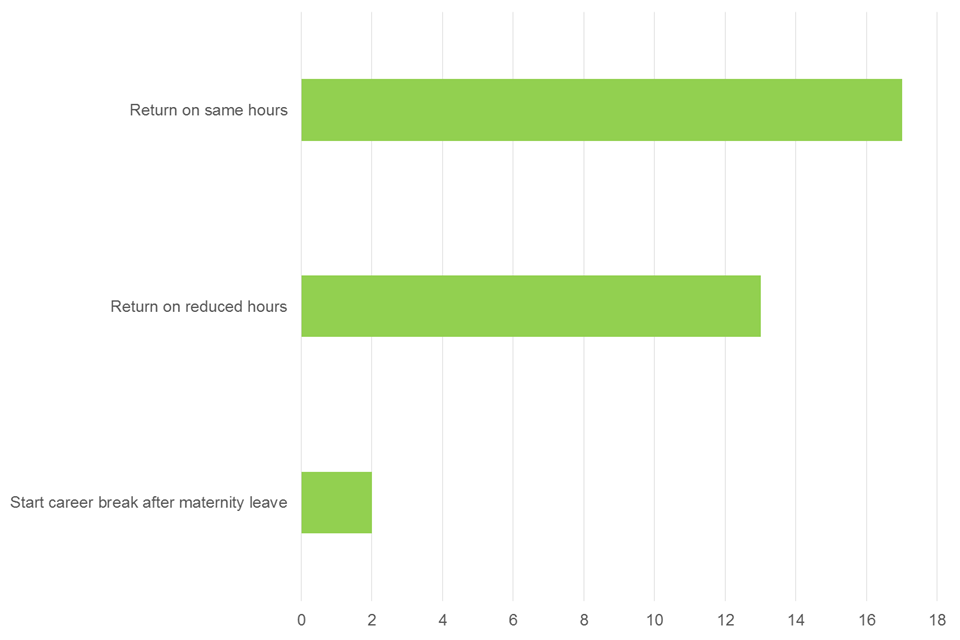
6.1
1.7 Leavers
The data analysis presented here shows the reasons why employees leave the organisation in relation to each of the following protected characteristics: gender, ethnicity and disability. Working pattern has also been included. Between 1 April 2015 and 31 March 2016, 191 staff left Land Registry.
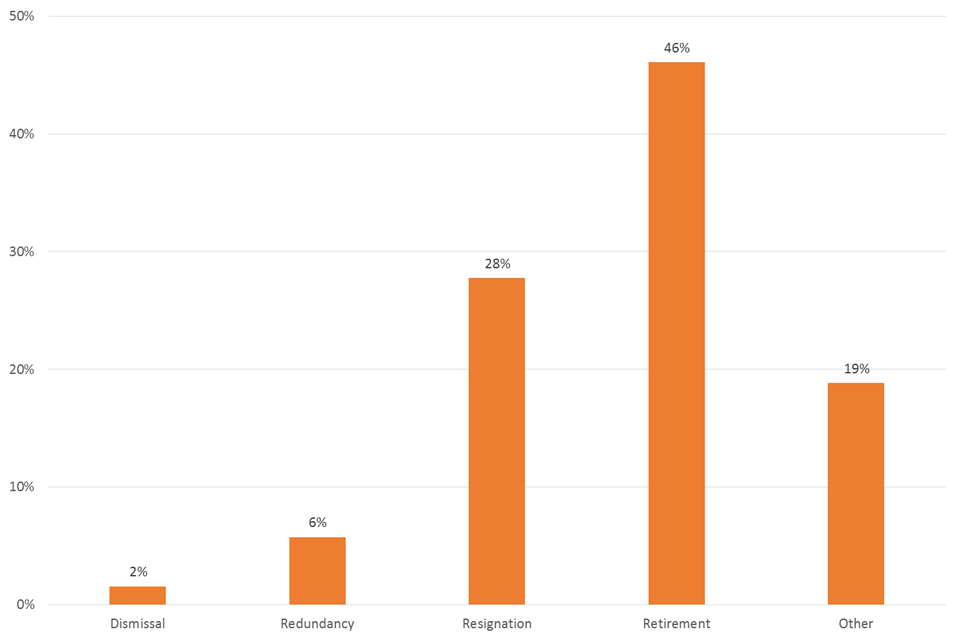
This tells us that:
- overall the main reason for leaving was retirement
- broken down by protected characteristics, the main reason for leaving was retirement for all, except for those who declared under BME, where the main reason was resignation
- from those who left the organisation, 12% had an unknown disability status and 14.1% had an unknown ethnicity status
Figure 7.1: Percentage of total leavers by reason
7.1
Figure 7.2: Percentage of reason for leaving by gender in relation to total number of leavers in that group
| Gender | % Dismissal | % Redundancy | % Resignation | % Retirement | % Other |
|---|---|---|---|---|---|
| Female | 1.0% | 3.9% | 36.3% | 41.2% | 17.6% |
| Male | 2.2% | 7.9% | 18.0% | 51.7% | 20.2% |
Figure 7.3: Percentage of reasons for leaving by indicated ethnicity in relation to total number of leavers in that group
| Ethnicity | % Dismissal | % Redundancy | % Resignation | % Retirement | % Other |
|---|---|---|---|---|---|
| BME | 0.0% | 16.7% | 41.7% | 16.7% | 25.0% |
| White | 2.0% | 6.0% | 25.8% | 50.3% | 15.9% |
| Unknown | 0.0% | 0.0% | 33.3% | 33.3% | 33.3% |
Figure 7.4: Percentage of reasons for leaving by indicated disability in relation to total number of leavers in that group
| Disability | % Dismissal | % Redundancy | % Resignation | % Retirement | % Other |
|---|---|---|---|---|---|
| Disabled | 0.0% | 14.3% | 28.6% | 28.6% | 28.6% |
| Non-disabled | 1.9% | 5.8% | 27.3% | 50.6% | 14.3% |
| Unknown | 0.0% | 0.0% | 30.4% | 26.1% | 43.5% |
Figure 7.5: Percentage of reason for leaving by working pattern in relation to total number of leavers in that group
| Working Pattern | % Dismissal | % Redundancy | % Resignation | % Retirement | % Other |
|---|---|---|---|---|---|
| Full-time | 2.1% | 6.4% | 29.8% | 38.3% | 23.4% |
| Part-time | 1.0% | 5.2% | 26.0% | 54.2% | 13.5% |
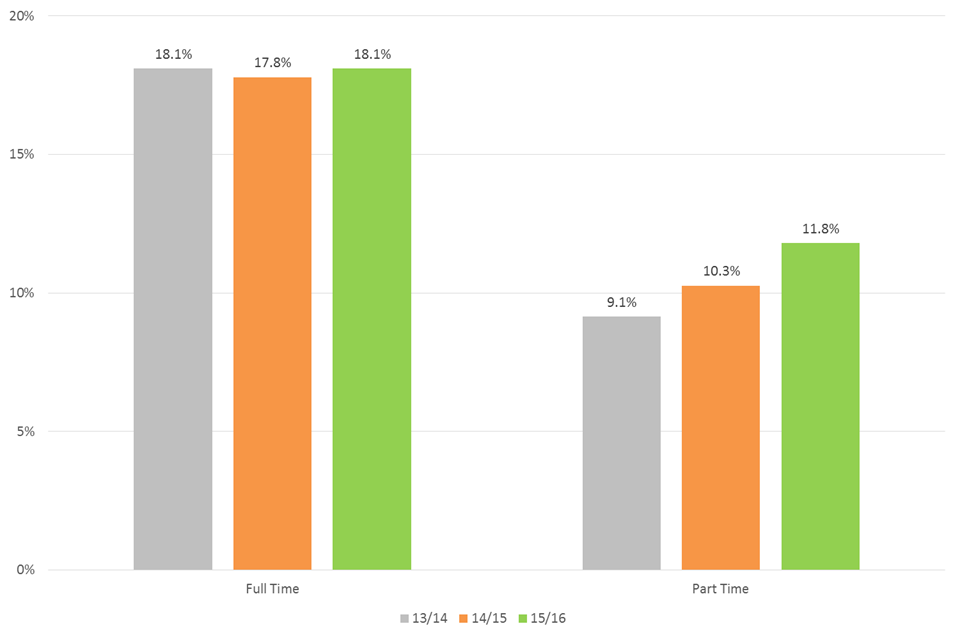
1.8 Performance markings
The information below shows the distribution of top performance markings by the protected characteristics: gender, ethnicity, disability and age. We have also included the results on working pattern. The 2015/16 performance management process comprised 3 performance ratings and the distribution is shown in the table below.
Table 4: Distribution of performance ratings 2015/16
| Rating | % Distribution |
|---|---|
| Exceeded | 15.8% |
| Met | 80.7% |
| Must improve | 3.4% |
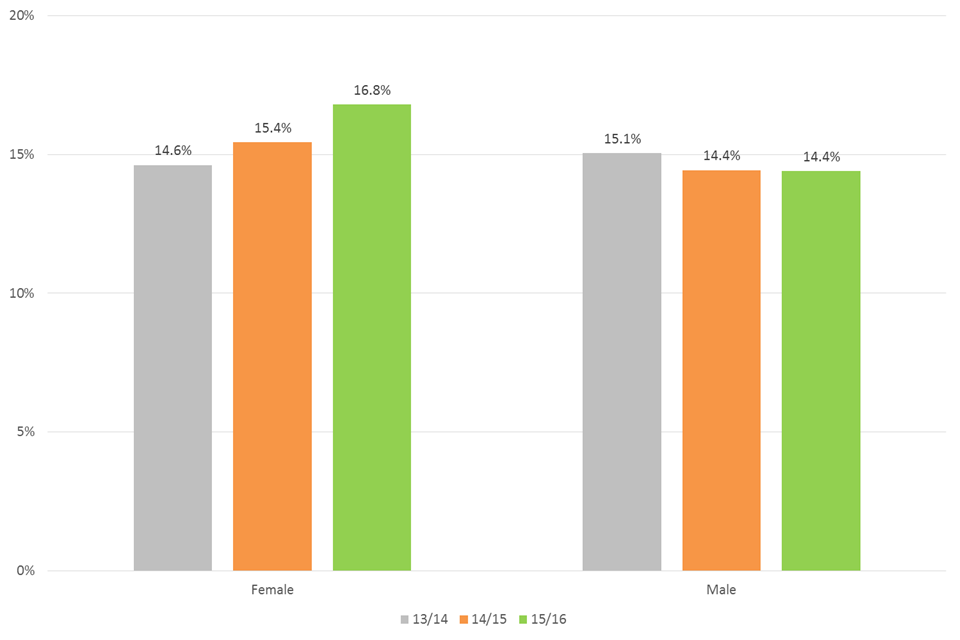
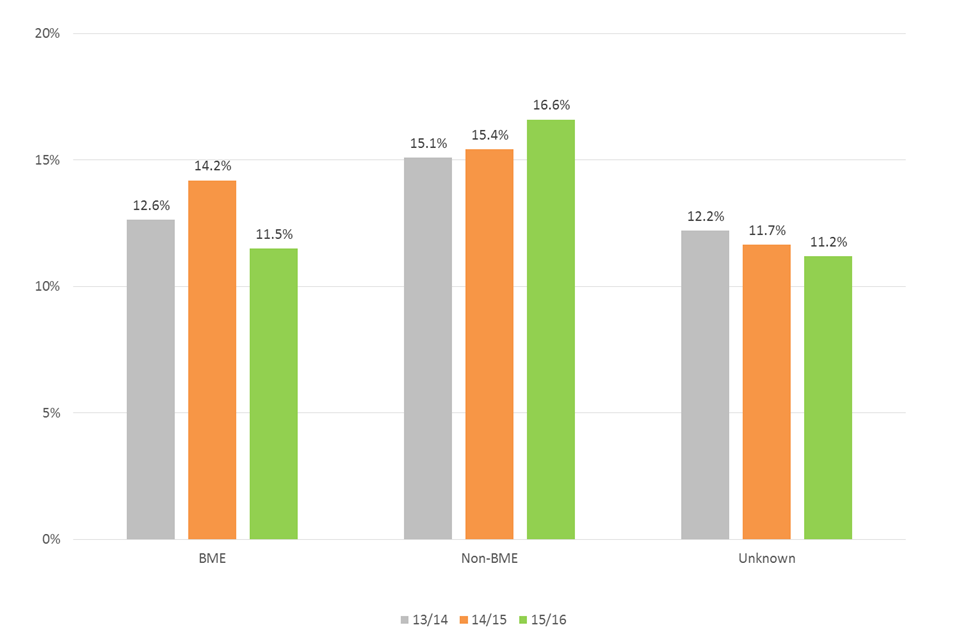
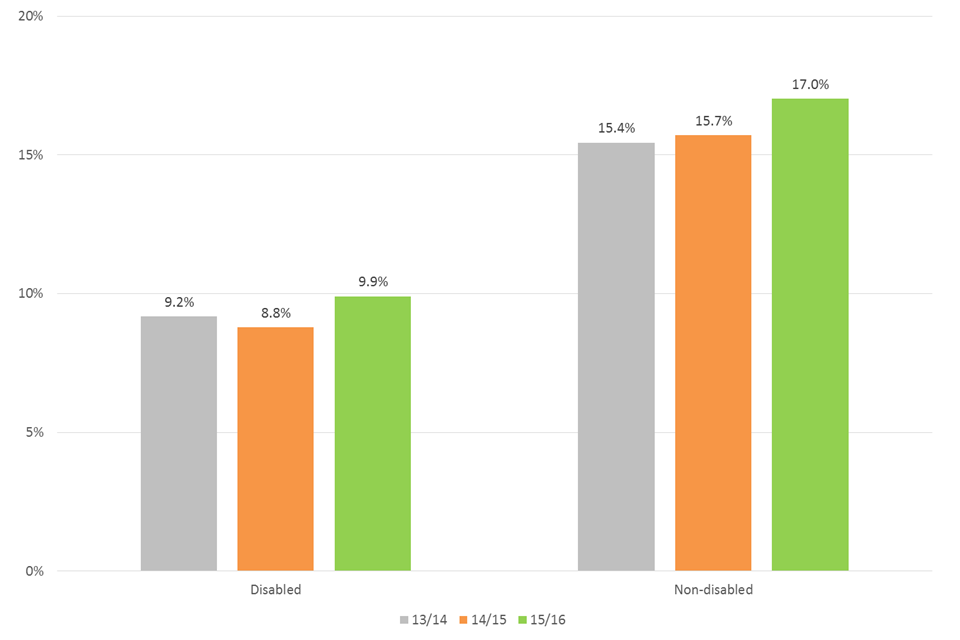
This tells us that:
- the distribution of performance rating was relatively similar to last year, with a 0.8% increase in Exceeded rating, a 0.1% decrease in Met rating and a 0.7% decrease in Must Improve rating
- there was a decrease in the percentage of staff receiving a top performance marking for grades APP, RO, RE2(L) and SRE
- the percentage of BME staff receiving a top performance marking decreased by 2.7% and non-BME increased by 1.2%
Figure 8.1: Top performance markings by gender
8.1
Figure 8.2: Top performance markings by ethnicity
8.2
Figure 8.3: Top performance markings by disability
8.3
Figure 8.4: Top performance markings by grade
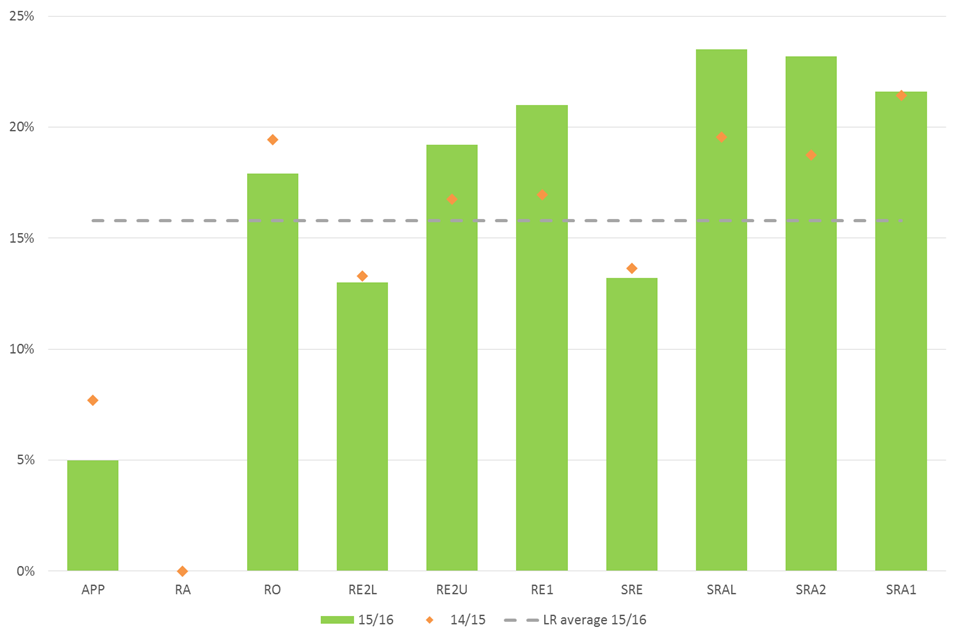
8.4
Figure 8.5: Top performance markings by working pattern
8.5
Figure 8.6: Top performance markings by age
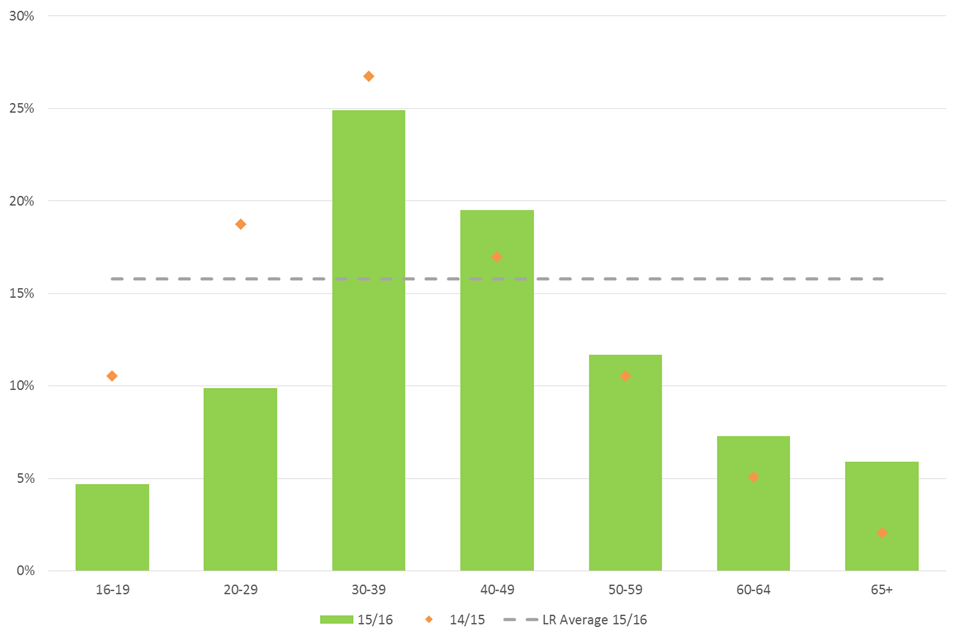
8.6
1.9 Training and development
Land Registry is committed to developing its workforce and ensuring all staff have access to training and development. Data is collected from Civil Service Learning and from information collected at a local office level.
This tells us that:
- the diversity analysis in regards to receiving training was in line with the workforce profile
- the percentage of female, disabled or part-time employees who received training were similar to those not in those categories
Figure 9.1: Training and development received by staff shown by gender
| Gender | % of training received | % of total headcount | % of group received training |
|---|---|---|---|
| Female | 62% | 60% | 73% |
| Male | 38% | 40% | 69% |
Figure 9.2: Training and development received by staff shown by ethnicity
| Ethnicity | % of training received | % of total headcount | % of group received training |
|---|---|---|---|
| BME | 3% | 4% | 57% |
| White | 87% | 85% | 73% |
| Other | 0.3% | 0.4% | 47% |
| Unknown | 10% | 10% | 69% |
Figure 9.3: Training and development received by staff shown by disability
| Disability | % of training received | % of total headcount | % of group received training |
|---|---|---|---|
| Disabled | 9% | 9% | 69% |
| Non-disabled | 84% | 84% | 72% |
| Unknown | 7% | 7% | 70% |
Figure 9.4: Training and development received by staff shown by work pattern
| Working Pattern | % of training received | % of total headcount | % of group received training |
|---|---|---|---|
| Full-time | 63% | 64% | 71% |
| Part-time | 37% | 36% | 73% |
Definitions of the terms in the table above:
- % of training received:
percentages shown are the number of employees who received training by protected characteristic over the total number of employees who received training - % of total headcount:
organisational profile for protected characteristic - % of group received training:
percentages shown are the number of employees who received training by protected characteristic over the total number of employees in the organisation that have declared the protected characteristic. An even distribution is shown where the figures for the protected characteristic and outside the protected characteristic are equal
1.10 Grievances and disciplinary
Five formal grievances were raised during 2015/16.These figures do not include informal grievances which are dealt with by management at a local level and are not recorded centrally.
It is difficult to draw any conclusions as the numbers are so small. However three grievances were raised by female staff members and one by a member of staff who had declared themselves as from a minority ethnic background.
Ten formal disciplinary cases were recorded centrally in Land Registry. Again, the numbers are too small to draw conclusions but three involved female staff, one member of staff who had declared themselves as from a minority ethnic background.
1.11 Employee engagement
The results are taken from the Civil Service People Survey conducted in October 2015. Overall there were 2,624 returns which is a 60% response rate. At the end of the survey staff were asked to complete a diversity monitoring form, which is voluntary. Not all members of staff who completed the survey itself disclosed their diversity information and of those who did fill out the diversity monitoring section, not all staff filled in all categories. From the data that was available, the following table shows their engagement indexes cores.
This tells us that:
- the engagement index score for each group increased from 2014, with the exception of staff who had declared their sexual orientation as lesbian, gay or bisexual (LGB)
Table 5: Engagement index score 2015 by characteristic
| Engagement Index 2014 | Engagement Index 2015 | Change 2014-2015 | |
|---|---|---|---|
| Land Registry | 49 | 53 | +4 |
| Disabled | 45 | 47 | +2 |
| Female | 54 | 56 | +2 |
| BME | 46 | 58 | +12 |
| LGB | 48 | 46 | -2 |
| Part-time | 47 | 51 | +4 |
2. Steps taken to ensure due regard to the Public Sector equality duty
2.1 How Land Registry delivers diversity
There are both external and internal drivers for diversity. The aim is to drive behavioral and cultural change and to articulate the business case for diversity across the service. The following summarises the various ways in which we deliver diversity and how we measure our success.
Governance structure
The Diversity Panel chaired by the Head of Diversity provides strategic direction. This includes monitoring progress against equality objectives along with setting accountabilities and leadership for Land Registry’s diversity agenda. The group is comprised of Diversity Board Champions and chairs of our diversity staff networks, along with representatives from HR and Digital Services.
The Diversity Working Group, led by the Head of Diversity, proactively identifies and raises diversity-related issues which affect staff and customers so they can be considered and addressed. The group acts as advisers to the organisation on the equality analysis process and identify solutions to mitigate impact where necessary. This group is comprised of members of the Black Asian and Minority Ethnic (BAME) Employee Network, the Disability Employee Network (DEN), the Lesbian Gay Bisexual and Transgender & Allies (LGBT) Network and the Women’s Network.
In addition to our Diversity Panel and Working Group, Land Registry has diversity champions at senior management team level. Our diversity champions act as leaders for diversity and equality. This includes acting as role models, taking action when appropriate and addressing behaviours when necessary.
Strategic equality objectives
Our equality objectives enable Land Registry to focus attention on the priority equality issues to enable the delivery of improvements in policy-making, service delivery and employment. Actions under our equality objectives are reviewed annually and the Diversity Panel monitors progress against how well we succeed in meeting the objectives.
We want to be ambitious and therefore have set two strategic overarching equality objectives, which form part of our Land Registry Business Plan. The equality objectives are four-year goals.
Internal equality objective: to drive a culture of inclusion and respect within Land Registry and positively seek to improve engagement with staff with protected characteristics. The action plan that sits behind the overall objective for 2015/16 is split into the following key areas:
- improve knowledge of our workforce
- challenge cultural attitudes within performance management
- increase the diversity of our workforce through recruitment, talent and promotion practises so that it better reflects society
- deliver Removing Barriers programme framework
- ensure Land Registry change programmes and policy reviews fully consider diversity implications
- work with staff at all levels, up to and including the Land Registry Board, to increase personal learning and development of diversity and inclusion
- prepare evidence for new equality objectives 2016-2020
External equality objective: to equip our staff to identify, anticipate and satisfy our customers’ diverse needs by delivering products, services and channels at a cost we can both afford. The action plan that sits behind the overall objective for 2013/14 is split into the following key areas:
- customer understanding – improve understanding of the impacts of Land Registry’s service on diverse customer groups
- new services – ensure new digital services are accessible and useable by the widest range of customers, dealing effectively with those customers who cannot use digital services
- customer handling and service – improve the delivery of customer service and handling in line with the requirements of the Equality Act 2010 (EA) to diverse groups of customers.
2.2 Progress on strategic equality objectives
We have continued to deliver our strategic equality objectives which form part of the Land Registry Business Plan.
Research with our employees with disabilities has been a key project this year. This research identified concerns around workplace culture, performance management, attendance management and workplace adjustments. The findings of this research now forms part of our revised strategic equality objectives. In response to the initial finding of the research we introduced Workplace Adjustment Passports for all employees with workplace adjustments in place, and line managers attended workshops on objective setting for performance-related workplace adjustments.
We have continued to run a number of campaigns or opportunities for employee involvement with the diversity and inclusion agenda. We have increased our employee declaration levels across the organisation and we gained external recognition for our work in this area at the 2015 Employers Network for Equality and Inclusion (ENEI) Awards. In addition our declaration video has been recognised as best practice across the Civil Service.
Our diversity networks have continued to play a proactive role in supporting diversity and inclusion issues for the organisation. This has included delivering successful history month campaigns, and introducing a round of coffee morning events at local offices. We have also launched a new Women’s Network. Primarily this network is aimed at increasing the number of women in our information technology directorate, but we aim to extend the network across Land Registry in 2016.
We have reviewed the role of local diversity champions which opened up this opportunity to more junior staff. New champions are in place and a conference was held in October to support them in their new role. Over the past 12 months champions have promoted diversity activities, for example Birkenhead Office staff have run Dementia Friend training, workshops delivered by the Alzheimer’s Society to staff and managers, and the Time to Talk mental health awareness. Our staff at Leicester Office held a lunchtime event to celebrate Diwali.
Finally our external equality objective has focused on ensuring we deliver the best service to our diverse customers. This has included analysis of diverse user needs for the development of new services, along with assisted digital. We have undertaken usability testing at the Government Digital Service (GDS), pop-up research in customer information centres in local offices and local libraries, and testing with a pool of users. We have also reviewed our guidance for staff dealing with vulnerable customers.
2.3 Diversity improvements for 2016/17
To ensure we continue to mainstream the diversity agenda across Land Registry, our strategic equality objectives are due to be refreshed as per the Equality Act 2010 (Specific Duties) Regulations 2011. We have made positive progress on our equality objectives; however there are still low levels of minority ethnic employees across our workforce, concerns around perceived inequalities in appraisal outcomes, and lower levels of engagement from our under-represented groups.
Progress on our customer-facing activities has been good. Analysis of diverse user needs is in place for the development of new services, including Assisted Digital, and is required as part of the GDS approvals process. Therefore work on ensuring equality of access for all customers in regards to new services will be integrated into the digital roadmap. This will negate the requirement for a standalone equality objective.
Additionally, issues relating to customer handling and alternative formats will form part of business as usual.
Our proposed equality objectives for 2016 to 2018 aim to focus on these key areas and consist of the following three objectives:
- objective one: To increase the diversity of the workforce by ensuring volume recruitment exercises reflect the economic active population in strategic locations
- objective two: To challenge inequalities within performance management
- objective three: To enhance the professional capability of our people through a greater application of diversity and inclusion approaches
In addition, objective one will form part of our organisational key performance indicators and will be owned by HR.
Our proposed objectives will also ensure Land Registry meets its requirements under the Civil Service Talent Action Plan which sets out concrete measures to remove barriers and ensure the most talented people succeed and reach the top positions, regardless of who they are and what their background is.
3. List of figures and tables
Find out the graphs, charts and tables you need:
- Table 1: Declaration rates held for Land Registry workforce
- Table 2: Grade structure
- Table 3: Land Registry targets 2016
- Table 4: Distribution of performance ratings 2015/16
- Table 5: Engagement index score 2015 by characteristic
- Figure 1: Workforce composition by gender, disability, ethnicity, working pattern, sexual orientation and age
- Figure 2.1: Percentage of Land Registry staff across grades
- Figure 2.2: Gender distribution by grade
- Figure 2.3: Age distribution by grade
- Figure 2.4: Disability distribution by grade
- Figure 2.5: Ethnicity distribution by grade
- Figure 2.6: Working pattern distribution by grade
- Figure 3.1: Percentage of applicants at different stages of the recruitment process by gender
- Figure 3.2: Percentage of applicants at different stages of the recruitment process by ethnicity
- Figure 3.3: Percentage of applicants at different stages of the recruitment process by disability
- Figure 4.1: Promotion by gender
- Figure 4.2: Promotion by ethnicity
- Figure 4.3: Promotion by disability
- Figure 4.4: Promotion by working pattern
- Figure 5.1: Temporary promotion by gender
- Figure 5.2: Temporary promotion by ethnicity
- Figure 5.3: Temporary promotion by disability
- Figure 5.4: Temporary promotion by working pattern
- Figure 6.1: Number of staff returned from maternity leave
- Figure 7.1: Percentage of total leavers by reason
- Figure 7.2: Percentage of reason for leaving by gender in relation to total number of leavers in that group
- Figure 7.3: Percentage of reasons for leaving by indicated ethnicity in relation to total number of leavers in that group
- Figure 7.4: Percentage of reasons for leaving by indicated disability in relation to total number of leavers in that group
- Figure 7.5: Percentage of reason for leaving by working pattern in relation to total number of leavers in that group
- Figure 8.1: Top performance markings by gender
- Figure 8.2: Top performance markings by ethnicity
- Figure 8.3: Top performance markings by disability
- Figure 8.4: Top performance markings by grade
- Figure 8.5: Top performance markings by working pattern
- Figure 8.6: Top performance markings by age
- Figure 9.1: Training and development received by staff shown by gender
- Figure 9.2: Training and development received by staff shown by ethnicity
- Figure 9.3: Training and development received by staff shown by disability
- Figure 9.4: Training and development received by staff shown by work pattern
4. For further information
If you require this document in an alternative format or more detailed information regarding raw equality data, please contact:
Diversity Team
HR Service Centre
PO Box 10452
Castle Wharf House
2 Canal Street
Nottingham
NG1 9JR
Email: CMS.HRsupportdesk@landregistry.gov.uk
Telephone: 0300 006 2523