Land Registry Equal Pay Audit
Published 11 December 2015
Applies to England and Wales

© Crown copyright 2015
This publication is licensed under the terms of the Open Government Licence v3.0 except where otherwise stated. To view this licence, visit nationalarchives.gov.uk/doc/open-government-licence/version/3 or write to the Information Policy Team, The National Archives, Kew, London TW9 4DU, or email: psi@nationalarchives.gov.uk.
Where we have identified any third party copyright information you will need to obtain permission from the copyright holders concerned.
This publication is available at https://www.gov.uk/government/publications/land-registry-equal-pay-audit/land-registry-equal-pay-audit
Land Registry recently reached a collective agreement to end pay progression for employees in grades below the Senior Civil Service (SCS). Following implementation, an equal pay audit has been carried out which can also be used as a benchmark for any proposed future pay system.
The provisional results for the Annual Survey of Hours and Earnings 2014 (Office for National Statistics, ONS) show that the gender pay gap across the United Kingdom has narrowed to 9.4% for full-time employees and to 19.1% for all employees (full-time and part-time), the lowest on record. ONS calculations are based on medians.
In Land Registry any gender pay gaps at each grade are minimal due to the consistency of pay practices (see Appendix 2). However due to the differing levels of incidence between men and women across the grading structure, patterns emerge when the information is examined holistically.
61% of Land Registry staff on 1 July 2015 were female.
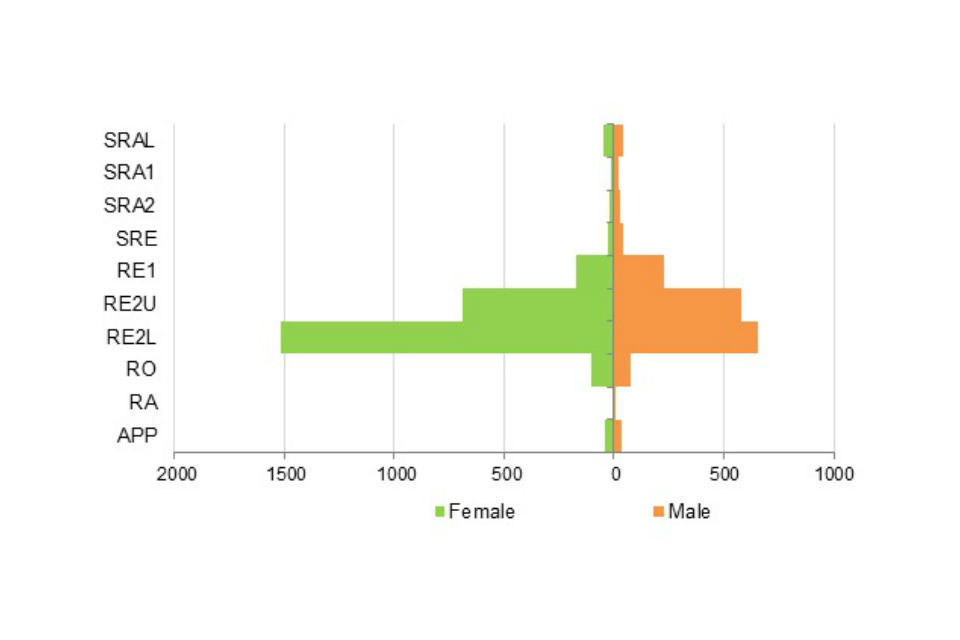
1. Land Registry grading structure at 1 July 2015
- Senior Civil Service (SCS)
- Senior Registration Administrator 1 (SRA1)
- Senior Registration Administrator Lawyer (SRAL)
- Senior Registration Administrator 2 (SRA2)
- Senior Registration Executive (SRE)
- Registration Executive 1 (RE1)
- Registration Executive 2 Upper (RE2U)
- Registration Executive 2 Lower (RE2L)
- Registration Officer (RO)
- Registration Assistant (RA)
- Apprentice (APP)
grading structure
2. Findings
The main findings across all staff grades are outlined below. A pay gap in favour of a potentially disadvantaged group would be shown as a minus percentage.
2.1 Basic Salary
The chart above demonstrates that a high proportion (58%) of female staff is in a single grade, Registration Executive 2 Lower (RE2L), compared with 38% of men. This has a significant impact on the overall average salary for female staff.
Table 1: Pay gap analysis by gender
| Female | Male | Total | Pay Gap |
|---|---|---|---|
| 2628 | 1707 | 4335 | 8.2% |
Pay gaps between full and part-time staff are widely recognised as a contributory reason behind gender pay gaps. However, at Land Registry the pay gap between full and part-time staff is lower than the gender pay gap, so work pattern is not a major factor.
Table 2: Pay gap analysis by work pattern
| Part-time | Full-time | Total | Pay Gap |
|---|---|---|---|
| 1610 | 2725 | 4335 | 6.7% |
The pay gap for full-time staff is lower than that for all staff, but it is significantly higher for part-time staff. 65 per cent of part-time staff work at grade Registration Executive 2 Lower (RE2L) or below compared with 56% of the overall workforce.
Table 3: Pay gap analysis by work pattern and gender
| Female | Male | Total | Pay Gap | |
|---|---|---|---|---|
| Part-time | 1381 | 229 | 1610 | 13.4% |
| Full-time | 1247 | 1478 | 2725 | 4.7% |
The data does not show any significant pay gap between black and minority ethnic (BME) and white staff, but it should be noted that the number of staff who have not declared their ethnicity is more than twice the number who have declared themselves as Minority Ethnic. Land Registry is currently carrying out an initiative to increase declaration rates.
Table 4: Pay gap analysis by ethnicity
| BME | White | Declined/not known | Total | Pay Gap |
|---|---|---|---|---|
| 183 | 3741 | 411 | 4335 | 0.2% |
61% of staff who have declared themselves as having a disability work at grade Registration Executive 2 Lower (RE2L) and below compared with 56% of the overall workforce.
Table 5: Pay gap analysis by disability
| Disabled | Non-disabled | Declined/not known | Total | Pay Gap |
|---|---|---|---|---|
| 342 | 3767 | 226 | 4335 | 3.5% |
The highest pay gap is for Head Office staff, where 63% of male staff are at grade RE1 (Registration Executive 1 ) and above, compared with 48% of female staff.
Table 6: Pay gap analysis by function
| Female | Male | Total | Pay Gap | |
|---|---|---|---|---|
| Head Office | 272 | 209 | 481 | 10.8% |
| Information Systems | 128 | 241 | 369 | 6.3% |
| Local Office | 2228 | 1257 | 3485 | 5.5% |
2.2 Protected pay
311 staff are in receipt of mark time payments, mainly as a result of relocation or loss of allowances. 50% of these are male and 50% are female.
2.3 Skills/specialist allowances
The male to female ratio in Information Services is 65:35.
| Female | Male | Total | |
|---|---|---|---|
| Accountancy | 1 | 11 | 12 |
| Audit | 2 | 2 | 4 |
| IT | 108 | 208 | 316 |
| Senior Legal | 5 | 6 | 11 |
3. Summary
Any equal pay gaps within pay grades are minimal, although it can be seen that there are some gaps across the organisation as a whole resulting from the grade profile.
Our wider diversity and inclusion agenda endeavours to ensure that, where development and progression opportunities arise, fair and equitable processes will mean that women can compete on a level playing field with their male counterparts. We work to increase the diversity of our workforce through recruitment, talent and promotion practices to better reflect society and this will further erode any pay gaps.
3.1 Appendix 1: Methodology
- Data from Human Resources System as at 1 July 2015, following application of the pay progression buy-out and before any pay award for 2015.
- Based on total full-time equivalent salaries in the pay band, excluding allowances, mark time and overtime.
- Employer’s National Insurance contributions and superannuation excluded.
- To prevent skews, all salaries are treated as though they are on National pay scales, ie pay scales for London have been placed on their equivalent position on the National pay scale.
- Average (mean) salary is calculated as total full-time basic salaries for the pay band divided by the headcount.
- Senior Civil Service (SCS) not included.
- Pay gap calculated as difference between the average salary of the potentially advantaged and disadvantaged groups, then divided by the average salary of the advantaged group. A minus result signifies that the potentially disadvantaged group is actually doing better.
- Not known/not declared are excluded from the calculation.
3.2 Appendix 2: Average of Full-Time Equivalent (FTE) salary on national pay scales by grade
| Grade | APP | RA | RO | RE2L | RE2U | RE1 | SRE | SRA2 | SRA1 | SRAL | All staff |
|---|---|---|---|---|---|---|---|---|---|---|---|
| Female | £16,702 | £16,913 | £19,645 | £24,126 | £30,300 | £37,066 | £45,068 | £56,077 | £67,612 | £60,938 | £27,653 |
| Male | £16,702 | £16,913 | £19,645 | £24,142 | £30,353 | £37,111 | £44,895 | £56,855 | £67,965 | £61,099 | £30,126 |
| All staff | £16,702 | £16,913 | £19,645 | £24,131 | £30,324 | £37,091 | £44,957 | £56,504 | £67,818 | £61,017 | £28,627 |
| Gender pay gap | 0.0% | 0.0% | 0.0% | 0.1% | 0.2% | 0.1% | -0.4% | 1.4% | 0.5% | 0.3% | 8.2% |