HMRC issue briefing: calculating the 2015 to 2016 tax gap
Published 26 October 2017

© Crown copyright 2017
This publication is licensed under the terms of the Open Government Licence v3.0 except where otherwise stated. To view this licence, visit nationalarchives.gov.uk/doc/open-government-licence/version/3 or write to the Information Policy Team, The National Archives, Kew, London TW9 4DU, or email: psi@nationalarchives.gov.uk.
Where we have identified any third party copyright information you will need to obtain permission from the copyright holders concerned.
This publication is available at https://www.gov.uk/government/publications/issue-briefing-calculating-the-2015-to-2016-tax-gap/hmrc-issue-briefing-calculating-the-2015-to-2016-tax-gap
1. What is the tax gap?
The tax gap measures the difference between tax due and tax collected by HMRC.
HMRC looks across all taxes to calculate the tax gap. These include income tax, VAT, Corporation Tax, hydrocarbon oils duties, stamp taxes, alcohol and tobacco duties, Capital Gains Tax and others, such as Inheritance Tax, customs duties and Landfill Tax.
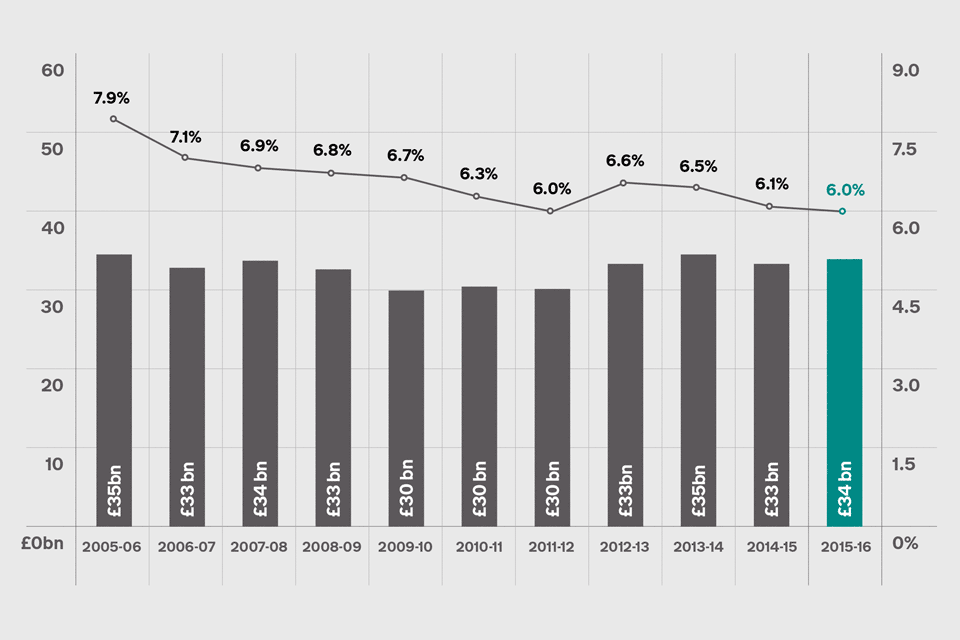
This graph shows the tax gap and percentage of liabilities: tax year 2005 to 2006, to tax year 2015 to 2016. It also shows the size of each tax gap as a percentage of the total amount of tax owed.
When comparing over time, it’s more meaningful to measure the tax gap as a percentage of liabilities because this is not affected by rate changes or changes in the size of the economy.
2. Why we measure it
We estimate the tax gap because it provides a useful tool for understanding the relative size and nature of non-compliance. It is impossible to collect every penny owed in tax – for example, we cannot legally collect taxes from companies that owe tax and are insolvent. The tax gap underpins our overall approach in helping the honest majority to get their tax right and makes it hard for the dishonest minority to cheat the system.
We’ve published tax gap figures for every tax year since 2005 to 2006, to show broad trends in compliance and because we believe it’s important to be transparent in our work. We are the only country that does this across all taxes.
3. Latest calculations
We estimate the 2015 to 2016 tax gap was 6% of total tax and duties due to HMRC (£34 billion) – a fall from 6.1% in 2014 to 2015. The tax gap has reduced from 7.9% in 2005 to 2006 when we first started measuring it.
The tax gap figures are calculated after deducting the money we’ve brought in or recovered as a result of our proactive intervention, from people who have got their tax wrong or wilfully evaded paying their taxes.
Every year the tax gap is subject to revision. HMRC adjusted the figures for 2014 to 2015, from £36 billion (6.5%) to £33 billion (6.1%) because we replaced projected information with actual data, informed by investigations and improved data analysis – for example, using new research on the hidden economy.
3.1 VAT
The VAT gap is at its lowest historical level of 9.8% (£12.6 billion) in 2015 to 2016, compared to 10% (£12.4 billion) the year before, and has fallen from 13.6% in 2005 to 2006.
3.2 Corporation Tax
The Corporation Tax gap is at its lowest level at 6.4% (£3.3 billion) in 2015 to 2016. There is a long-term reduction in the Corporation Tax gap from 13.7% in 2005 to 2006.
3.3 PAYE
The Pay As You Earn (PAYE) tax gap was £3 billion in 2015 to 2016 representing 1.2% of total tax due. The PAYE tax gap fell from £4.1 billion (1.7%) in 2013 to 2014 following the introduction of Real Time Information (RTI) for PAYE in 2013, which led to information on payroll taxes being recorded more accurately and more frequently.
3.4 Alcohol
The alcohol duties tax gap was 7.5% in 2015 to 2016 compared to 10.9% the previous year. The total alcohol tax gap was £1.3 billion in 2015 to 2016, with an £840 million associated loss in alcohol duties. Associated VAT loss was £410 million.
3.5 Customer behaviour
The tax gap can be described as the tax that is lost through a range of behaviours — non-payment, use of avoidance schemes, legal interpretation of the tax effects of complex transactions, error, failure to take reasonable care, evasion, the hidden economy and criminal attacks on the tax system.
Failure to take reasonable care is the largest behavioural component of the tax gap for 2015 to 2016, estimated at 18% of the overall tax gap (£6.1 billion).
3.6 Hidden economy
The term hidden economy refers to taxable economic activity that is entirely hidden from HMRC. This includes undeclared economic activity involving what we call ‘ghosts’ – whose entire income is unknown to HMRC – and ‘moonlighters’ – who are known to us in relation to part of their income, but have other sources of income that HMRC does not know about.
The hidden economy tax gap estimates are no longer based on experimental methodology. HMRC commissioned a large and robust research project to develop a greater understanding of the scale and characteristics of those participating in the hidden economy. The research findings enabled HMRC to produce a much more accurate estimate of the extent to which the hidden economy contributes to the tax gap. Fewer people are operating in the hidden economy than we estimated previously, and their average incomes are lower.
The hidden economy tax gap is estimated at £3.5 billion (0.6%). Estimates for previous years have been revised downwards and show that the hidden economy tax gap has remained relatively stable since 2009 to 2010 at around 10% of the overall tax gap.
3.7 Tobacco
As well as our main ‘Measuring tax gaps’ publication, we also publish a separate report on the tobacco duty tax gap for the most recent financial year.
The tobacco duty tax gap is made up of the illicit market in cigarettes and hand-rolling tobacco. It is estimated to be £2.5 billion in duty and VAT in 2016 to 2017, compared to £2.4 billion in 2015 to 2016. The duty tax gap was estimated to be 17% in 2016 to 2017 and also in 2015 to 2016.
This increase in the estimated tobacco tax gap is due to the methodology we use, where we compare legitimate cigarette consumption, which has reduced, to the size of the illicit cigarette market. This illicit market has been relatively stable and appears to have reached a stubborn core, resulting in the small increase for 2016 to 2017 compared to the year before.
4. Quality of the calculations
Tax gap calculations are a complex series of measurements and the estimates are subject to constant revision. The estimates are produced in accordance with the Code of Practice for Official Statistics which assures objectivity and integrity.
We have access to data that covers most tax sources, and use illustrative statistics in a consistent way where limited evidence is available.
5. Our approach to tackling the tax gap
The best way to tackle non-compliance is to prevent it happening in the first place, while cracking down on the minority who do bend or break the rules. HMRC’s approach involves:
- promoting compliance by designing it into our systems and processes, helping customers get things right from the very start
- preventing non-compliance by using the data we have to spot mistakes, personalise services and support, block fraudulent claims, and automate calculations
- responding by identifying and targeting the areas where there may be tax risk – and using tough measures to tackle those who deliberately try to cheat the system.
We’re providing a range of services and activities to help customers get their tax affairs right from the start, so they’re more likely to be compliant in future. These include:
-
targeted support and guidance for new and start-up businesses
-
producing ‘Tax Facts’ learning packages on tax obligations for schools
Between 2010 and 2015, the government invested £1 billion in HMRC and made more than 40 legislative changes to tackle evasion, avoidance and non-compliance, closing down loopholes and introducing major reforms to the UK tax system. This investment and the changes put in place have helped to achieve one of the lowest tax gaps in the world. Key legislative changes include:
-
changing the economics that made avoidance worthwhile by introducing Accelerated Payments and follower notices, bringing in more than £4 billion since April 2014[footnote 1]
-
strengthening the Disclosure of Tax Avoidance Scheme regime where people involved in tax avoidance need to inform HMRC about the scheme under the disclosure rules or face a penalty - the number of schemes disclosed has fallen by 95% since 2005 to 2006, with 28 disclosed in 2016 to 2017
-
clamping down on avoidance of stamp duties with a range of measures in 2014, including the new Annual Tax on Enveloped Dwellings, which ensures that owners of higher value residential property who use corporate ownership structures, pay a fair share of tax
-
new powers to access data from merchant acquirers’ credit and debit card terminals on sales made by retailers, to help identify those operating in the hidden economy or not declaring their full sales
The government provided HMRC with £800 million at Summer Budget 2015, which will allow us to secure a forecasted £7.2 billion of additional tax revenue by 2020 to 2021. The government also announced over 35 further legislative changes to tackle avoidance, evasion and aggressive tax planning. Together, these will help HMRC to continue to keep the tax gap low, and reduce it further.
5.1 Changing customer behaviour
Failure to take reasonable care is the largest behavioural component of the tax gap. We are tackling this by making it increasingly easy, more efficient and cost-effective for customers to deal with us, as this drives compliant behaviour.
More than 13 million individual customers are now using Personal Tax Accounts and all businesses have access to their own Business Tax Account. These digital accounts allow customers to view and manage their tax affairs online in one place, in as close to real time as possible. They can register for new services, update their personal information and see how much tax they need to pay. This increasingly personalised service provides prompts, advice and support through webchat and secure messaging.
In addition, for businesses, digital record-keeping software will eventually link directly to HMRC systems, allowing customers to send and receive information directly from their own choice of software.
HMRC’s full report Measuring tax gaps contains detailed information about the tax gap and how we measure it.
-
Accelerated Payment notices require those who have entered into tax avoidance schemes which are under HMRC investigation to pay the disputed tax upfront within 90 days. If people use a tax avoidance scheme that has the same or similar arrangements to one that HMRC has successfully challenged in court, HMRC will check their tax affairs and may send a follower notice ↩