HMRC issue briefing: calculating the 2013 to 2014 tax gap
Updated 23 October 2015

© Crown copyright 2015
This publication is licensed under the terms of the Open Government Licence v3.0 except where otherwise stated. To view this licence, visit nationalarchives.gov.uk/doc/open-government-licence/version/3 or write to the Information Policy Team, The National Archives, Kew, London TW9 4DU, or email: psi@nationalarchives.gov.uk.
Where we have identified any third party copyright information you will need to obtain permission from the copyright holders concerned.
This publication is available at https://www.gov.uk/government/publications/issue-briefing-calculating-the-2013-to-2014-tax-gap/hmrc-issue-briefing-calculating-the-2013-to-2014-tax-gap
1. What is the tax gap?
The tax gap is the difference between the amount of tax due and the amount collected. It is impossible to collect every penny theoretically owed in tax, so a ‘tax gap’ will always exist. For example, we cannot legally collect taxes from companies that owe tax and are insolvent.
1.1 Tax gap and percentage of liabilities: tax year 2005 to 2006, to tax year 2013 to 2014
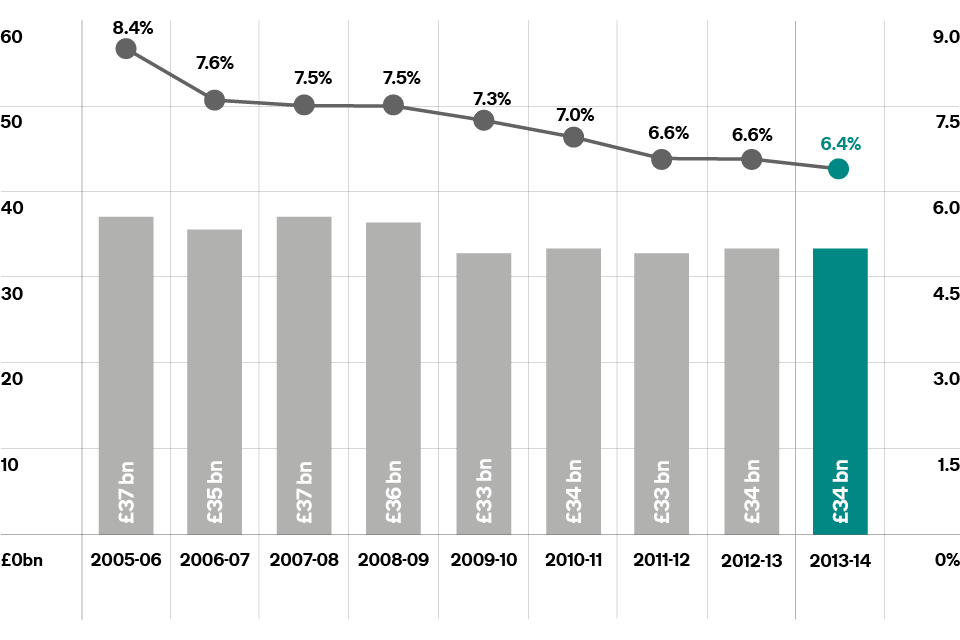
Graph showing tax gap and percentage of liabilities: tax year 2005 to 2006, to tax year 2013 to 2014.
When comparing over time, the tax gap as a percentage of liabilities is a more meaningful measure because it is not as affected by rate changes or changes in the size of the economy.
2. Why we measure it
The tax gap is an official statistic. We estimate the tax gap because it provides a useful tool for understanding the relative size and nature of non-compliance.
Tax gap calculations cannot be used for precise performance management for a variety of reasons. For example, some components take a long time to calculate, the estimates are not accurate enough and figures can change when new data becomes available.
We publish tax gap figures every year to show broad trends in compliance and because we want to be transparent in our thinking on this important issue of public interest.
3. Latest calculations
We estimate the 2013 to 2014 tax gap was 6.4% of total tax and duties due to HMRC, which equates to £34 billion, after we deduct the money we bring in through our compliance activities. This indicates that more than 93% of tax due was paid in the tax year 2013 to 2014. The percentage tax gap shows a long-term downward trend between 2005 to 2006 and 2013 to 2014.
Changes in tax rates and other external factors, such as economic growth, also affect the tax gap, so it is most appropriate to present it as a share of total tax liabilities. The percentage tax gap trended downwards overall from 8.4% in 2005 to 2006 (the first year it was compiled) to reach 6.4% in 2013 to 2014.
The current tax gap estimate of £34 billion is £11 billion lower than it would have been if the percentage tax gap had remained at the 2005 to 2006 level of 8.4%.
The Corporation Tax gap has seen the largest reduction which, through steady attrition, has halved since 2005 to 2006.
3.1 Corporation Tax gap and percentage of liabilities: tax year 2005 to 2006, to tax year 2013 to 2014
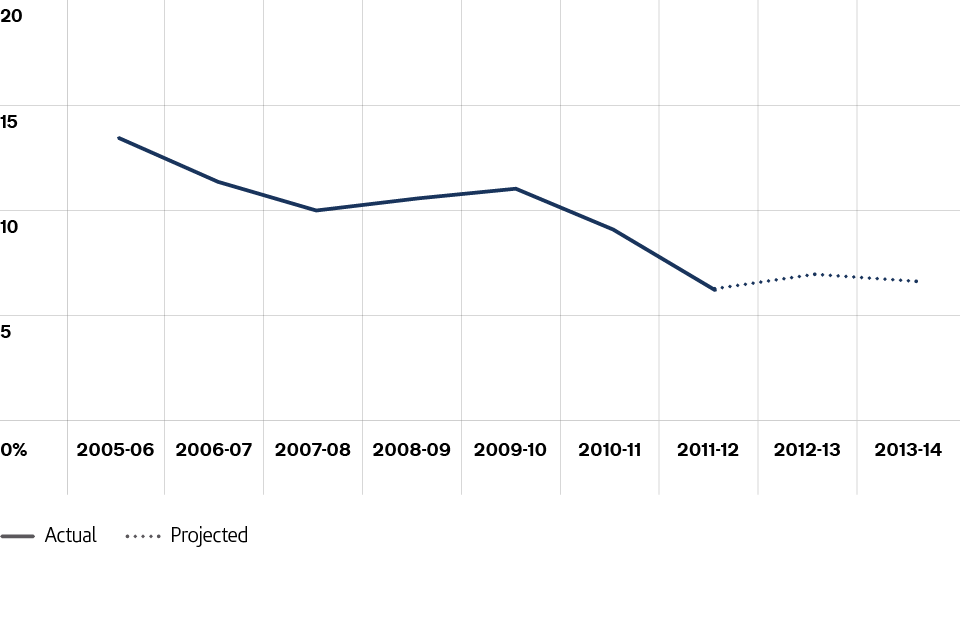
Graph showing Corporation Tax gap and percentage of liabilities: tax year 2005 to 2006, to tax year 2013 to 2014.
As a proportion of the total Corporation Tax that should, in theory, be paid, it declined from 14% in 2005 to 2006 to 7% in 2013 to 2014. We are seeing a sustained downward trend for both large and small businesses, with the overall reduction driven mainly by the largest businesses. Our latest analysis suggests a shift away from corporate avoidance behaviour which reflects well on HMRC’s approach to large businesses.
The VAT gap estimate broadly shows a downward trend since 2005 to 2006. The 2013 to 2014 VAT gap estimate is 11.1% of the tax that should, in theory, be paid, or £13.1 billion, which is slightly lower than the 2012 to 2013 estimate in both percentage and cash terms.
An estimated £800 million was lost in alcohol duties in 2013 to 2014, which is nearly 8% of all the tax that should, in theory, be paid. Since 2008 to 2009, the estimated alcohol tax gap has typically been around seven to eight per cent of liabilities. It peaked at 11.4% in 2010 to 2011, and dipped to 5.5% in 2012 to 2013. The overall trend appears broadly flat, and as there is some volatility in the data source, we shouldn’t put too much weight on year-on-year fluctuations.
Alongside tax gap estimates for 2013 to 2014, we are also publishing tobacco tax gap estimates for 2014 to 2015. The tobacco tax gap is a complex calculation, comprising the tax gaps for both cigarettes and hand-rolling tobacco.
The overall tobacco tax gap declined steadily from 2000 to 2001, to 2011 to 2012. Recent years have seen small increases in the illicit market shares for cigarettes and hand-rolling tobacco. For cigarettes, overall consumption has continued to decline while the amount of illicit consumption has remained flat, leading to an illicit market share between nine and ten per cent in the last few years.
The illicit market share for hand-rolling tobacco increased to 39% in 2013 to 2014. Latest figures suggest this has fallen to 35% in 2014 to 2015.
4. Quality of the calculations
Tax gap calculations are a complex series of measurements; this is partly why very few countries produce a tax gap estimate. We have access to data that covers most tax sources, and use experimental statistics in a consistent way where limited evidence is available. Because we have had our calculations reviewed and endorsed by the International Monetary Fund, we are confident that our calculations are as accurate as they can be. We publish our methods and set out clearly any changes we make.
To put the £34 billion tax gap in context, we collected £505.8 billion in tax during 2013 to 2014. The figures, combined with our own customer research, show more than 93% of tax due is paid by UK taxpayers, with only a small minority choosing to bend or break the rules.
5. Our approach to tackling the tax gap
Calculating the tax gap helps us focus on more targeted compliance activity by helping to identify the root causes of non-compliance among our different customer groups.
The way we tackle non-compliance is through our ‘Promote, Prevent, Respond’ approach which aims to make paying tax simple and efficient for the compliant majority through promoting good compliance and preventing errors when they deal with HMRC. This allows us to target and respond in a more robust way with the small minority intent on cheating the tax system.
We delivered year-on-year increases in compliance yield since the tax year 2011 to 2012, in line with or above the annual targets set by the Chancellor. This improvement in performance means that more money is available to the Exchequer because we collected tax that would otherwise not have been paid and prevented error or fraud that would have cost the Exchequer money.
Our approach to organised criminal attacks, for example, on the VAT or excise systems, consists of developing fraud-resistant systems and using cutting-edge data analysis and investigation to target those involved in a wide range of serious criminal activity. Harnessing the power of all the data available to us means we can deliver more targeted compliance activity, personalise services for customers and create better policy using the insights collated from this information.
We have taken effective and innovative action to tackle avoidance with tougher tools and structural reforms. We are now stopping more avoiders who try to exploit the tax system, and taking action against promoters of avoidance schemes. Our recent powers have changed the economics of tax avoidance by reducing the incentives for entering into avoidance schemes and increasing the downsides of engaging in avoidance.
We prevented £2 billion from being lost to the UK through tax avoidance and evasion in 2014 to 2015, against a target of £1.79 billion. Our anti-avoidance strategy underpins our approach to tackling tax avoidance across all customer groups. By preventing avoidance at the outset where possible, detecting it early and countering it effectively through legal challenge or legislative change, our strategy is delivering significant successes against tax avoiders and those who promote tax avoidance schemes. In one case alone, we protected an estimated £635 million after the Court of Appeal ruled against a tax avoidance scheme.
One of the most significant tools that we now have to tackle avoidance by individuals and companies is the ‘Accelerated Payments’ legislation introduced in 2014. This means those who have entered tax avoidance schemes which are under investigation may now be required to pay the disputed tax upfront within three months. A year into the scheme, more than 25,000 Accelerated Payment notices have been issued, and more than £1 billion collected. By the end of 2016, we expect to have completed issuing around 64,000 notices, bringing forward £5.5 billion in payments to the Exchequer by March 2020.
Large business customers pay the majority of Corporation Tax, and a large percentage of VAT and PAYE taxes. Our approach to large business is to improve compliance through close monitoring, identifying high-risk areas of non-compliance, and assembling dedicated project teams to tackle the most serious cases. A relatively small number of tax risks produce most of the additional revenue raised.
We know most small and medium-sized enterprises (SMEs) want to pay the right amount of tax, but we estimate that this customer group is responsible for half the value of the tax gap. Making errors and failing to take reasonable care in dealing with us are the main reasons why the gap for this customer group persists. These are also relatively small amounts spread across a large number of taxpayers.
We already provide a wide range of tailored and targeted support to help customers get things right at key points in their business lifecycle. Completing the transition to a personalised digital tax account for our 5.2 million business customers and pre-populating information on tax returns and other forms will reduce error across not just our business customers, but all our customer groups.
By finishing the delivery of our multi-channel digital services we will make the reporting and payment of tax quicker and easier by using information from our customers and other government organisations to assess and then collect taxes and pay entitlements quickly and accurately. This is central to the government’s Making Tax Easier commitment that was announced at Budget 2015. By linking customer data and our systems more closely, it reduces the scope for errors, enables more efficient tax collection through greater efficiency, and will ultimately help reduce the tax gap.
Most taxes paid by individual customers are collected by their employers, so one priority is to support employers and make it easier for individuals to contact us about adjustments to their tax affairs. The introduction of Real Time Information for PAYE has paved the way for significant improvements in accuracy, and will continue to reduce the need for customers to contact us to sort out their tax affairs.
Find out more about measuring the tax gap.