Moving out to move on: understanding the link between migration, disadvantage and social mobility
Updated 31 July 2020
Applies to England

© Crown copyright 2020
This publication is licensed under the terms of the Open Government Licence v3.0 except where otherwise stated. To view this licence, visit nationalarchives.gov.uk/doc/open-government-licence/version/3 or write to the Information Policy Team, The National Archives, Kew, London TW9 4DU, or email: psi@nationalarchives.gov.uk.
Where we have identified any third party copyright information you will need to obtain permission from the copyright holders concerned.
This publication is available at https://www.gov.uk/government/publications/internal-migration-and-social-mobility-moving-out-to-move-on/moving-out-to-move-on-understanding-the-link-between-migration-disadvantage-and-social-mobility
Moving out to move on
Understanding the link between migration, disadvantage and social mobility
Research report
July 2020
1. Foreword
For many, moving away from where you were born seems to be as critical as ever to getting a good job, enhancing earnings and becoming more socially mobile. But does this always need to be the case? What can we do to revolutionise opportunity in the regions and start turning the tide?
Our report confirms that many still travel to London and the south-east in search of those streets paved with gold – as they have for generations.
Most of the best-rewarded jobs are still concentrated in London. It also shows starkly that most who choose to move are from privileged backgrounds and have university degrees.
When those from disadvantaged backgrounds living in deprived areas do move, they are often limited to choices in equally deprived areas.
Those who stay put tend to be from poorer backgrounds and often end up in low paid jobs. As a result, they have fewer choices to build the life they want for themselves in their home community, where they have roots and connections.
Our research builds up an interesting, but worrying profile of ‘movers’ and ‘stayers’. More than half of movers have a degree, compared with a third of stayers, and almost 60% of movers have one parent in a higher managerial occupation, against 40% of stayers. The data also shows that those who move do far better financially than those who remain. They earn 33% more and are more likely to end up in professional jobs.
Stayers are more likely to be unemployed and less likely to be employed in a professional job. But our interviews show that there are many positive reasons for choosing to stay where you grew up. Several stayers reported a heightened sense of family and community connection and well-being. This should be heeded and nurtured by local leaders.
1.1 Spreading investments
Investing in the regions is not new. Successive governments have pledged varying amounts of cash for the regions and poorer areas for decades. Power and public funds have been decentralised to metro mayors and city regions to allow them to invest in better transport structures, affordable housing and local business. There are good universities as well as mushrooming arts and cultural activities.
But much of this support is happening in cities and urban centres. More needs to be done for smaller towns, rural and coastal areas. The exodus from other regions to London and the south-east cannot just go on and on.
So, what can be done? There will need to be a combined effort to rebuild the economy after COVID-19. We must mitigate the trade-offs involved in becoming socially mobile and ensure that opportunity relies much less on geography. You should not have to move to prosper.
At present, there are real drawbacks to living outside cities. Good universities are often located in urban areas and access to healthcare can be patchy in rural districts. Public transport links can also be poor there. Government, local councils, employers and educators can now seize this chance to rebalance geographical inequities and plan for more targeted local investment and support. Levelling up needs to happen within regions as well as nationally.
1.2 Working differently
COVID-19 has shown that we can begin to do things differently. Homeworking has been successful for many employers and for particular job roles. It has also shown that people’s views about where they want to live, and why they want to live there, may be shifting.
Many people, after being cooped up in flats during the pandemic, have spent months yearning for a garden or outside space. Now those potentially unconstrained by a daily commute may choose to move outside the capital or urban centres to get more space at a cheaper cost to raise their families.
They might be prepared to commute for longer if the journey is only once or twice a week. Home working, often with high wages, could boost local economies too. Employers less constrained by established physical headquarters could enrich their recruitment pools by targeting new employees in new places.
National employers could equally develop relationships with high-quality FE colleges in the regions to explore ways of nurturing students who want to remain and commit to their hometown or area.
1.3 Remote provision
All employers should take flexible working seriously and, where possible, build it into their plans for the future. It should not only be a privilege afforded to those on higher incomes. But to make this a reality for many they need access to a digital outlet – a smart phone, a laptop or a tablet. At the moment, 1.9 million households in the UK do not have access to the internet.
On education, universities and colleges should work together in their regions to ensure a high-quality, flexible, local provision for students from all backgrounds. Local and regional planners ought to ensure they have the social, housing and infrastructure needed to retain some of those who grew up in their areas and attract others to settle and build their lives there.
Local councils, metro mayors and larger employers should also join forces to strengthen a cultural sense of community identity.
Moving will still matter and we should encourage it for social mobility, but it should be through choice, not necessity. People should no longer have to make the trade-off between community, family and economic prosperity. Staying should be just as important and as attractive as moving and this should be championed.
Sandra Wallace and Steven Cooper,
Interim Co-Chairs, Social Mobility Commission
2. Executive summary
The Social Mobility Commission is committed to creating a fairer Britain in which everyone, regardless of where they live, has a decent chance of a better future.
The Commission’s 2017 State of the Nation report showed that social mobility is geographically segregated. In that report, the terminology of ‘cold spots’ and ‘hot spots’ allowed us to categorise and compare local authorities across a range of mobility indicators and shine a light on the importance of place in discussions about social mobility. It remains the case that there are significant opportunities for work and study in London and the south-east, but these are less prevalent in other areas – in particular, the north of England and Wales.
The Commission’s 2018/2019 State of the Nation report built on this work. It noted that people from a working-class background were less likely to migrate to London or other areas where more opportunities were available. At the same time, it suggested outward migration of young people could potentially widen the opportunity divide between areas in Great Britain if it led to substantial workforce shortages in the sending areas.
The Commission was concerned by these findings and wanted to do more to get beneath the skin of the link between internal migration and social mobility. This project is an attempt to do that by exploring:
- who leaves deprived areas and how that varies across Great Britain
- how much employment outcomes vary between those who leave and those who stay
- if life improves for those who migrate
- what the impact of outward migration is on those left behind
- the reasons people leave or choose to stay in deprived areas
People do migrate from poorer areas, but are 4 times more likely to go to areas with similar or higher levels of deprivation. At the same time, outward migration of young people could potentially widen the opportunity divide between areas in Great Britain if it leads to substantial workforce shortages in the sending areas.
The peak age for movers throughout the UK is the early 20s. Historically, this has reflected moves to study or find work. However, widespread disruptions caused by COVID-19 may reduce such opportunities, particularly for young people, over the next few years.
2.1 Socio-economic and demographic profiles
Movers also vary considerably in terms of socio-economic profile. Education level is a big driver, with 56% of movers having a degree compared with under two-fifths of stayers. Individuals with higher socio-economic status are also more like to migrate. Around 60% of movers and 40% of stayers have at least one parent belonging to a higher managerial occupation.
Demographically, women move more than men. Internal migration rates for women are up to 16% higher than men for moves between areas of similar high opportunity. In some cases, this reflects their pursuit of flexible working arrangements to balance employment and childcare commitments.
Data shows outcomes for movers to be far better than for those who remain. Mean gross real monthly earnings for movers are £2,327, compared with £1,739 for stayers – 33% higher.
2.2 Methods of investigation
This project uses mixed methods to investigate the link between internal migration and social mobility. More specifically, it looks at:
- who leaves deprived areas and how that varies across Great Britain
- how much employment outcomes vary between those who leave and those who stay
- whether life improves for those who migrate
- the impact of outward migration on those left behind
- the reasons people stay or choose to leave deprived areas
2.3 Main findings
People from a higher socio-economic background are the most geographically mobile group
People from more affluent backgrounds are more likely to move to study or work than those from working-class backgrounds. Nearly 60% of movers have one or both parents belonging to a higher managerial occupation, compared with 40% of stayers. Over half of movers (56%) have a degree, while less than two-fifths of those staying behind do.
Such movers are more likely to move to more affluent areas than those from a lower socio-economic background, but also to relocate to more deprived areas. While in some instances this could be beneficial for the economy of the receiving area, it also risks gentrification.
Internal migration might not be equalising opportunity between deprived and affluent areas, as migration flows are higher between areas with similar levels of deprivation
Migration outflows from the most deprived areas are mainly directed towards other deprived areas. An individual from a poor community is 4 times more likely to move to another deprived area than somewhere with better opportunities.
Similarly, migration from the best-off areas is mainly directed towards equally prosperous locations or places with higher levels of deprivation. This means that geographical segregation of opportunity could be reinforced further by such flows.
One important cause of the differences in these migration flows is the relative housing costs between sending and receiving areas. These differences may be a barrier to moves from deprived areas to more affluent ones.
‘Movers’ experience better employment outcomes than stayers
Movers, including those moving from the most deprived areas, are more likely than ‘stayers’ to be employed, to be employed in a higher-level occupation, and to earn more. These differences are partly explained by movers being more highly educated, from higher socio-economic backgrounds and more economically motivated than stayers.
The picture is less rosy for those who stay behind. Men who stay in the most deprived regions are 14.3 percentage points less likely to be employed at the highest occupation levels, compared with men who move on. And women stayers are 7.8 percentage points less likely to be employed in professional or technical occupations, compared with women movers.
Differences between the employment outcomes of movers and stayers from disadvantaged backgrounds are more significant than differences in employment outcomes between movers and stayers from affluent backgrounds
Although movers from all backgrounds have better employment outcomes than stayers, the chance to choose to move matters more for those from disadvantaged backgrounds. Unemployment is higher among stayers (8.2%) than movers (3%). And in terms of socio-economic progression, only 30.2% of stayers from a routine and manual socio-economic background reached higher managerial or professional occupations, compared with 47.1% of movers from similar backgrounds.
The difference in employment outcomes between those who stay and those who move from disadvantaged backgrounds is more significant than the difference between moving and staying for people from more advantaged backgrounds.
Those who move to affluent city centres do not necessarily have an overall greater quality of life than those who stay where they grew up
The qualitative research found that there were differences in the quality of life between those living in more and less deprived areas with respect to:
- Cost of living: The high cost of living was a problem for people who moved to London, but was less so for those who moved to other large city centres. This was not an issue for stayers in deprived areas. This was further supported by the quantitative analysis, which showed that the proportion of movers owning their home was almost 10 percentage points lower than for stayers.
- Social connections: Movers to large city centres often experienced isolation and loneliness when they moved, but this was mitigated over time. Most stayers enjoyed strong social connections within their local communities.
- Healthcare: Movers to large city centres reported better access to healthcare compared with their previous experience in deprived areas, whereas stayers in more deprived areas felt that healthcare provision kept deteriorating over time.
- Education: Movers had better educational opportunities than stayers in more deprived areas.
-
Public transport: Public transport was much better for movers in large city centres than for stayers in deprived areas, even though some movers in London mentioned that it was costly.
- Social activities: Movers in large city centres had many opportunities to engage in hobbies and social activities. Stayers in deprived areas, on the other hand, did not have many activities, and some of the available activities were quite costly.
This report matters for 2 key reasons. It highlights that the choice people make to move location is a critical one. There are clear benefits and advantages to moving, but generally this opportunity is far more available to those from affluent backgrounds. Put simply, not everyone who wants to move is able to do so.
Secondly, it underlines the important cultural, personal and familial reasons people may choose to stay in the area where they grew up. Unfortunately, because some of these areas lack both economic and social infrastructure, the choice to stay means fewer better-paid jobs, not as many social activities, poorer healthcare and less in the way of educational opportunity.
2.4 Policy suggestions and considerations for decision makers
The Commission sees this report as the beginning of a conversation with leaders around the country about how they can contribute to an environment where the trade-offs between staying and moving are less severe than they are now. The suggestions below start to tease out the questions we think local leaders should be considering as they think about their role in improving choice for all people, regardless of where they live and where they call home.
College Principals and Vice-Chancellors
Policy suggestions:
Education: Universities and colleges should work together to ensure each local area has a comprehensive, coherent and flexible local education offer for school leavers and adults.
Questions for consideration and reflection:
How can collaboration trump competition to address local and regional gaps in educational provision?
How can institutions tackle the social and financial barriers faced by those from less advantaged backgrounds who move to study?
Local authority leaders, community groups, metro mayors and large employers
Policy suggestions:
Building place identity: Local authorities, metro mayors, community groups and bigger employers ought to join forces to strengthen the cultural sense of place identity in every local community.
Questions for consideration and reflection:
What are the anchor institutions in each ‘place’ that can take the lead in harnessing the history, identity and prosperity of a place to foster a sense of identity?
How can local leaders give enough strategic priority to building or re-building place identities?
How might this approach differ in communities where populations might be more transient?
Local authority leaders, employers, education leaders, local enterprise partnerships
Policy suggestions:
Local labour markets: Local authorities and employers should work with colleges and training providers to identify and correct any mismatch between local skills and local needs. This will enable effective and dynamic reskilling programmes where necessary, and provide the basis upon which public and private sector institutions will have the confidence to relocate.
Questions for consideration and reflection:
What capacity do local authorities have to actively identify the skills needs in their areas, and do they have the relevant input from employers of different sizes, to do so?
Do colleges, universities and other training providers have enough dynamism to respond to the changing labour market in particular geographical areas?
Is there enough deep and consistent engagement between colleges and employers to ensure there are smooth transitions between education and employment?[footnote 1]
Local authority leaders, metro mayors and combined authorities, local enterprise partnerships, housing associations, transport planning officials and the Ministry of Housing, Communities and Local Government
Policy suggestions:
Local Infrastructure: After jobs and education, digital infrastructure and skills, transport connectivity and good quality housing are the 3 most essential ingredients to enable places to attract new people and retain others. These must be at the forefront of leaders’ thinking in rebuilding after COVID-19.
Questions for consideration and reflection:
How much do local leaders engage with their counterparts in neighbouring areas? How might metro mayors build strong towns, or city hub and spoke models, which consider social mobility and promote inclusive growth at the heart of planning in housing and transport?
How might the skills for digital participation be delivered strategically across local areas for vulnerable groups?
Employers
Policy suggestions:
Geographically diverse workforces: Many employers, where possible, have embraced remote working out of necessity during the pandemic. Now, as part of a commitment to social mobility, employers should think about recruiting and establishing progression pathways beyond their traditional physical headquarters and think about how flexible working arrangements can diversify the geography of their talent pipelines.[footnote 2]
Questions for consideration and reflection:
How can more employers build workplace cultures which are not necessarily location-centric?
3. Introduction
3.1 Aims and objectives
This report investigates the link between internal migration and social mobility and explores the extent to which migration from deprived to prosperous areas leads to better employment outcomes and quality of life in general. It also looks at the level and direction of migration flows from deprived areas, and how outward migration affects people who do not move. We spoke to people directly, and we analysed data that showed how people moved around the country.[footnote 3]
3.2 Research context
Drivers of intergenerational social mobility
Parents affect their children’s future socio-economic status through the transmission of human capital, social capital, financial capital and other personal characteristics.[footnote 4] Social attitudes and cultural beliefs might also affect a person’s socio-economic trajectory. Black and Devereux identified correlations between parents’ and children’s attitudes towards welfare receipt, working hours preferences and risk-taking behaviours. Even though a causal link is not easily identifiable, these associations suggest there are potential mechanisms other than parents’ socio-economic status through which a parent can affect their child’s socio-economic outcomes.[footnote 5]
Education is one of the most prominent drivers of socio-economic status and hence socio-economic mobility. Yet it can also be a considerable barrier to social mobility. Blanden and others showed that although educational attainment in Britain has increased substantially over time, this has benefited children whose parents were already well off , compared with children whose parents were less affluent.[footnote 6]
While educational attainment has increased over time, there is little evidence that educational inequality is improving. This inequality in attainment persists at every stage of the education system. Furthermore, the returns from education for children from disadvantaged socio-economic backgrounds are lower than those of their more advantaged peers, even if they are similar in all other characteristics. More specifically, individuals from lower socio-economic backgrounds earn less than those from higher socio-economic backgrounds – even if they are similar in all other characteristics, including education level, prestige of university and subject studied.
Equality of educational opportunity is seen as the main route to greater intergenerational mobility. Research is continuing to evaluate the effectiveness of educational equity policies. Interventions targeting very young children from disadvantaged backgrounds seem to be successful in providing them with the building blocks for a better future.[footnote 7]
Public expenditure on education is linked to decreased educational inequality and increased social mobility, while private expenditure (for example, via private schooling, tutoring) seems to do the opposite.[footnote 8]
The structure of the economy is also important in terms of social mobility. The ‘Great Gatsby Curve’ shows that countries with high levels of income inequality have low levels of intergenerational social mobility.[footnote 9] This may be because credit constraints and low redistributive systems obstruct poorer parents from investing in their children’s education, which in turn makes it more difficult for them to move up the social ladder.[footnote 10]
Focusing on differences in economic systems and their important role in promoting social mobility is useful when conducting international comparisons of intergenerational mobility, and when planning interventions at national level. A progressive tax and benefit system decreases intergenerational income persistence.[footnote 11] This is because higher earners pay higher taxes and receive lower benefits from the state. Children whose parents are higher earners will also be higher earners and so pay higher taxes.
The Nordic countries’ practice of combined investing in education and social security programmes is an example of how states can successfully promote intergenerational social mobility.[footnote 12] This joint approach is said to promote educational mobility at a younger age and protection from economic shocks later in life. These findings show that the economy is very important in determining intergenerational social mobility.
The effects of area of residence on intergenerational social mobility
The area of residence, with its existing educational and professional opportunities, is an important factor in social mobility. There is great diversity in economic performance between different areas in most developed countries. The geographical dimension and its role in promoting social mobility has been studied by geographers and more recently by sociologists and economists.[footnote 13][footnote 14][footnote 15] More affluent areas in the UK have been found to provide upward social mobility for individuals who live there already or who move there – mainly due to the clustering of opportunity and agglomeration effects.[footnote 16]
Chetty and Hendren found very strong effects of the area in which a child grows up on their chances of upward intergenerational social mobility within the US. They also found that the younger a child is when they start living in an area where levels of intergenerational social mobility are relatively high, the better their outcomes are as an adult.[footnote 17] Looking at the financial returns to studying different subjects, O’Leary and Sloane showed that the returns to education were much higher in London and south-east England compared with other parts of Britain.[footnote 18]
Given the great differences in employment opportunities, pay levels and types of jobs in different UK regions, the importance of location as a determinant of intergenerational social mobility is obvious. The Social Mobility Commission mapped geographical areas by opportunities for intergenerational social mobility and found great spatial variation in a range of proxy indicators capturing intergenerational social mobility.[footnote 19] Bell and others investigated the hypothesis of intergenerational social differences based on location and found large differences across regions within England and Wales.[footnote 20] Children born to low-skilled parents were more likely to experience upward occupational mobility if they lived in London, compared for example with those in Yorkshire and the Humber.
The positive effects of more affluent areas on upward social mobility are not necessarily homogeneous across the population. Friedman and Laurison found that individuals from more disadvantaged socio-economic backgrounds do not benefit from being in an affluent area as much as their peers whose families are better off.[footnote 21]
Although not always determinative, location does affect the chances of moving up the social ladder. Individuals born in areas with more economic opportunities can benefit from this, as can those who move to these areas to pursue careers.
Effects of migration on intergenerational social mobility
London and the south-east of England have been categorised as escalator regions – areas which offer highly skill-intensive and better-paid employment than the rest of the country.[footnote 22] Young people who move to these regions experience accelerated upward social mobility compared with young people who do not. This is due to the greater opportunities and agglomeration effects in such regions. Van Ham and others found that Edinburgh is also an escalator region, as individuals moving there have higher chances of upward intergenerational social mobility than elsewhere in Scotland.[footnote 23]
The relationship between more prosperous regions and social mobility might not be strictly causal. Areas with better jobs may attract highly skilled and motivated individuals who are more likely to be successful and move up the social ladder compared with their peers, regardless of location. If affluent regions have a higher proportion of this group of workers, it is likely that the higher social mobility in those areas is partly driven by them.[footnote 24]
This combination of area effects and personal characteristics makes it difficult to clearly identify the role of location on employment outcomes. Some of people’s characteristics are observable – for example, level of education, family income – and can be considered in the analysis.
However, some characteristics that make people more likely to succeed are unobservable – for example, motivation – and that makes it more difficult to clearly identify the effect of region on social mobility.
The importance of this effect was also noted by Duta and Iannelli.[footnote 25] They found that young individuals who moved out of the area where they were born and into an area with more job market opportunities were able to benefit from the positive effects of location on social mobility. However, this was not the case for individuals born and raised in prosperous areas. The self - selection process seems important when trying to identify the effects of migration on social mobility.
Trends and drivers of internal migration in Great Britain
Migration theory suggests that economic migration is driven by a decision process that involves comparing prospective earnings in a new area with the prospective earnings in the origin area, minus the costs of moving. If prospective earnings in the new area are greater than the sum of moving costs and earnings in the area from which the individual originates, the individual will decide to move. Prospective earnings are a combination of expected wage and the probability of finding employment. Migration costs include the psychological costs of moving to a new area – for example, not having any ties to the local community and having to build a new social and professional network – as well as the more obvious financial costs of the move.
The main drivers of internal migration, as discussed by Green, are:
- demographic, macroeconomic and labour market factors
- technological developments
- societal non-economic reasons
- a range of other market, regulatory and institutional factors[footnote 26]
Young adults have a higher probability of migrating to study compared with older age groups, with migration rates dropping as individuals grow older and have more commitments.
Economic drivers of internal migration are related to the pursuit of economic opportunity, and hence are expected to lead to out-migration from more deprived areas to more prosperous ones. Technological developments can partly reduce the likelihood of internal migration, as the need to make a permanent move is diminished if improvements in the speed and cost of transportation increase the viability of commuting.
The internet and information and communications technologies may have similar effects by reducing the need to be physically present in workplaces. Other important factors are housing costs and welfare support. Individuals who depend on the state for financial support during times of hardship face lower risk from moving away from their family and social support network, and so are more likely to migrate.
Champion identified a number of key trends in internal migration.[footnote 27] Firstly, the direction and scale of north–south migration has fluctuated over time – in part due to its relationship with the business cycle. Historically, there were net flows to the south, but this trend weakened and even reversed before the 2008 recession. Net flows are now small, but gross flows in each direction are large and have considerable consequences. North–south and south–north flows are very different, with the former largely due to migration by young, educated graduates.[footnote 28]
Since around 1990, there has been a reversal of a long-term UK trend towards urban decline, particularly within larger cities. Possible causes include expansion of higher education and programmes of urban renewal and development.[footnote 29] The effect of the 2008 recession on internal migration was also marked. The rate of migration out of London during the worst years of the crisis slowed down in response to changes in the housing market – although as the economy recovered, so did movements from London. Finally, there is evidence that the overall rate of internal migration has declined over the long term, with individuals making fewer long-distance moves on average in recent years than was common in past decades.[footnote 30]
Internal migration, social mobility and the COVID-19 pandemic
Given the substantial effect of the COVID-19 pandemic on economic activity and employment, it seems likely that migration flows will be disrupted for some time to come. The prolonged uncertainty and potential for future waves of coronavirus infections might lead prospective students to defer their studies, while those already in employment might delay potential moves for work.
Additionally, there is considerable evidence that entering the job market during a recession has permanent negative effects on future earnings and professional development.[footnote 31] These effects are likely to disproportionately affect vulnerable individuals, such as young people from disadvantaged backgrounds, increasing inequalities even further. The particular nature of this crisis means that unemployment is rising across all professions, with those in low-paid and temporary jobs at greatest risk of not having a route into good-quality, sustainable employment.[footnote 32]
The lockdown aimed at preventing the spread of COVID-19 has dramatically increased the rate of homeworking. This greater familiarity with remote working arrangements in some industries and professions may shift opinion on the part of both employers and employees as to its benefits. A more positive attitude towards working from home might decrease the need for migration or frequent commuting to access employment opportunities without reducing the rate of social mobility. However, the feasibility of working from home depends heavily on living arrangements. Furthermore, despite the potential for greater opportunities for social mobility, there may be some negative effects from homeworking for both employees and employers.[footnote 33]
4. Research findings: why we move
“I just kind of assumed [I would move away] to be honest … both of my parents are graduates and nearly all of my friends’ parents are graduates … we always knew we’d move away … you will leave because that’s what you do.” Male, 35, affluent area (having moved from disadvantaged area)
4.1 Introduction
This chapter presents the findings from the qualitative strand of research. It focuses on interviewees’ main reasons for moving to a new location or remaining or returning to the location in which they lived at the age of 14.[footnote 34] For those who had moved, it also examines the factors that facilitated this move – in either a material or an emotional sense. The final part of the chapter focuses on interviewees’ experiences in employment, their perceptions of their quality of life and how this has changed over time, and how this differs between ‘movers’ and ‘stayers’ within the research sample.
4.2 Characteristics of our interviewees
While many of those interviewed shared several similarities, there were also some differences. For example, we had a larger proportion of those from affluent areas who had higher-level qualifications compared with those living in disadvantaged locations. A greater proportion of participants in disadvantaged locations had dependent children compared with participants in more affluent areas.
In the in-depth interviews, a slightly higher proportion of interviewees were women. There was a broadly nationally representative spread of ethnicity – most interviewees across both focus groups were white, while the next-largest group comprised individuals from Asian backgrounds. Full details can be found in the accompanying technical report.
We found that interviewees’ educational attainment, and whether or not they had started a family at a young age, significantly influenced their subsequent life experiences and were strongly linked to whether they moved to an affluent area or stayed within, or returned to, a disadvantaged location.
4.3 Reasons for moving
Overview
Interviewees were asked about their main reasons for staying or moving, any factors that acted as barriers or facilitators to moving, and how common it was for people to move away from the area where they grew up.
Interviewees who had moved from a disadvantaged to an affluent area were asked about their main reasons for moving away from their hometown, and why they had decided to move to their current location.
Higher education
Many interviewees from both the in-depth interviews and the focus groups had first moved away from home to attend university. Most of these interviewees went to university shortly after finishing further education. They had assumed from an early age that they would pursue higher education and that they would move away from home to study. Many interviewees therefore had first considered moving during their teens, and frequently saw university as a ‘natural step’ following further education. This was especially common among interviewees with siblings or parents who had moved away for university.
Work
To find work or further their career was another key reason given by many interviewees for moving to an affluent area. Several had moved to affluent areas as these locations offered more opportunities to find professional jobs and work in their chosen field than were available where they grew up or, in the case of graduates, where they studied.
For example, interviewees hoping to find work in the media and charity sectors felt they had to move to the capital city to gain employment, as this was where major organisations in their field were based. Moving to find these types of job opportunities was particularly common in London, with 18- to 29-year-old focus group interviewees living in the city stating that they moved there almost entirely for career-related reasons. To a lesser extent, some individual interviewees who worked in ‘portable’ professions such as trades had decided to move to affluent areas due to the higher wages they could attract in these areas.
Many interviewees had moved without having secured a job and decided to look for work after moving to an area where they saw opportunities in their field. Their views were informed by their own research, as well as information obtained through their personal networks (family, friends and university tutors).
Others had secured work before making the move, with this being the main reason some interviewees had left their hometown. These were primarily jobs interviewees had sourced themselves, although in a few instances they had been headhunted, or transferred by a company they had initially worked for in their hometown.
Social connections
Social connections also played a key role in many interviewees’ decision to move. While this was often a secondary reason alongside moving for a job or to attend university, knowing friends or having family or a partner in an affluent area had frequently been a factor in interviewees’ decision to move. For example, some focus group interviewees in Edinburgh noted they were influenced by knowing friends or having family in the city when deciding where to study. Social connections were a secondary motivating factor for some individuals who had moved to find work. For a few interviewees, entering into a relationship with someone living in an affluent area had been the primary, or only, factor behind their decision to move.
Quality of life
Quality of life was another secondary factor raised by focus groups and individual interviewees. Many interviewees were motivated to move to an affluent area not only for work, university or relationships, but for leisure opportunities, culture and a desire for personal growth as well.
Some interviewees who had grown up in rural areas or small towns felt these areas did not provide the social and cultural life they wanted as they had grown older, and this had contributed to their desire to move away. In a few cases, this was the key factor behind interviewees’ decision to move. More often, quality of life was secondary to factors such as work, study and relationships in decision-making. Focus group interviewees who moved to an affluent area for university demonstrated this by considering factors such as culture, nightlife and scenery when deciding which institutions to apply to.
“It was quite exciting to move somewhere new and see what it was like and do something completely different … it was more the lifestyle I moved for than the job.” Female, 32, affluent area (from disadvantaged area)
4.4 Facilitators of moving
Interviewees who moved to an affluent area were asked about what had helped them to move.
Financial support
For most interviewees, financial resources covering the costs of living were the key facilitator in moving to an affluent area. Such resources took several forms. Securing a job in an affluent area was a major factor in moving, as it guaranteed movers the income needed to cover housing and other living costs.
Family members gave some interviewees practical or financial assistance to help with the move. Several interviewees relied on family members to move their possessions, as they could not afford a removal service. Occasionally, interviewees received substantial financial assistance from their family, including paying for a deposit on rental accommodation or a mortgage. In one case, the family paid for the first 6 months’ rent.
Some interviewees who moved without a job and did not receive family support worked in their hometown before their move to build up their savings to cover initial living and accommodation costs while they looked for employment. Loans or grants to study were major enablers for interviewees who moved away to attend university. Some who had attended university pre-2011 or in Scotland noted that free or cheaper tuition, as well as a grant, enabled their move from home.
Social connections
Having social connections in the affluent area they were moving to was another key facilitator for both interviewees and focus group participants. These connections provided practical, emotional and social support, and allowed interviewees to make the move.
Housing was a key consideration for movers, and many used social connections in their new city to find accommodation. A small number of interviewees were able to move in with family, while those who moved to be with a partner were able to share their accommodation.
Several interviewees drew on social connections with friends or family to find rental accommodation or as a source of temporary accommodation when they arrived in the affluent area. This helped with the practicalities of finding accommodation, as well as reducing the costs of housing compared with living alone. The importance of social connections to find accommodation was emphasised especially by interviewees in London, where the demand for housing and cost of living is high.
Some individual and focus group interviewees said that having friends and family in an affluent area provided a crucial base of emotional support and played a key role in their decision to move to this area. Several individuals who had moved noted that knowing friends and having family in the city reduced the apparent risk of being lonely in the new location, and also helped them make friends once they had moved.
“I didn’t have any fears about not making friends [in London] or anything because I’d spent time there with my friend and got on incredibly well in the short term, so I knew it was going to be a place I could easily slot into.” Male, 39, affluent area (having moved from disadvantaged area)
Views of interviewees who had moved to affluent areas on the likelihood of people moving away from the area in which they grew up
Interviewees who had moved to an affluent area were asked how common it was for contemporaries to move away from their hometown, and what impact they thought this had on their local community.
Most who had moved to an affluent area also knew a significant number of people who had moved away from their hometown, while many felt it was common for people to move away.
There were some exceptions to this. Interviewees from Lancashire and East Anglia who lived in remote communities where it was common for people to live their whole lives in one place said that they felt it was rare for people to move away.
Interviewees reported that the most common reason for people to move away was for university. Several interviewees said that all or most of their siblings and friends continued with full-time education after leaving compulsory education, with most moving away for higher education.
Many individual and focus group interviewees also knew people who had moved away for work, either to find opportunities in their field or to work in the same job for higher wages. Some interviewees identified lack of job opportunities as a key reason for moving away. A few also knew people who had moved away to be with a partner, although this was less common.
Most who had moved to an affluent area were unable to comment on the impact on the local community of people moving away. Some people felt that university graduates moving away meant a loss of skills and knowledge within the local community or contributed to high levels of low-skilled employment in the area.
4.5 Reasons for staying
Interviewees who had grown up and remained in a disadvantaged location were asked if they had ever moved away, or considered moving away, from their hometown.
Most individual and focus group interviewees had never moved away from their hometown, and many had never considered it. A few interviewees in disadvantaged locations had moved away for short periods of time – to either study or work elsewhere in the UK – and then returned home.
Reasons for returning included:
-
dropping out of university
-
not enjoying life in the new area
-
feeling homesick
-
having to return due to caring responsibilities, such as looking after older relatives, particularly among older interviewees with ageing parents, or to access support in caring for young children among new parents
Some interviewees had considered moving in the past and/or would consider moving in the future. Younger focus group interviewees said they would consider moving away for a job opportunity or to experience life in another place.
Older interviewees would also consider moving for work, as well as for cheaper housing. Some would also consider moving to improve their quality of life beyond better wages and a lower cost of living. Several older focus group interviewees considered moving to the countryside or outside of the UK to enjoy a slower pace of life, while a few also considered moving to bigger cities for improved cultural opportunities.
Among all age groups, such plans tended to be vague in terms of where and when they would move. Locations considered ranged from local areas to big cities across the country as well as abroad – particularly Australia and Spain.
While a significant number of interviewees who had moved to affluent areas did so to attend university, only a few in disadvantaged locations had pursued higher education, and none reported growing up with the expectation that they would move away to study.
Interviewees living in a disadvantaged location were also asked for their main reasons for staying in the place where they had grown up.
Family
Family was the key reason given for staying in disadvantaged locations by both focus group participants and interviewees. Many interviewees were parents raising children where they had grown up, while most had extended family living locally. They described having a strong connection to their hometown, with family roots in the area spanning generations and producing important emotional ties to the area.
Family connections and strong local networks of family and friends were important to many interviewees and contributed to high levels of wellbeing and happiness. These connections were key to many interviewees’ decision to remain in the disadvantaged locations where they grew up.
Family connections also produced practical reasons for staying, particularly among parents with young children. Parents in interviews and focus groups worried that moving away would disrupt the lives of their children by taking them out of school and away from their social network.
Some parents also drew on family connections as a source of childcare. Many reported they had considered moving for a job opportunity but calculated the gain in wages would be offset by increased childcare costs. A few interviewees in focus groups of older people also had caring responsibilities for parents that prevented them moving away.
“I’ve got family help here and if I had to move and pay for childcare, I probably wouldn’t gain that much.” Female, 33, disadvantaged area
“We [my family] are all very close. So, the thought of not having that community around you to look after the kids, or as a human have some quality time with your husband, or go out for dinner or socialise, or even just get together as a family, was massive for me.” Focus group participant, 30-49, disadvantaged area
Quality of life
Many interviewees who remained in disadvantaged locations enjoyed a good quality of life in their local areas – for themselves as well as their young family where they had dependent children. They felt they had everything they needed and saw no reason to move. These interviewees were able to find work and housing in their local area, were satisfied with the leisure and cultural opportunities available, and enjoyed close social connections to family and friends.
Several interviewees in disadvantaged locations also had good road and public transport links to bigger cities. These gave them access to leisure and cultural attractions, such as museums and music venues which were not available in their hometown.
4.6 Challenges of moving
Interviewees who had grown up and remained in a disadvantaged location were asked what had discouraged them from leaving their hometown, or what would be likely to discourage them from leaving in the future.
Complex commitments
Most interviewees across all age groups had complex commitments that rooted them to their local area. These included caring responsibilities, as well as partners, jobs, mortgages and, in a few cases, reliance on local services.
Commitments were particularly prominent among young parents, who cited family and children as key reasons for staying in the local area. Caring responsibilities for parents also prevented an immediate move for a few older interviewees.
Many interviewees felt that they would only be able to move after their children had grown up or their parents were deceased. Commitments were often acquired at a younger age than for those who had moved to an affluent area, with several interviewees in the focus groups for 18- to 29-year-olds having children and/or mortgages.
“Because I had a young family, I didn’t want to go off to university and leave my wife with two young kids.” Male, 34, disadvantaged area
Social and emotional risks of leaving
Beyond these practical difficulties, interviewees of all ages currently living in disadvantaged locations felt moving away was a risk, as they currently had a good quality of life in their local area. They tended to place high value on living close to family. Many discussed worries about moving outside their “comfort zone”, such as becoming socially isolated. For these interviewees, the risk of moving away outweighed potential gains such as job opportunities or cheaper housing.
“You’re so used to a certain area, and then you just go somewhere else, you’d feel a bit lost. I know I would, because I don’t like being out my comfort zone as it is.” Focus group participant, 18-29, disadvantaged area
Financial insecurity
Some younger focus group interviewees living in disadvantaged areas also mentioned financial reasons for staying. For a few interviewees, the cost of moving was too high, making it hard for them to leave their local community. For others, experiences of insecure employment meant that moving away felt like a risky prospect, since they could not rely on work to make ends meet. One participant in a focus group of 18-29-year-olds said the only thing stopping him moving away for work was being able to find temporary contracts, as he was not guaranteed sufficient income to cover his living costs in a new location, which would have left him in a vulnerable position.
Views of interviewees who had remained in disadvantaged areas on the likelihood of people moving away from the area in which they grew up
Interviewees of all ages in disadvantaged areas tended to know a few people who had moved, but this was not seen as common or the norm, as it was for many interviewees who had moved to affluent areas. Compared to this group, those currently living in disadvantaged locations tended to know fewer people who had moved away for university, although a few knew some who had done so. Younger interviewees knew more people who had moved within the UK for university – perhaps reflecting higher levels of participation in higher education among the younger generation. Older interviewees knew people who had moved to be with partners or for a better quality of life in terms of cost or pace of living, both within the UK and abroad. This included people moving for retirement.
Interviewees who stayed in disadvantaged locations were asked about the impact on their local communities of moves by others. Most spoke about the personal impact of people moving away, such as missing friends and losing some of their family support when relatives moved away. Younger focus groups felt that in-migration to the area, especially by those from outside the UK had a more noticeable impact on their communities than people moving away.
4.7 Experiences in employment
Overview
The qualitative research explored interviewees’ experiences in employment and observed how these varied between affluent and disadvantaged locations. Overall, interviewees’ experiences in employment appeared mixed and based on:
- their experiences in education and whether this helped clarify their career aspirations
-
the sector(s) they later decided to work in
- whether they had children and the parental roles they assumed in their household – for example, as the primary care giver or ‘breadwinner’
These factors were loosely associated with whether individuals had moved to an affluent area or had stayed within a disadvantaged location for most of their adult lives. We call these groups “affluent area movers” – those who had moved to a more ‘advantaged’ area from a less advantaged area and “disadvantaged location stayers” – those who had stayed in a less prosperous area.
a) Affluent area movers
First job in new location
As noted above, interviewees moved for a variety of reasons. Interviewees who had moved to a new location primarily for work were mainly university-educated, although a few were further education leavers. They were usually moving to take up an employment opportunity that would not be available in their hometown.
In several cases, interviewees commented they were either recommended for this role or had the vacancy signposted to them by a contact already working for the organisation in question. These contacts were either personal friends of the interviewees or individuals they had met on a work placement during a university or college course.
Individuals like this generally found their experience in the role positive. All were satisfied with the work they were doing. They found the work engaging and interesting and benefited from having friendly colleagues and, for those in larger organisations, a supportive management structure. Those working within large international companies also noted that they benefited from a high starting salary. This was enough to support their living costs and provided enough disposable income to allow them to spend time with friends, go shopping and avoid debt. They also felt they had adequate opportunities for progression in these roles in the form of salary increases and job promotions.
“It seemed like a lot of money at the time … I was like ‘I’ve never had this kind of money before. I’m rich!’” Female, 32, affluent area (having moved from disadvantaged area)
Individuals working for smaller organisations were less positive about pay and progression, given the financial constraints within these organisations. While salary was not their main motivation for taking these roles, some people, particularly those working in the charitable and not-for-profit and hospitality sectors, described salaries as very low. This was particularly true for those living in London and other larger cities. For some, this presented a challenge in finding suitable accommodation. They explained that it took them several months to find somewhere they could afford on their salary, during which time they had to lodge with family members who lived in the area.
Experiences in graduate-level roles contrasted with those of interviewees who did not move to affluent areas primarily for work-related reasons. Where interviewees relocated to be closer to friends or partners, some – particularly those fresh out of education – could be less discerning about the type of work they undertook when they first moved to the new location. Several noted that they were just looking for a means of earning a living and supporting themselves financially. Commonly, these individuals took sales jobs that were easy to obtain and provided an initial source of income. While the jobs did not offer a high degree of job satisfaction, and were often not the preferred form of work, they could offer a reasonable salary once commissions were taken into account.
Another group of interviewees who moved for similar reasons – to be closer to a partner, family or friends – but who had already started pursuing a particular career path in another location, had a different experience. All of these interviewees sought, and were able to access, job opportunities in their preferred line of work or in areas that matched their previous skills and experience. While their experiences were not location-specific, some encountered difficult and stressful working environments in their new roles, perhaps reflecting compromises in terms of the job opportunities they were prepared to take up to help facilitate a move.
In local government and the third sector, experience was mixed. Some interviewees noted there were limited opportunities to increase their pay and progression, whereas others were advised that they had a pay rise on moving into a new role.
A few interviewees highlighted other advantages in this employment compared with their previous job, including better access to progression opportunities, as well as a good pension and flexible working offer.
Career development since moving and current role
Interviewees described how their careers developed after taking an initial role and what they were doing for work at the time of the interview. Their accounts fell into 3 main categories:
-
Those who had changed jobs and moved into a different organisation for better prospects – pay, benefits, progression and personal development opportunities.
-
Those who made ‘sideways’ moves to pursue their interests and/or gain access to more personal development opportunities, without necessarily acquiring better prospects in terms of pay or promotion.
-
Those who sought a job that offered flexibility in their working pattern or greater job security after having children, typically matching their existing skills, experience and/or interests.
Accounts also presented common ‘push’ factors that led people to leave previous roles. These were not exclusive to any of the trajectories described above. They could include:
- a stressful, unsupportive and/or isolating work environment
- work that was unfulfilling and not matched to an individual’s interests
- low rates of pay and limited progression opportunities
Interviewees who followed the trajectories broadly categorised as group 1 typically worked for large national or international companies in the private sector and were pursuing vocations that were in high demand, such as banking, law, property management or engineering. These individuals had generally found it quite easy to find other well-paid work opportunities after becoming dissatisfied with their previous workplace.
Some had registered with recruitment agencies that directed them to suitable vacancies and saved time looking for other job opportunities while working full-time. These individuals gained better entitlements, such as increased holiday allowances, or had their employer pay for them to gain specialist qualifications. This group expressed a high degree of satisfaction with their current role and did not anticipate any changes to their employment in the short to medium term.
Those who had made ‘sideways’ moves in their career (group 2) tended to work either within smaller organisations in the private sector or for public bodies or charitable and not-for-profit organisations. Examples include people working:
- for a mental health trust within the NHS
- in a teaching and research post at a university
- for a small charity for elderly people
These individuals felt lucky to have found these positions in a very competitive environment. Some highlighted how these posts provided them with opportunities to work with leading experts in their field, or how they had benefited from personal support and encouragement from their line manager.
Nevertheless, interviewees pursuing careers in this area universally complained of the lack of security in these positions. They also flagged:
- low rates of pay – especially given the high cost of living in London and other larger cities
- only being able to find part-time work where they would have preferred to work full-time
- not being able to secure permanent employment
Overall, these individuals seemed happy with their jobs and their lifestyle in the area to which they had moved. However, limited finances and a lack of stability in their employment were ongoing concerns. These issues were mitigated partly by living with partners with a regular and sometimes higher income, or by finding more affordable accommodation through personal connections with landlords.
Interviewees supported the view that pay in these areas of work was low and did not adequately support the cost of living in these locations. While they were open to the idea that they might change jobs to increase their salary, the practicalities of doing so were challenging.
P1: “For me it’s having to go through the whole process of doing the applications; having to go to interviews. I haven’t done that in quite a while and I think that that’s sort of daunting.” Focus group interviewee, 30-49, affluent area
P2: “I don’t know if it’s just a case of …15 years ago, there were loads of jobs to choose from. You could pick and choose. And now they … come up once every couple of months and … when they do they are fiercely competitive, There are so many people fighting for them. So I would quite like to try a new job, but again it gets more stressful, so I think I don’t need the hassle of a new job when I’ve already got one.” Focus group interviewee, 30-49, affluent area
The interviewees who had sought more flexible working arrangements since having children (group 3) were predominantly women. In each case, their priority was to find something that suited their skills, experience and interests, but that offered a flexible working pattern – enabling them to fit employment around childcare commitments.
To accommodate this, interviewees had a variety of working arrangements, including self - employment, on-demand work under a zero-hours contract and part-time working with regular hours. The roles interviewees were undertaking included running their own catering business, social care and working as a telephone advisor in healthcare, as well as working in charitable organisations. These posts were related to interviewees’ previous work experience – for example in catering and hospitality or in the charitable and not-for-profit sectors.
Interviewees were generally positive about their experiences in these roles. They offered the flexibility they needed to work around childcare commitments and pick up children from nursery or school. Some interviewees, while welcoming this flexibility, expected to work more after having children and receive more support from their partners with childcare. Often, however, their partner continued in their full-time post. This meant that the interviewee worked less, producing a less even split in childcare responsibilities than they wanted.
While flexible roles provided income for households, salaries were low and partners who worked full-time provided the rest of the household income. Interviewees spoke of the financial disincentives to work longer hours, given the higher childcare costs.
b) Disadvantaged location stayers
First job in new location
Interviewees who stayed within disadvantaged locations generally had different educational trajectories to those who moved from disadvantaged locations to affluent areas. Several in this group went straight into employment after leaving school or college between the ages of 16 and 18, while a couple progressed on to university.
Some said they were put off going to university either because their siblings had gone and had a poor experience or because they had started a course and themselves had a negative experience, causing them to drop out. Upon leaving full-time education, several noted they did not have a clear idea what line of work they wanted to pursue as a potential career and were considering several options.
In a similar way to interviewees who moved to a new location for work, this group spoke of the influence their own personal networks had on their career trajectories, and the direct assistance they received in helping them find employment. Most often this was via the interviewee’s immediate family networks. People recalled how they managed to secure a job in a parent’s workplace after leaving school, or had vacancies signposted to them by siblings who felt the role suited their skills and interests. Others mentioned the indirect influence family had on their plans for employment, pursuing roles in particular sectors such as construction because these types of jobs ran in the family and they were familiar with them.
In cases where family did not have such a big influence, interviewees spoke of being opportunistic and gaining employment in roles immediately available to them. For some, this involved converting part-time retail roles into full-time positions on leaving education. Others noted that the opening of large department stores created employment opportunities locally that they were able to take advantage of.
“I didn’t have a clue … what I wanted to do, so I just did whatever was thrown at me, whatever was available.” Female, 33, disadvantaged area
As well as retail, other sectors that individuals tried after leaving education included construction, hair and beauty, leisure, and road haulage and logistics. For many, these early experiences in employment were largely positive. Some interviewees noted they felt they earned good money for their age, which gave them a sense of accomplishment and self-worth.
“I remember feeling like I’d won a big bar of chocolate! I felt more important than my friends. They were all still at college and there I was with my job.” 33, Female, disadvantaged area
Interviewees also spoke of high levels of job satisfaction in these roles. In customer-facing positions, this arose from having opportunities to interact and develop a good rapport with members of the public. Other interviewees who took on roles in local leisure facilities noted how they had always enjoyed sports at school, so having the opportunity to lead lessons was an enjoyable experience.
Career development and current role
In terms of how individuals’ careers were likely to develop from the time of interview onwards, both individual and focus group interviewees noted how their decisions about which employment opportunities to take were increasingly shaped by family considerations as they got older.
These factors were more commonly mentioned by interviewees in disadvantaged locations than by those who had moved to affluent areas. Having a young family, with occasional support from extended family, was a primary reason for staying in a disadvantaged location, both on a practical and an emotional level.
Some spoke of seeking employment opportunities that provided adequate pay and entitlements so they could support, as well as spend time with, their family, or flexible working arrangements so they could accommodate childcare commitments. Several people who had been looking for the former decided to take on roles in the public sector, working for either local authorities or government agencies.
Individuals who had taken these positions spoke of some of the benefits. These included flexitime, a generous pension scheme and holiday allowances. Some also reported that the value of their pay had depreciated over time due to the 1% public sector pay cap. Interviewees working for local authorities faced precarious conditions, with some commenting that they were currently on fixed-term contracts or had had to secure a second job to supplement their income.
A few individual and focus group interviewees in these roles described their salary as “fine”, although several wanted more pay. Many felt, however, that increasing their salary would mean assuming more responsibilities at work, such as taking up a management position. This in turn, they felt, could exacerbate work-related stress and damage work-life balance. Many currently saw these factors as being at good levels and were happy in work that enabled them to prioritise young children and their wellbeing until they became older and more self-sufficient.
“I feel the job I’m in just now just suits circumstances, in the sense that I’ve got a good work-life balance …. Could I probably strive to do better? I could, but I wouldn’t. I would then end up with the stress and the problem of taking the work home with me, which I’m not willing to do at this stage in my life. I’ve done it for years … and I just think, this is more important to me just now because I think my wee one needs me. And that’s where my head’s at with that. But I think it will change. I can’t see me doing what I’m doing for long.” Focus group participant, 30-49, disadvantaged area
In the focus groups with interviewees in disadvantaged locations, the connectivity of these locations to major cities was a frequent theme, in relation to access to the employment opportunities they wanted and chances to progress.
Younger participants, aged 18 to 29, spoke of how they would be willing to move or commute to these cities to access jobs better suited to their career interests. Several people in the focus groups with individuals aged between 30 and 49 described how they were currently travelling to nearby locations for work opportunities. In some cases, however, this travel time was seen to negatively affect their work-life balance, resulting in long working days and limited time spent with family members.
4.8 Quality of life (beyond employment)
Overview
The qualitative research explored how the research sample’s perception of their quality of life beyond employment has changed over time, either since moving to an affluent area or remaining within – or returning to – a disadvantaged location. In discussing quality of life, participants were prompted to consider factors such as the cost of living, social connections, quality of local services and transport networks, and the ability to pursue their preferred leisure activities and hobbies.
a) Affluent area movers – changes in quality of life since moving
Cost of living
There was consensus among interviewees who had moved to London that the cost of housing had a negative impact on their quality of life. Some noted that they experienced a high cost of renting in the capital and could not see any possibility of purchasing a property. Some observed how this contrasted with the circumstances of their friends living in areas of the country where property is cheaper, which had enabled them to get on the housing ladder.
Their experience contrasted with that of interviewees living within other UK capitals. For many who had moved from other parts of England to Cardiff, for example, living costs were significantly cheaper in comparison. People noted how much cheaper it was to rent and buy property compared with England. Interviewees also felt their overall quality of life had improved since moving to Cardiff, as they did not feel under as much financial pressure and had more disposable income. They also noted the cheaper cost of engaging in leisure activities, such as the cinema.
Participants who had moved to Cardiff from other parts of Wales, or who had been living in the city for a longer period, held less positive views. They noted that the cost of rent in the private sector in central Cardiff had risen substantially since they had moved there, and that wages had not kept up with these price rises. Interviewees generally agreed there was a lack of affordable accommodation in Cardiff and disapproved of new building works in the city. This sentiment concerned the proliferation of student accommodation, which interviewees considered to be taking up space without a direct benefit to the local community.
These findings suggest that views on the cost of living are strongly related to where individuals have previously lived, as well as how long they have stayed within one location. These past experiences provided a reference point for individual assessments of the affordability of a particular area, and whether the current cost of living was acceptable.
Social networks
Some participants felt their quality of life had been significantly affected by changes in their social networks since moving. They felt their quality of life had worsened due to a loss or lack of social networks after they had relocated. While many interviewees knew a few individuals in the city they were moving to, some who had moved away from their hometown described how the distance this put between themselves and their immediate family and friends made them feel lonely, isolated and unsupported. However, some who moved to affluent areas reported that these negative feelings were negated by the sense of inclusivity and community they felt in their new area.
In similar fashion to those living in London, some interviewees who moved to other major cities noted how the multicultural nature of their new area enabled them to form new social ties with individuals of the same faith and identity, which they had found difficult in their previous area of residence. Others noted the importance of making an effort to form new social ties after moving, to reduce any feelings of isolation – for instance, by attending local sports or recreational activities.
Access to public services: healthcare
Interviewees had mixed experiences of access to public services, such as healthcare. Multiple interviewees made comparisons with their previous place of residence to highlight their changing experiences.
Those who had moved to affluent areas from similarly large cities noted either little change or a worsening in their access to healthcare services as a result of their move. However, some interviewees who had moved from towns or cities with smaller population centres were more likely to rate the availability of healthcare provision positively compared with their previous residence.
‘In [my hometown] it’s really hard. You’re on waiting lists even when you’re on an urgent referral … you can be waiting months … and they kick you off as soon as possible … Cardiff’s really quick. I can get seen in 24 hours … and I can refer myself.” Female, 36, affluent area (from disadvantaged area)
Access to public services: education
Interviewees offered dual experiences of education in areas they had moved to. Some felt local schools were excellent and offered their children great opportunities, such as developing a broader cultural awareness. For some families, quality of schools was the main reason for moving. On the other hand, some interviewees living in major cities such as Cardiff and London noted the oversubscribed nature of the schools in their area and contrasted this with the situation in their previous places of residence.
Public transport
Overall, participants were very satisfied with the quality of transport links and service levels since moving. Those living in Cardiff had greater opportunity to walk around the city, and Londoners were more likely to use buses and trains. However, one participant considered the cost of transport in London to be high, which was noticeable since her move.
Social activities and hobbies
Interviewees across all affluent areas enjoyed varying social activities and hobbies, mostly referring to increased opportunities to engage in such pursuits since moving. Those living in Cardiff and Edinburgh noted that while other cities might offer a similar range of activities, these came with additional stress which they felt their cities did not have.
“I think it’s just an amazing place to be, without any of the stress of the really big London, New York, those kinds of cities, yes.” Focus group participant, 30-49, affluent area
b) Disadvantaged location stayers: changes in quality of life over time
Cost of living
Some interviewees in disadvantaged locations reported that they felt they had now achieved an adequate level of financial security and had no concerns about the cost of living in their area.
They felt this was a product of hard work in their careers, and the ability to travel to employment outside of their immediate area. They considered that this made a greater range of opportunities available to them, while they retained access to more affordable housing. As a result, interviewees could afford to go on holidays and engage in cultural and recreational activities in the local and wider surrounding areas.
“[In terms of] quality of life, me and my wife do quite well in work. We’re both on reasonable wage levels and have a reasonable amount of disposable income. We like to eat well and drink well.” Male, 32, disadvantaged area
Interviewees in disadvantaged locations who had more recently started a family spoke of the intense financial pressure and insecurity accompanying their change in circumstances. Focus group interviewees in several disadvantaged areas in the 30-49 age group recognised that having children had put greater pressures on their finances and their ability to save, but felt that this would be the case wherever they lived.
Social networks
As noted previously, interviewees in disadvantaged locations generally had a strong, localised social network. This tended to comprise immediate family members, whom they relied upon for practical and emotional support. These close bonds, and the wider feelings of connectedness to the local community that they supported, contributed to a positive outlook on their social life in the area.
Access to public services: healthcare
There was a consensus among all interviewees in disadvantaged locations regarding the noticeable increase in demand for and pressure on NHS services in primary and secondary care over time.
In some disadvantaged areas, participants attributed this to increases in the size of the local population. Some felt they had to avoid hospitals due to long waiting times or complained about the difficulty of securing a GP appointment. A few stated that they tended to approach medical professionals in their family for initial advice when they had concerns about their health.
Access to public services: education
Interviewees in disadvantaged areas had different experiences regarding schooling and childcare services. Some felt these services were overburdened in their area, while others felt the quality of schools available was adequate. This was generally related to whether or not the disadvantaged location was located near a high-population centre.
Interviewees in rural towns felt the availability of childcare services had diminished over time since they had started a family, and that there was now limited provision for individuals on low wages. Another participant in a similar location experienced difficulty after they had moved within their area, as one of their sons was no longer able to attend the school their brother attended due to catchment area terms, which increased their travel time and affected their quality of life.
“It was really, really hard. I had to do two different school runs at two different times. It was a nightmare, but the council wouldn’t do anything to help.” Female, 33, disadvantaged area
Other interviewees, specifically those living closer to large cities, felt more positive about the quality of schools in their area.
Public transport
As with educational services, those living in rural towns within the research sample described a deterioration in the availability of public transport in their area. They saw this as having a detrimental impact on the local community. A few people in disadvantaged locations described how some housing estates in their area were now cut off from local bus routes, leaving some communities more isolated. Some had close family members living in these estates and described the feelings of social isolation this lack of connectivity could produce.
However, some living in disadvantaged locations felt the lack of leisure or cultural activities was alleviated by frequent transport links to neighbouring, larger cities. Interviewees across the south of England noted that they would not consider moving for improved access to leisure or culture, as they enjoyed fast and reliable transport links to locations such as London and Brighton.
Social activities and hobbies
Many interviewees in disadvantaged areas discussed social activities and hobbies in relation to cost. While several positively rated the availability of leisure and recreational activities for young families in their area, many noted the expense associated with these activities and the consequent need for careful financial planning.
“We have a lot of local parks that I use quite regularly. I take them to Toddler Books … run by the church … which is cheap as well. There’s also a soft play, but it’s £17 to go there all together, which is a lot of money, so they don’t do that too regularly.” Female, 33, disadvantaged area
Other interviewees described how they plan smaller, cheaper family activities throughout the year, rather than holidays, as a means to manage their finances.
“It would be nice to be able to do more, but we do not have enough for foreign travel. It’s not a luxury lifestyle, but it’s ok.” Female, 39, disadvantaged area
Themes around childcare responsibilities, coupled with work responsibilities and planning family activities, emerged as particularly important for women interviewees. Several pointed to a lack of time for them to pursue their own social activities and hobbies due to childcare responsibilities and employment commitments.
5. Internal migration flows
5.1 Overview
People migrate for many reasons. As our qualitative research showed, internal migration in the UK often occurs for study or work. This is because employment and education opportunities are not equally distributed across every area of the country.
Even if opportunities do exist in an area, the quality of provision may be lower than that available elsewhere. These differences, along with those in other amenities, can drive individuals to move for a better quality of life. But do such moves lead to better outcomes for those who migrate? And of the people who move to areas offering better opportunities, how many come from the most deprived areas, compared with more affluent ones?
In our research, we investigate whether people who have migrated – defined as those living as adults in a different area to the one where they grew up – have better employment outcomes compared with people who did not migrate. We also explore whether migration from deprived areas is higher or lower than migration from more advantaged ones. In addition, we consider the types of areas people are most likely to leave and the characteristics of those moving from, or into, deprived areas.
To understand internal migration flows, taking into account area characteristics, we examine 3 different ways of classifying local authorities in Great Britain:
- the hot/cold spot classification constructed by the Social Mobility Commission (SMC)
- the level of deprivation
- ONS typologies
We first look at moves within England by deprivation level for the years 2011 to 2018, using the 2009 index of multiple deprivation. Next, we consider moves to or from hot/cold spots in England for the years 2017 to 2018, since the social mobility index was created in 2017. Finally, we analyse ONS typologies for England and Wales for the years 2011 to 2018, using the 2011 residential-based area classifications.
5.2 Internal migration flows by level of deprivation
We review how likely individuals were to leave more deprived areas and, if they did, whether they tended to choose more prosperous areas. We also explore the most common destinations for movers, based on level of deprivation within the local authority.
Figure 1 shows the deprivation quintile of each local authority in England. The least deprived areas are clustered in the south-east of England, while the most deprived areas are mainly found in Britain’s industrial heartlands and London, with some isolated instances in coastal areas. Otherwise, as we move further away from the south-east, the degree of deprivation tends to increase.
Figure 1: Local authorities classified by quintile of deprivation
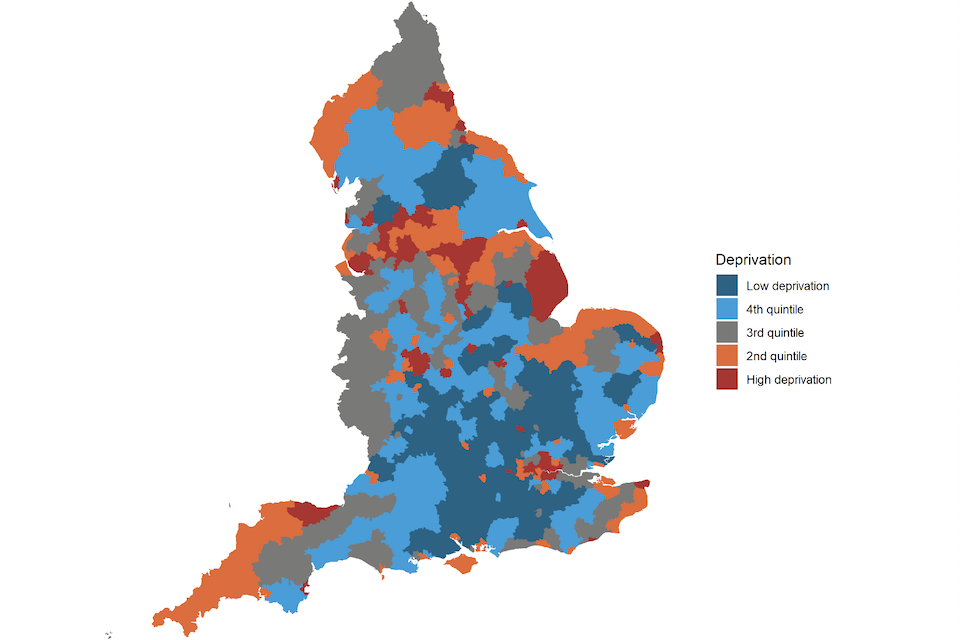
Source: Ministry of Housing, Communities and Local Government, England, 2009
Figure 2 shows migration outflows by sending and receiving area type. The highest migration outflows are from areas at the extreme ends of the deprivation index – those with the highest or lowest deprivation levels. In terms of direction, the biggest outflows from areas with the highest levels of deprivation are to other highly deprived areas. The migration flow from the most deprived areas to other equally deprived areas is 4 times higher than it is to low-deprivation areas. For areas with the lowest levels of deprivation, the least common destinations are those with the highest level of deprivation, while most outflows are to places with the lowest level. This indicates that internal migration tends to happen between areas with similar deprivation levels, especially within the most and least deprived areas.
Figure 2: Migration outflows by area of origin
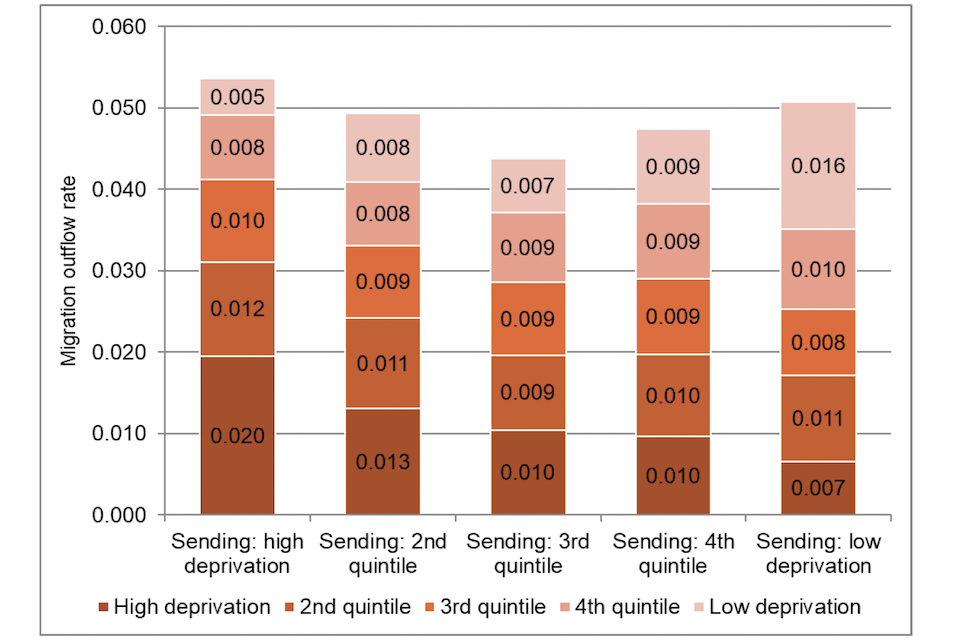
Source: ONS Internal Migration Rates, England, 2011 to 2018
Internal migration outflows by sending area type
The highest rate of out-migration is from areas with the highest and lowest deprivation levels (Table 1).[footnote 35] This changes after controlling for geographical proximity (whether 2 local authorities share a border and the distance between them). Areas with the highest levels of deprivation experience the lowest rates of out-migration among all quintiles. This means that geographical proximity explains some of the relatively high rate of outflow from high deprivation areas.
Differences in migration outflows appear to be also affected by differences between sending and receiving areas in housing costs and economic opportunities, and by the demographic characteristics of the sending areas.
Table 1: Internal migration flow rates
| Model 1 | Model 2 | Model 3 | Model 4 | |
|---|---|---|---|---|
| 2nd quintile | −0.149*** (0.019) | 0.161*** (0.007) | 0.371*** (0.008) | 0.073*** (0.007) |
| 3rd quintile | −0.116*** (0.019) | 0.042*** (0.007) | 0.009 (0.008) | −0.055*** (0.008) |
| 4th quintile | −0.088*** (0.019) | 0.103*** (0.007) | 0.249*** (0.009) | 0.005 (0.009) |
| Low deprivation | −0.000 (0.018) | 0.104*** (0.007) | 0.249*** (0.009) | 0.027*** (0.009) |
| Distance and border | NO | YES | YES | YES |
| Demographic structure of sending | NO | NO | YES | YES |
| Economic conditions of sending and receiving | NO | NO | NO | YES |
| Observations | 470,652 | 470,652 | 470,652 | 470,652 |
Source: ONS Internal Migration Rates, England and Wales, 2011 to 2018. Notes: reference group: Very High Deprivation. Robust standard errors in parentheses, *** p<0.01, ** p<0.05, * p<0.1
Internal migration flows by receiving area
We look next at the patterns of internal migration by the level of deprivation of the receiving areas. We find that outflows are mainly towards areas with similar or higher levels of deprivation to those of the area that movers are leaving.[footnote 36]
Migration outflows from the most deprived areas are towards other highly deprived areas. Even after controlling for geographical proximity, this pattern remains the same. Migrations from areas with the lowest levels of deprivation are most commonly to other areas with lower levels of deprivation. Some of the main factors affecting moves are differences in housing costs and prospective earnings – irrespective of the level of deprivation of the sending area.
5.3 Internal migration flows between hot and cold spots
We used the hot/cold spot indicator to investigate internal migration flows within England. Approximately 20% of local authorities are classified as hot spots and 20% as cold spots. The 60% of local authorities between the 2 extremes are here referred to as ‘medium spots’.
Figure 3 shows the hot and cold spots in England. It is clear that both hot and cold spots – but especially hot spots – are geographically clustered. Hot spot locations are areas of higher social mobility, while social mobility cold spots are areas with fewer opportunities in education and employment. We look at the internal migration flows between hot and cold spot typologies, to gain an insight into whether people migrate to higher opportunity areas.
Figure 3: Hot/cold spots in England by local authority
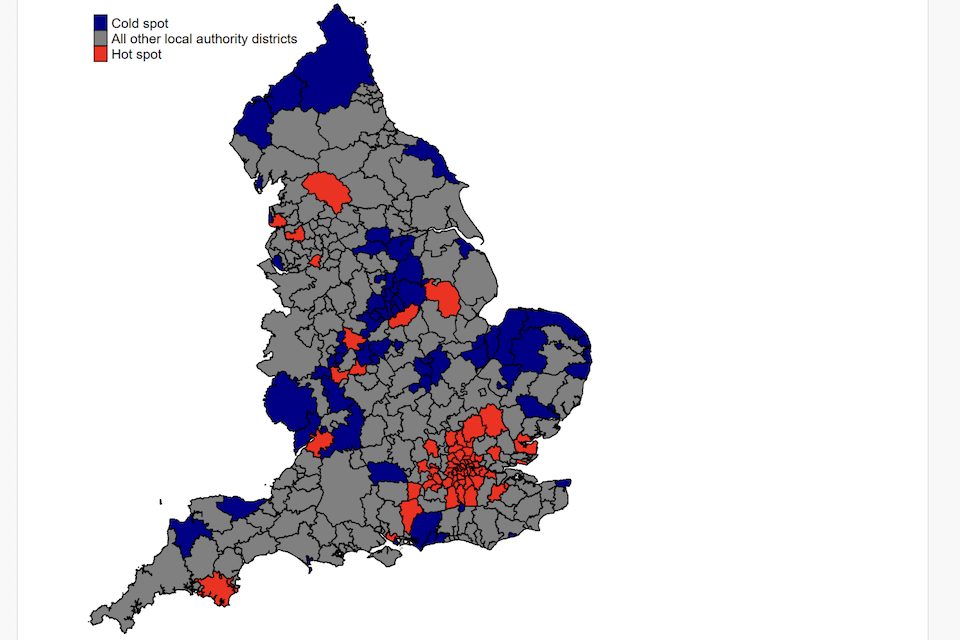
Source: Social Mobility Index, 2017
Figure 4 shows the internal migration rate flows between hot, cold and medium spots. The largest outflow rate is from hot spots, while outflow rates from cold spots and medium spots are of a similar magnitude. In terms of destinations, outflows from hot spots are mainly towards other hot spots and outflows from medium spots are towards other medium spots. This resembles the patterns of internal migration by level of deprivation, where the highest flows were between similar types of area. Outflows from cold spots do not follow the same pattern, as they are mainly towards medium spots rather than other cold spots. However, even though the highest flows from cold spots are to areas with relatively greater social mobility opportunities (medium spots), the lowest flows from cold spots are towards social mobility hot spots.
Figure 4: Internal migration rates between hot, medium and cold spots
| Hot/cold spot | Migration outflow rate |
| Hot-hot | 0.040 |
| Hot-medium | 0.030 |
| Hot-cold | 0.005 |
| Medium-hot | 0.009 |
| Medium-medium | 0.033 |
| Medium-cold | 0.008 |
| Cold-hot | 0.006 |
| Cold-medium | 0.027 |
| Cold-cold | 0.014 |
Source: ONS internal migration flows, England, 2017 to 2018
Internal migration flows by migrant characteristic and hot/cold spots
As people move through different phases of their lives, the reasons for migrating internally change. This leads both to fluctuations in average migration levels at different life stages and to differences in migration destinations. A young person might move to a university town to study, while an older person might move from a large city to a coastal area on retirement. To explore differences in migration choices over the life cycle, we broke down internal migration flows between hot, cold and medium spots by age (Figure 5).
The results show an increase in flows from all 3 types of area towards medium spots between the ages of 15 and 19 and between 20 and 24 – probably due to young people going away to study. Flows between hot spots start to increase after the age of 20 and peak for those in the 25 to 29 age bracket. They are more likely to be linked to career-driven migration choices.
Figure 5: Internal migration flows between types of areas by age group
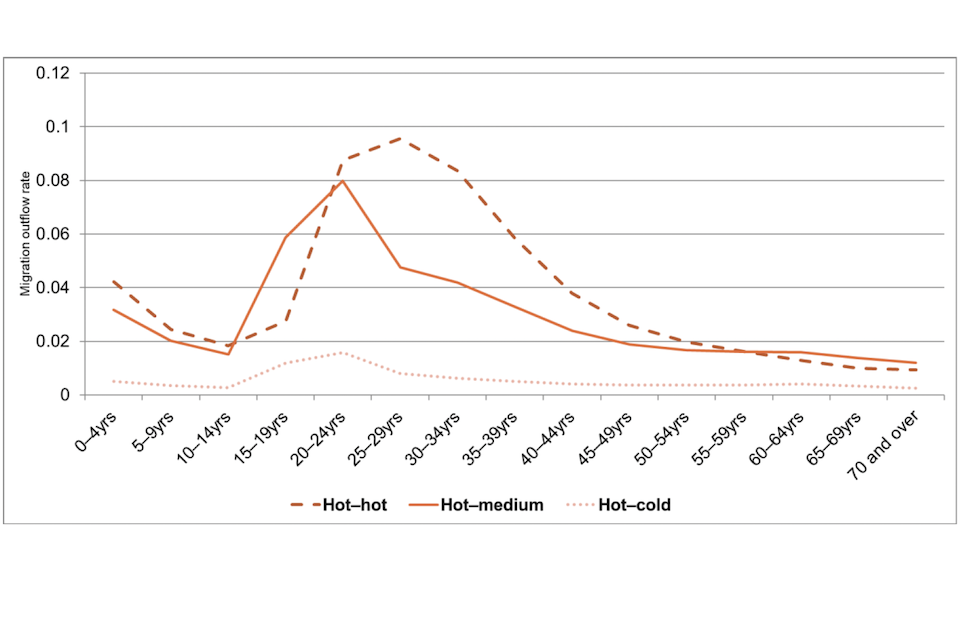
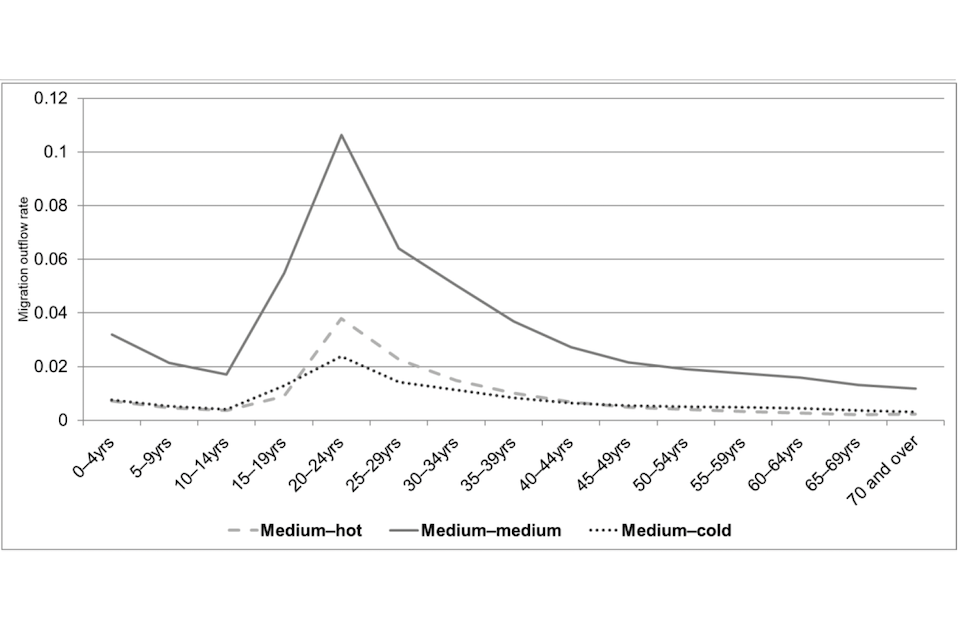
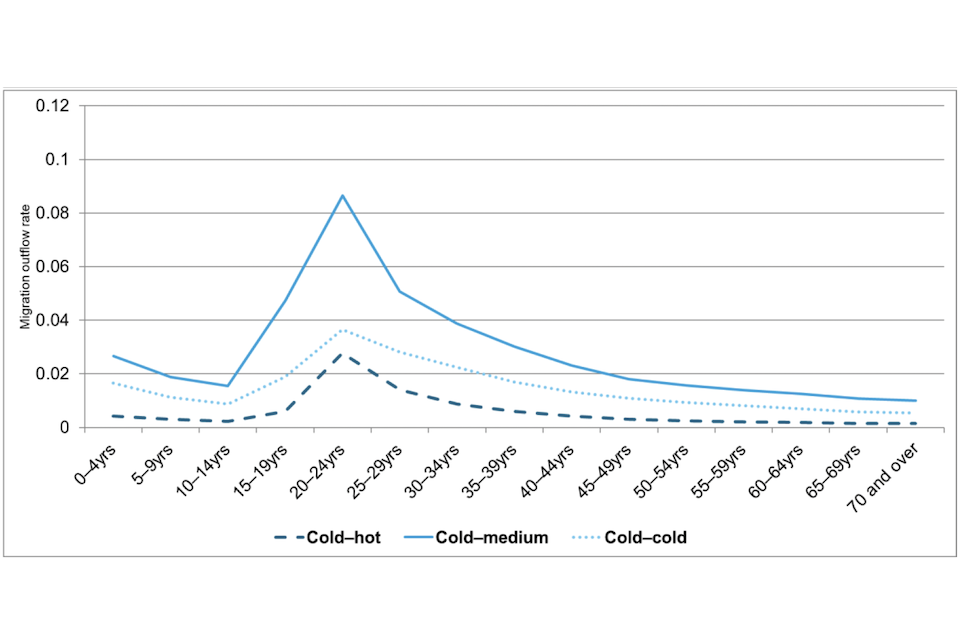
Source: ONS internal migration flows, England, 2017 to 2018
Women have higher internal migration rates than men. Figure 6 shows that the greatest difference between genders is for moves from hot spots to hot spots, where women’s migration rates are 16% higher than those of men.[footnote 37] Women’s outflow rates are greater than, or at least equal to, men’s outflow rates for any combination of sending and receiving area type.
Figure 6: Internal migration flows between hot, cold and medium spots by gender
| Hot/cold spot | Male migration outflow rate | Female migration outflow rate |
| Hot-hot | 0.037 | 0.043 |
| Hot-medium | 0.028 | 0.031 |
| Hot-cold | 0.005 | 0.006 |
| Medium-hot | 0.008 | 0.009 |
| Medium-medium | 0.032 | 0.034 |
| Medium-cold | 0.008 | 0.008 |
| Cold-hot | 0.005 | 0.006 |
| Cold-medium | 0.026 | 0.027 |
| Cold-cold | 0.014 | 0.014 |
Source: ONS internal migration flows, England, 2017 to 2018
Internal migration outflows by sending area type
Table 2 shows that people are more likely to leave hot spots than cold or medium spots.[footnote 38] Part of the difference in outflow rates between hot spots and medium spots is explained by geographical proximity. The demographic structure of the sending local authorities (age profile of the area, fertility rate and international migrants) is also found to be an important determinant of the migration flows. Finally, some of the most important factors explaining the differences between internal migration outflows from social mobility cold spots and hot spots are the relative strength of the local economy and housing costs in the sending and receiving areas.
Table 2: Migration outflow rates from hot/cold spots by area characteristics
| Model 1 | Model 2 | Model 3 | Model 4 | |
|---|---|---|---|---|
| Sending: medium spot | −0.332*** (0.029) | −0.028** (0.013) | 0.060*** (0.016) | 0.038** (0.016) |
| Sending: cold spot | −0.423*** (0.040) | −0.235*** (0.015) | −0.281*** (0.019) | −0.038** (0.019) |
| Distance and border | NO | YES | YES | YES |
| Demographic structure of sending | NO | NO | YES | YES |
| Economic conditions of sending and receiving | NO | NO | NO | YES |
| Observations | 94,863 | 94,863 | 94,863 | 94,863 |
Source: ONS internal migration flows, England 2017 to 2018. NOMIS 2016 to 2017 Notes: Robust standard errors in parentheses, *** p<0.01, ** p<0.05, * p<0.1
Internal migration flows by receiving area
We reviewed outflow rates towards hot/cold spots separately for each different type of sending area. These regressions can be found in the technical report (Tables 3-5). Internal migration flows are mainly between areas within the same category of hot, medium and cold spot – like going to like. Once we control for the geographic proximity of the sending and receiving areas, however, we see that all 3 groups have higher rates of out-migration towards medium spots.
5.4 Internal migration flows between ONS typologies
We investigate the internal migration flows by ONS typology. There are 8 ONS typologies:
-
Affluent England
-
Business, Education and Heritage Centres
-
Countryside Living
-
Ethnically Diverse Metropolitan Living
-
London Cosmopolitan
-
Services and Industrial Legacy
-
Town and Country Living
-
Urban Settlements
These area classifications were created using the 2011 Census and information on demographic, household, housing, socio-economic, and employment characteristics of local authorities. Similar areas are clustered together under one of the 8 categories.[footnote 39] All of these area types can be found in England, but Affluent England, Ethnically Diverse Metropolitan Living, and London Cosmopolitan areas cannot be found in Wales. For the internal migration flows between and within England and Wales, we consider all 8 types of area.
Figure 7 shows that ONS local authority area types are geographically clustered. ‘Ethnically Diverse Metropolitan Living’ areas are mainly found in London, while ‘Affluent England’ areas are mainly located in the south-east. Areas with significant historical involvement in coal mining and heavy manufacturing, such as south Wales and Sheffield, are classified as ‘Services and Industrial legacy’. The geographical periphery of Britain is generally classified as ‘Countryside Living’. Finally, a series of neighbouring local authorities belong in the ‘Town and Country Living’ typology. In the technical report (Table 6) we show a breakdown of area characteristics for each ONS area type.
Figure 7: ONS area types by local authority
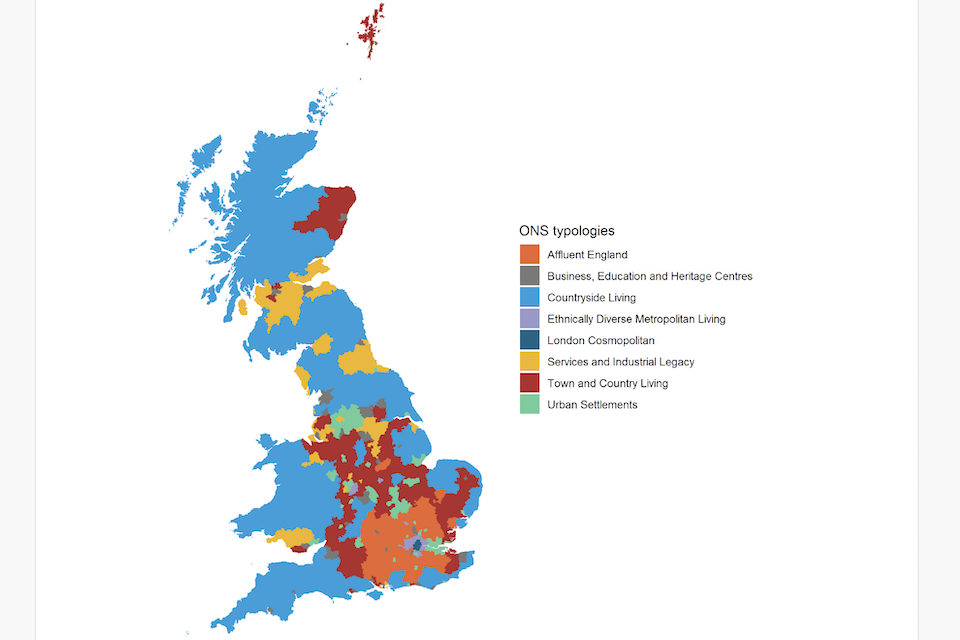
Source: ONS typologies, Great Britain, 2011
‘London Cosmopolitan’ areas have the highest migration outflow rate, while ‘Services and Industrial Legacy’ areas have the lowest out-migration rate (Figure 8). Relatively richer areas (as defined by gross value added per capita ), such as ‘Affluent England’ or ‘Business, Education and Heritage Centres’, experience higher outflows compared with relatively poorer areas classified under ‘Urban Settlements’ and ‘Countryside Living’. In the affluent area/cold spot breakdown, a similar pattern in migration outflows was apparent, with flows directed towards relatively richer areas.
Figure 8 shows that outflow rates from all areas are highest for those in their early 20s – likely reflecting moves for studying and work. ‘London Cosmopolitan’ and ‘Ethnically Diverse Metropolitan Living’ areas experience a second outflow spike for those in their early 30s, potentially capturing young professionals in London and its outskirts moving out to other areas.
Figure 8: Internal migration outflow rate by ONS typology and age group
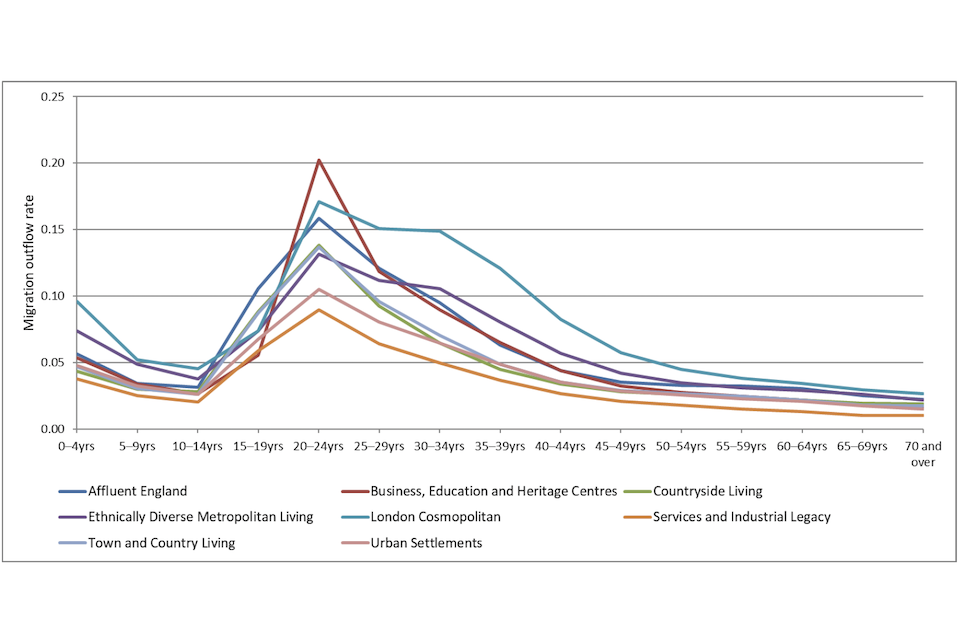
Source: ONS Internal migration rates, England and Wales, 2011 to 2018
Internal migration outflows by sending area type
This section reports a regression analysis we used to explore the main drivers of migration flows. The regression tables can be found in the technical report (Table 7). ‘London Cosmopolitan’, ‘Business, Education and Heritage Centres’, and ‘Ethnically Diverse Metropolitan Living’ areas have the highest outflows. Once geographical proximity is taken into account, ‘Business, Education and Heritage Centres’, ‘Countryside Living’ and ‘Affluent England’ areas have the highest outflows, possibly reflecting the fact that long-distance moves – for instance, leaving university to enter the labour market – are common from those typologies.
Nevertheless, the differences in outflows between areas remain, even when we control for the demographic structure of the sending areas and economic conditions of the sending and receiving areas, which indicates that there are other important factors beyond the main economic indicators explaining the differences in migration rates between areas. These factors could be related to differences in labour market or educational opportunities between areas, or to differences in the general quality of life.
Internal migration flows by receiving area
Finally, we investigated the likelihood of people moving to each of the different types of area from each type of sending area.
With few exceptions, and after controlling for geographical proximity, migration outflows from all 8 sending typologies are more likely to be directed towards:
- Business, Education and Heritage Centres
-
London Cosmopolitan
- Countryside Living
- Ethnically Diverse Metropolitan Living
The demographic controls explain little variation in the models. However, economic differences between areas are more relevant in explaining moves, with economic opportunities and housing costs being important drivers of differences in flows between areas. All results are reported in the technical report (Tables 8-15).
6. Differences in employment outcomes for movers and stayers
6.1 Overview
In this section, we compare the employment outcomes of movers and stayers using the British Household Panel Survey and Understanding Society data.[footnote 40] The employment outcomes we investigate are:
- the probability of being employed
- the likelihood of working in a higher managerial or professional occupation
- gross monthly income
6.2 Characteristics of movers and stayers
Over four-fifths (83.9%) of individuals in the sample for analysis were in employment, while almost half (46.1%) were in higher managerial or professional occupations. The average gross monthly labour income in real terms was £1,947 a month (Table 3).
Table 3: Employment outcomes
| Mean | Std. Dev. | Obs. | |
|---|---|---|---|
| Employed (%) | 83.9 | 36.8 | 2,816 |
| Higher managerial, administrative and professional occupations (%) | 46.1 | 49.9 | 2,275 |
| Real monthly labour income, in £ | 1,947 | 1,270 | 2,282 |
| Mover (%) | 33.0 | 47.0 | 2,842 |
Source: British Household Panel Survey and Understanding Society, 2000 to 2019. Notes: Real labour income is adjusted using Consumer Price Index (CPI) and excludes those who did not work in the month before the survey
Figure 9 shows that around one in 3 (33%) of individuals lived in a different local authority to the one where they grew up. There were some notable differences between movers and stayers in individual characteristics and employment outcomes (Figure 9). Almost half (49.3%) of stayers were male, compared with 44.9% of movers. Nearly three-fifths (56.0%) of movers had a degree, compared with 35.8% of stayers. This is unsurprising, as studying for a degree is one of the main drivers of internal migration.
The proportion of degree-holding movers was almost exactly the same (56.4%) as that of movers with a parent from a higher managerial or professional occupation, while just under 2 in 5 (39.4%) stayers were from a similar socio-economic background. This can partly be explained by parents with a higher socio-economic status being more likely to encourage their children to participate in higher education, which is linked to higher migration. It may also be due to their greater financial ability to support their children in relocating for job opportunities.
Almost two-thirds (63.9%) of stayers owned their own house or were in the process of buying it with a mortgage, while the proportion of movers owning their own home was 9 percentage points lower, at 55%. This could be because almost half the movers in our sample lived in London and the south-east, where house prices are high compared with other regions.
Figure 9: Characteristics of movers and stayers
| Characteristic | Stayer | Mover |
| Male | 49.3 | 44.9 |
| Has a degree | 35.8 | 56.0 |
| Age | 29 | 30 |
| White | 85.3 | 93.2 |
| Married | 22.4 | 34.7 |
| Has children | 32.9 | 35.8 |
| Parent: routine and manual occupations | 37.4 | 21.5 |
| Parent: intermediate occupations | 23.2 | 22.1 |
| Parent: higher managerial occupations | 39.4 | 56.4 |
Source: British Household Panel Survey and Understanding Society, 2000 to 2019
Employment outcomes also varied between movers and stayers (Figure 10). Almost three-fifths of movers (59.1%) were employed in a higher managerial or professional occupation, while fewer than 2 in 5 stayers (39%) belonged to that socio-economic group.
Unemployment was higher among stayers than movers, while employment was higher for movers than stayers. Finally, the average gross real monthly earnings figure for movers was £2,327, while the equivalent for stayers was £1,739.
Figure 10: Employment outcomes by migrant status

Source: British Household Panel Survey and Understanding Society, 2000 to 2019
The employment outcomes suggest that movers are in an advantageous position compared with stayers. The higher level of education and socio-economic background for movers could potentially be driving the differences in their employment outcomes. In that case, internal migration would have little to do with the fact that movers experience more positive employment outcomes than stayers.
However, when looking at the 2 groups by socio-economic background, movers still outperform stayers. Table 4 shows that nearly half (47.1%) of movers from a routine and manual socio-economic background are employed in higher managerial or professional occupations, compared with 30.2% of stayers from a similar background. The differences in socio-economic status between movers and stayers is also striking for individuals from a higher managerial or professional background. Nearly two-thirds (66%) of movers from that group end up in higher managerial or professional occupations themselves, while less than half (48.8%) of stayers in that group obtain a higher managerial job.
Table 4: Percentage of movers and stayers from a particular socio-economic background within each socio-economic group as an adult
| Socio-economic background | Routine and manual occ. (%) | Intermediate occ. (%) | Higher managerial occ. (%) | |
|---|---|---|---|---|
| Stayer | Parent: routine/manual occ. (%) | 50.5 | 19.3 | 30.2 |
| Stayer | Parent: intermediate occ. (%) | 31.5 | 29.9 | 38.6 |
| Stayer | Parent: higher managerial occ. (%) | 28.9 | 22.4 | 48.8 |
| Mover | Parent: routine/manual occ. (%) | 33.8 | 19.1 | 47.1 |
| Mover | Parent: intermediate occ. (%) | 23.8 | 26.2 | 50.0 |
| Mover | Parent: higher/managerial occ. (%) | 16.1 | 17.5 | 66.4 |
Source: British Household Panel Survey and Understanding Society, 2000 to 2019
Similarly, only 28.1% of stayers without a degree are employed in higher managerial occupations, while 42.3% of movers without a degree have higher managerial jobs (Table 5).
Table 5: Percentage of movers and stayers with and without a degree within each socio-economic group
| Degree attainment | Routine and manual occ. (%) | Intermediate occ. (%) | Higher managerial occ. (%) | |
|---|---|---|---|---|
| Stayer | No degree (%) | 49.1 | 22.8 | 28.1 |
| Stayer | Degree (%) | 20.4 | 22.2 | 57.3 |
| Mover | No degree (%) | 36.2 | 21.5 | 42.3 |
| Mover | Degree (%) | 11.2 | 17.1 | 71.7 |
Source: British Household Panel Survey and Understanding Society, 2000 to 2019
6.3 Differences in employment outcomes between movers and stayers
Table 6, Table 7 and Table 8 show:
- the differences in the probability of employment
- the probability of being employed in higher managerial, administrative and professional occupations
- differences in earnings between movers and stayers
Even after differences in the local labour market are taken into account, and when controlling for differences in individual characteristics, movers still outperform stayers. Movers are 5.8 percentage points more likely to be employed than stayers (Table 6). They earn on average £267.20 more per month (Table 7) and are 9.4 percentage points more likely to be employed in a higher managerial, administrative or professional occupation than stayers (Table 8).
Table 6: Probability of employment
| Model 1 | Model 2 | Model 3 | |
|---|---|---|---|
| Migrant (standard error) | 0.058*** (0.018) | 0.058*** (0.018) | 0.058*** (0.017) |
| Distance, year and region fixed effects | YES | YES | YES |
| Macroeconomic variables | NO | YES | YES |
| Demographic characteristics | NO | NO | YES |
| Observations | 2,269 | 2,269 | 2,269 |
Source: British Household Panel Survey and Understanding Society, 2000 to 2019. Notes: Standard errors in parenthesis, clustered at the local authority level, *** p<0.01, ** p<0.05, * p<0.1, marginal effects reported
Table 7: Real labour income (last month)
| Model 1 | Model 2 | Model 3 | |
|---|---|---|---|
| Migrant (standard error) | 363.9*** (86.4) | 362.4*** (86.1) | 267.2*** (79.5) |
| Distance, year and region fixed effects | YES | YES | YES |
| Macroeconomic variables | NO | YES | YES |
| Demographic characteristics | NO | NO | YES |
| Observations | 1,938 | 1,938 | 1,938 |
Source: British Household Panel Survey and Understanding Society, 2000 to 2019. Notes: Standard errors in parenthesis, clustered at the local authority level, *** p<0.01, ** p<0.05, * p<0.1
Table 8: Probability of being employed in higher managerial, administrative and professional occupations
| Model 1 | Model 2 | Model 3 | |
|---|---|---|---|
| Migrant (standard error) | 0.152*** (0.029) | 0.147*** (0.029) | 0.094*** (0.028) |
| Distance, year and region fixed effects | YES | YES | YES |
| Macroeconomic variables | NO | YES | YES |
| Demographic characteristics | NO | NO | YES |
| Observations | 1,881 | 1,881 | 1,881 |
Source: British Household Panel Survey and Understanding Society, 2000 to 2019. Notes: Standard errors in parenthesis, clustered at the local authority level, *** p<0.01, ** p<0.05, * p<0.1, marginal effects reported.
6.4 Are migrants more motivated – the mover mindset
We have shown that individuals who migrate differ from those who do not when it comes to some of their observable characteristics. Those characteristics, along with the opportunity to relocate, can explain in part the difference in labour market outcomes for movers compared with stayers. However, movers might differ from stayers with respect to other unobservable characteristics.
Motivation is another important, but unobservable, characteristic. Movers might be more motivated and career-oriented, which would have led to better employment outcomes regardless of where they lived. If there are unobservable differences between movers and stayers, which we do not take into account when exploring the link with labour market outcomes, we may mistakenly assume that stayers might experience similar outcomes if they were to move area. This could result in any positive effects of migration being overestimated.
To address this point, we used responses to questions on employment aspirations and attitudes towards the labour market when the respondent was a teenager to capture differences in motivation between individuals, as presented in the technical report.
In Table 9 and Table 10, we see there are some clear differences between movers and stayers in the aspirations and attitudes they expressed as teenagers. Almost a quarter (24.7%) of stayers said the most important reason for wanting a job was because it gave them money for essentials, while 15.6% of movers identified this as the main reason (Table 9). Job security was the most important aspect of a job for stayers, while only 13.0% of movers identified this as the most important factor (Table 10). However, movers were more likely to emphasise the importance of the actual work carried out in the job, compared with stayers (30.3% and 23.0% respectively). This suggests that stayers were more risk averse than movers as teenagers, and also that they appeared to have lower expectations that work would provide more than just an income to cover the essentials.[footnote 41]
Table 9: What is the most important reason for wanting a job?
| Stayer | Mover | Difference | |
|---|---|---|---|
| Essential foods (%) | 24.7 | 15.6 | 9.2*** |
| Money for extras (%) | 10.2 | 12.1 | −1.9 |
| Earn money for self (%) | 42.6 | 48.5 | −5.9 |
| Enjoy working (%) | 8.7 | 6.1 | 2.6 |
| Follow my career (%) | 11.0 | 15.2 | −4.2 |
Source: British Household Panel Survey and Understanding Society, 2000 to 2019. Notes: Categories with smaller response size than 2% are excluded, total number of observations is 623, *** p<0.01, ** p<0.05, * p<0.1
Table 10: What is the most important aspect of a job?
| Stayer | Mover | Difference | |
|---|---|---|---|
| Promotion prospects (%) | 8.2 | 9.1 | −0.9 |
| Total pay (%) | 23.7 | 24.2 | −0.5 |
| Good relationship with manager (%) | 16.1 | 10.4 | 5.7** |
| Job security (%) | 18.9 | 13.0 | 5.9* |
| Using initiative (%) | 5.6 | 7.4 | −1.7 |
| Actual work (%) | 23.0 | 30.3 | −7.3** |
Source: British Household Panel Survey and Understanding Society, 2000 to 2019. Notes: Categories with smaller response size than 2% are excluded, total number of observations is 623, *** p<0.01, ** p<0.05, * p<0.1
Given the small sample sizes, we focus on the outcome of being employed in a higher managerial or professional occupation, as the larger effect sizes on this particular outcome increase the likelihood of detecting any differences between movers and stayers.[footnote 42] For the remaining 2 employment outcomes, we cannot detect any statistically significant effects. Table 11 shows that, even after controlling for motivation, movers are still about 15 percentage points more likely to be employed in a job with higher socio-economic status than stayers.[footnote 43]
Table 11: Probability of being employed in a higher managerial or professional occupation (including motivation controls)
| Model 1 | Model 2 | Model 3 | Model 4 | |
|---|---|---|---|---|
| Migrant (standard errors) | 0.194*** (0.065) | 0.193*** (0.066) | 0.174*** (0.063) | 0.154** (0.062) |
| Distance, year and region fixed effects | YES | YES | YES | YES |
| Macroeconomic variables | NO | YES | YES | YES |
| Demographic characteristics | NO | NO | YES | YES |
| Motivation variables | NO | NO | NO | YES |
| Observations | 442 | 442 | 442 | 442 |
Source: British Household Panel Survey and Understanding Society, 2000 to 2019. Notes: Standard errors in parenthesis, clustered at the local authority level, *** p<0.01, ** p<0.05, * p<0.1, marginal effects reported.
7. Differences in employment outcomes for movers from, and stayers in, deprived areas
7.1 Overview
The potential gains of migration are greater for those leaving the most deprived areas, as these are particularly lacking in employment and education opportunities. In the sections that follow, we explore differences in the individual characteristics and employment outcomes of those who leave deprived areas and those who stay within them.[footnote 44] We found that more highly qualified individuals are more likely to leave a deprived area than those educated to a lower level.
Similarly, individuals from a higher social class background are more likely to leave deprived areas than those from a lower social class. In terms of employment outcomes, those who leave deprived areas are more likely to end up in the highest-level occupations than those who stay.
However, some groups of individuals have much better employment outcomes as movers than others. The difference in employment outcomes between those who leave and those who stay in deprived areas is greater for those without degrees than for degree holders. Similarly, the difference between movers and stayers in probability of being employed in a high-level occupation is higher for individuals with parents who were in skilled jobs than for individuals whose parents were in professional occupations.
7.2 Characteristics of movers and stayers
There are substantial differences between movers from and stayers in the most deprived regions when it comes to educational level and social class background. Over two-fifths of movers hold a degree, compared with less than one-fifth of stayers. In terms of social class background, nearly half of movers and a quarter of stayers had at least one parent in a professional and technical occupation. There are differences in the employment outcomes experienced by those who leave and those who stay in deprived areas: movers are more likely to be employed than stayers, while nearly three-fifths of movers are in a professional or technical occupation, compared with less than one-third of stayers.[footnote 45]
The differences in employment outcomes of those who leave and those who stay in the most deprived areas are likely to be influenced by differences in social class characteristics such as educational achievement or parental social class. However, when we look at the social class of movers and stayers based on their parental social class background, around one-fifth (21.2%) of stayers and two-fifths (40.3%) of movers whose parents were employed in a semi-skilled or unskilled occupation are employed in a professional or technical occupation (Table 12).
The difference between movers and stayers is even more substantial when we look at individuals whose parents were employed in a professional or technical occupation. For this group, less than half (46.9%) of stayers, compared with nearly three-quarters (70.1%) of movers, were employed in a professional or technical occupation in adulthood.
Table 12: Percentage of individuals in professional and technical occupations, skilled occupations and semi-skilled/unskilled occupations by parental occupation (stayers in and movers from the lowest quintile)
| Professional and technical (%) | Skilled (%) | Semi- skilled/unskilled (%) | ||
|---|---|---|---|---|
| Stayers in poorest quintile | Parent: professional and technical (%) | 46.9 | 39.6 | 13.6 |
| Stayers in poorest quintile | Parent: skilled (%) | 27.0 | 49.0 | 24.0 |
| Stayers in poorest quintile | Parent: semi-skilled/unskilled (%) | 21.2 | 46.0 | 32.8 |
| Movers out of poorest quintile | Parent: professional and technical (%) | 70.1 | 23.2 | 6.8 |
| Movers out of poorest quintile | Parent: skilled (%) | 49.8 | 35.5 | 14.7 |
| Movers out of poorest quintile | Parent: semi-skilled/unskilled (%) | 40.3 | 40.1 | 19.6 |
Source: ONS LS, 1971 to 2011
7.3 Differences in employment outcomes between movers and stayers
We used a regression analysis to understand better the differences in employment outcomes between those who leave and those who stay in the most deprived areas. This enabled us to explore differences in employment outcomes for movers and stayers, after controlling for a series of personal attributes and area-related effects.
Probability of employment
We looked at how the likelihood of being employed varies between movers from, and stayers in, the most deprived areas (Table 13). Movers are about 2 percentage points more likely to be employed than stayers. This difference seems to be driven by the demographic characteristics of the individuals. However, given the large sample size and the small statistical significance of the estimated coefficient, we cannot confidently claim there is clear evidence of differences in the employment outcomes of movers and stayers.
Table 13: Probability of employment for movers and stayers from the most deprived quintile
| Model 1 | Model 2 | Model 3 | |
|---|---|---|---|
| Internal migrant | 0.023* (0.014) | 0.023* (0.014) | −0.024* (0.013) |
| Year and region fixed effects | YES | YES | YES |
| Macroeconomic variables | NO | YES | YES |
| Demographic characteristics | NO | NO | YES |
| Observations | 31,610 | 31,610 | 31,610 |
Source: ONS LS, 1971 to 2011. Notes: Reported marginal effects, following probit regressions, standard errors in parentheses, *** p<0.01, ** p<0.05, * p<0.1
Probability of being employed in a professional or technical occupation
Table 14 shows the results of regressions examining the probability of being employed in a professional or technical occupation for movers from, and stayers in, the most deprived regions. Those who move are more likely to be employed in a professional or technical occupation than those who do not. How much more likely? Even when controlling for year effects, regional fixed effects, region-related macroeconomic variables and personal characteristics, movers are 10 percentage points more likely to be employed in the highest occupational class compared with stayers. This could be partly driven by unobservable positive self -selection among movers.
Unlike the BHPS-UKHLS data, there is no available proxy in this dataset for unobserved motivation.
Table 14: Probability of being employed in a professional or technical occupation for movers and stayers from the most deprived quintile
| Model 1 | Model 2 | Model 3 | |
|---|---|---|---|
| Internal migrant | 0.262*** (0.016) | 0.262*** (0.016) | 0.102*** (0.015) |
| Year and region fixed effects | YES | YES | YES |
| Macroeconomic variables | NO | YES | YES |
| Demographic characteristics | NO | NO | YES |
| Observations | 29,669 | 29,669 | 29,669 |
Source: ONS LS, 1971 to 2011. Notes: Reported marginal effects, following probit regressions, standard errors in parentheses, *** p<0.01, ** p<0.05, * p<0.1
7.4 Differences in employment outcomes by individual characteristics
To understand whether the employment outcomes of those leaving and staying in deprived areas are any different across the whole sample, regardless of background, we explore differences in employment outcomes by gender, ethnicity, education level and parental social class.
Outcome: probability of employment
Figure 11 shows the relative probability of employment between those leaving and staying in the most deprived areas, depending on individual characteristics. Women who move from the most deprived regions are 5.3 percentage points less likely to be employed than women who do not move. There are no statistically significant differences in the probability of employment between men who move and men who do not. White movers are less likely to be employed than white stayers (2.6 percentage points), while movers with a degree are less likely to be employed than stayers with a degree (3.2 percentage points). Movers from a professional and technical social class background are less likely to be employed than stayers from a similar background (3.9 percentage points).
Figure 11: Differences in probability of employment between movers from and stayers in the most deprived quintile
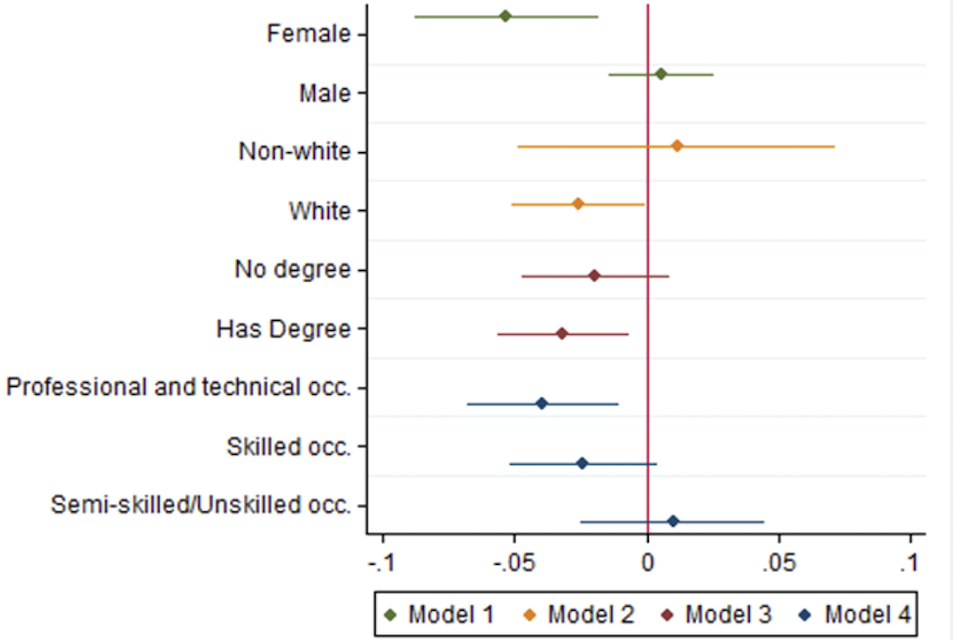
Source: ONS LS, 1971 to 2011. Notes: Separate regressions for each interaction, reported marginal effects, following probit regressions, standard errors in parentheses, *** p<0.01, ** p<0.05, * p<0.1
We looked at whether there were clear differences in the employment outcomes experienced by those who leave and those who stay in the most deprived areas depending on their individual characteristics. Table 15 shows that the difference in probability of employment between men who leave deprived areas and those who stay is greater than the difference between women who leave deprived areas and women who stay. Similarly, the difference in the probability of employment between those from a semi-skilled or unskilled occupational background who leave deprived areas and those who stay is greater than the difference in probability of employment between those from a professional and technical background who leave a deprived area and those who stay.
Table 15: Difference in the probability of employment between movers and stayers from the most deprived quintile by subgroup category
| Coefficient | (s.e.) | |
|---|---|---|
| Male versus female | 0.058*** | (0.013) |
| White versus non-white | −0.037 | (0.028) |
| Has degree versus no degree | −0.012 | (0.011) |
| Parent: skilled versus professional and technical occupation | 0.015 | (0.012) |
| Parent: semi-skilled/unskilled versus professional and technical | 0.049*** | (0.016) |
| Year and region fixed effects | YES | |
| Macroeconomic variables | YES | |
| Demographic characteristics | YES | |
| Observations | 31,610 |
Source: ONS LS, 1971 to 2011. Notes: Separate regressions for each contrast interaction, reported marginal effects following probit regression, standard errors in parentheses, *** p<0.01, ** p<0.05, * p<0.1
Outcome: Probability of being employed in a professional or technical occupation
Figure 12 shows the differences in the probability of being employed in a professional or technical occupation between those who leave and those who stay in deprived areas – separated by gender, ethnicity, education and social class background. Across all subgroups, movers are more likely to be employed in a professional or technical occupation than stayers. However, there are differences between subgroups in the probability of movers being employed in a professional or technical occupation.
Women who move to a less deprived area have an increased probability of being employed in a professional or technical occupation of 7.8 percentage points, compared with women who stay. Men who move are 14.3 percentage points more likely to be employed at the highest occupation levels, compared with men who stay in the most deprived regions. Individuals from skilled occupational backgrounds who migrate are 12.5 percentage points more likely to be employed in higher-level occupations than those who do not move. The equivalent percentage for individuals from a professional and technical occupational background is 9.1 percentage points.
Figure 12: Differences in the probability of being employed in a professional or technical occupation between movers and stayers from the most deprived quintile
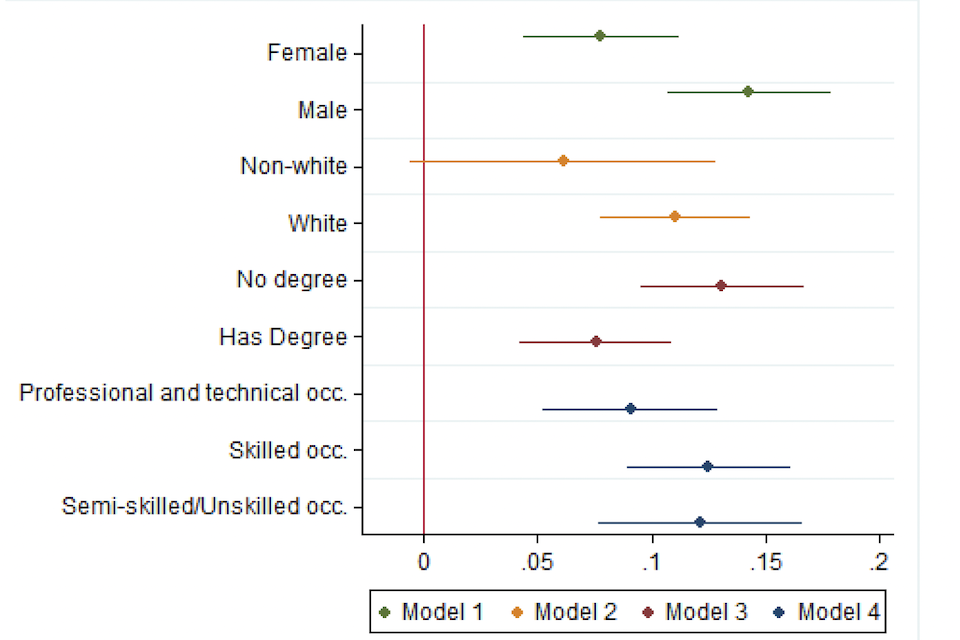
Source: ONS LS, 1971 to 2011. Notes: Separate regressions for each interaction, reported marginal effects, following probit regressions, standard errors in parentheses, *** p<0.01, ** p<0.05, * p<0.1
Table 16 examines whether the differences in the probability of being employed in the highest- level occupations for movers and stayers from each of the subgroups are statistically significant. This shows that the difference in employment in this social class between men who move and men who stay in the most deprived regions is 6.5 percentage points larger than the equivalent difference between women who move or stay.
The difference in employment in this social class between movers and stayers is 5.5 percentage points lower for degree holders compared with non-degree holders. Migration, therefore, is associated with a greater difference in probability of employment in professional and technical occupations between movers and stayers for non-degree holders than it is for degree holders.
Similarly, the difference in probability of employment in this social class for people from a skilled social class background is greater by 3.4 percentage points than the equivalent difference in probability for movers and stayers from a professional or technical occupational background.
Table 16: Differences in the probability of being employed in a professional or technical occupation between movers and stayers from the most deprived quintile by subgroup category
| coefficient | (s.e.) | |
|---|---|---|
| Male versus female | 0.065*** | (0.013) |
| White versus non-white | 0.049 | (0.031) |
| Has degree versus no degree | −0.055*** | (0.014) |
| Parent: skilled versus professional and technical | 0.034** | (0.015) |
| Parent: semi-skilled/unskilled versus professional and technical | 0.031 | (0.020) |
| Year and region fixed effects | YES | |
| Macroeconomic variables | YES | |
| Demographic characteristics | YES | |
| Observations | 29,669 |
Source: ONS LS, 1971 to 2011. Notes: Separate regressions for each contrast interaction, reported marginal effects, following probit regressions, robust standard errors in parentheses, *** p<0.01, ** p<0.05, * p<0.1.
8. Discussion
8.1 Overview
Internal migration flows predominantly take place between similar types of areas. This means that moves away from low deprivation areas are mainly to other areas of low deprivation, while moves from high deprivation areas are largely to other areas of high deprivation.
The demographic structure of sending areas is important in explaining the rate of outward migration, since young people and international migrants tend to be more mobile than other groups. The relative economic conditions and housing costs of the sending and receiving areas are also found to be important determinants of geographic mobility, because they explain part of the internal migration flows between different types of areas.
Our analysis showed that individuals with higher qualification levels or from higher socio-economic backgrounds were more likely to move areas than individuals with lower qualification levels or from lower socio-economic backgrounds. Furthermore, movers were more likely to be employed in higher-level socio-economic occupations than stayers, regardless of their socio-economic background. This can partly be explained by personal characteristics of individuals, as well as economic conditions in the area where they live. Unobserved motivation also seemed to be a significant factor in explaining some of the differences in the employment outcomes between movers and stayers.
Our analysis of outward migration from the most deprived regions indicates that movers are less likely to be employed than stayers, once individual characteristics are taken into consideration.
This finding is most pronounced for groups that are usually more likely to have better employment outcomes, such as degree holders, people from a white ethnic background and those from a more advantaged background. Nonetheless, movers are more likely to be employed in a professional or technical occupation than stayers. This finding holds across all the individual characteristics considered, including gender, ethnicity, education and social class background.
The difference between movers and stayers in probability of being employed in professional or technical occupations was greater for movers from traditionally less advantaged groups, such as those educated to below degree level. These findings could potentially be consistent with movers from disadvantaged backgrounds being more highly motivated than movers from more advantaged backgrounds. Unfortunately, we were unable to control for unobserved motivation in this part of the analysis.
Women who move from deprived areas are less likely to be employed than women who stay. In addition, the difference between female movers and stayers in the probability of being employed in a professional or technical occupation is smaller than the equivalent difference between male movers and stayers. This could in part be due to differences between men and women in the drivers of migration. Women may be more likely than men to move for family, rather than personal, reasons. There may also be greater differences in unobserved characteristics between men who move and those who stay compared with female movers and stayers.
Our qualitative research showed that interviewees who moved from deprived to affluent locations, and those who had remained within deprived areas, had differing priorities based on their early educational experiences and whether they had children at a young age. This partly informed their subsequent life experiences and could drive decisions about where they lived and what they were looking for from their local area in the short to medium term. However, these circumstances and differing priorities were not fixed. In some cases, interviewees living in affluent locations were beginning to consider family priorities after focusing on their career following their initial move.
Some of those living in deprived areas spoke of how they were looking at potential career moves and/or relocating once their children were older and their caring responsibilities were less intense. This shows that interviewees could have similar life experiences, although the sequencing and life stage at which they happened can vary based on their (re)location and priorities after immediately leaving full-time education.
Despite these temporary differences in terms of priorities and what interviewees considered important in their employment and quality of life, we also found that interviewees’ life experiences could share similarities across deprived and affluent locations. For instance, interviewees in deprived locations were not necessarily restricted in their access to suitable job opportunities, public services or leisure activities if they had good transport links to neighbouring large cities.
As regards employment, many interviewees working in the public and third sectors face challenges in terms of their working conditions and limited opportunities to increase their pay and gain promotion, regardless of their location. Similarly, their experiences in work are significantly affected by having children and the pressures this brings, either financially or in terms of having to provide childcare, regardless of where they live.
In considering what these findings mean for policy, it is challenging to make assertions about the desirability or otherwise of particular life trajectories at the individual level. Interviewees could have had positive experiences wherever they lived, and there are no clear advantages to living within one area over another, given that individuals could look for and value different things at different stages in their life. They also vary as to whether they are able to access the opportunities and services they want in neighbouring locations.
8.2 Policy suggestions
The last part of our research involved 3 stakeholder roundtable discussions where the draft findings of the research were discussed. Those discussions helped us to develop and shape our policy thoughts. The first roundtable took place in London and was attended by stakeholders from national government and charities and experts on social mobility. The other 2 roundtables took place in Leeds and Birmingham and the participants included representatives from local government, key staff from Local Enterprise Partnerships and local charities, and experts on social mobility.
In the following sections we discuss a series of policy suggestions that were developed during the stakeholder roundtables.
Increasing opportunities
A lack of high-quality local higher education can mean that, often, young people have no option but to move away to study, and in many cases they may never return. Also, a lack of study opportunities within an area may deter some young people from continuing into higher education at all. It is therefore important that those who do not wish to or cannot move to other locations have opportunities to study in their local area. It is important for universities and colleges to work together to ensure there is a coherent local offer for students of all ages and backgrounds. This might include increasing the range of distance learning and part-time courses available to young people who wish to study while working.
Most internal migration is for the purposes of either study or work. The quantitative analysis showed that the highest outflow rate is from hot spots and that those from more advantaged socio-economic backgrounds are more likely to move. Our qualitative research suggested that individuals from cold spots may be deterred from moving by the associated costs. Support with relocation costs, deposits for rented accommodation or transport season ticket loans could help reduce the financial barriers that those from more disadvantaged backgrounds face and ensure that there is greater equality of opportunity between those from different socio-economic backgrounds.
Addressing skills gaps
One prominent issue in more deprived areas was the need to address the mismatch between the skills requirements of local employers and access to appropriately qualified workers.
Roundtable participants identified 3 potential ways of overcoming this mismatch. Firstly, they noted that it was important for local authorities to be able to identify skills gaps and publicise these to young people and the labour force more generally. Secondly, local training providers, including colleges and universities, may need funding from central government to mitigate the risks of introducing new courses which are designed to meet local skills gaps, but where likely take-up is uncertain. Finally, a more proactive approach is required to identify people who are most in need of reskilling or upskilling, working in conjunction with local Jobcentres.
Strengthening the local economy
Access to good-quality educational provision in deprived areas will not result in improved opportunities for local people unless good-quality jobs are also available locally. The stakeholder roundtables highlighted 3 main themes related to the promotion of economic growth in more deprived localities:
- local investment and procurement
- agglomeration
- devolution
While local investment is a decisive factor for local development, there is no conclusive evidence on the positive effects of procurement on local economic growth.[footnote 46] However, the Preston model[footnote 47] offers some procurement interventions that could help support local small and medium-sized enterprises (SMEs) without necessarily favouring them over more affordable or higher-quality alternatives. For example, it may be possible to offer more guidance and support to local SMEs to increase their ability to tender for public commissions and compete on equal terms with larger providers. This might potentially enhance the contribution of public procurement to generating local jobs.
The best way to promote local, inclusive growth has been the subject of debate within the UK. One view is that there should be investment in major cities, with better connectivity and transport links with surrounding areas to allow individuals to benefit from a booming local economy. Another approach to stimulating local growth that has been identified in the past is to invest in a much larger number of towns. Given the lack of agreement on the most cost-effective way of promoting local economic growth, further research may be helpful in identifying the strategy most likely to allow more deprived areas to benefit from local investment.
In terms of devolution, Roundtable participants highlighted the need for greater local autonomy in decision-making, accompanied by increased funding. Participants noted that the austerity measures introduced in 2010 limited the resources available to local government to raise economic growth. Another topic that was discussed was the need to intensify the process of relocating government departments and public bodies to more deprived areas. This was thought to be an important source of better-quality jobs in those places, and a catalyst to stimulate local economic growth.
Improving the local infrastructure
Economic development has a bearing on quality of life. Investing in the infrastructure of deprived areas not only has the potential to improve access to product and labour markets and create job opportunities but may also make an important positive difference in people’s lives.
Furthermore, providing good local infrastructure may potentially help retain people in areas. The roundtables suggested that improvements to local infrastructure should focus on 3 main areas:
- good-quality, affordable housing
- transport connectivity
- fast and reliable internet
The need for long-term planning was also stressed.
In terms of good-quality, affordable housing, the need for accommodation that reflects the needs of the community was discussed. This means that it should be appropriate not only for young professionals but also for families.
In terms of connectivity, the need for better transport links within cities and between cities was discussed. Many less deprived areas have poorer neighbourhoods that are not well connected to affluent parts of local cities. Expensive and infrequent bus services mean that many people are unable to access job or study opportunities. There is also a need to improve the affordability and reliability of train services between neighbouring cities. Our qualitative research showed that there is considerable variation between areas in the experiences of commuting to work. In some places, respondents reported having access to a good train service which meant that they did not have to relocate, whereas in other areas respondents did not have this option, as travel costs were high and journey times too long to make commuting a viable strategy.
The need for access to a fast and reliable internet connection was also discussed. The introduction of fibre optics in all areas was seen as a move that could enhance the prospects for economic growth in isolated areas. This may also improve access to online training, as well as opening up opportunities for remote working in higher-skilled professions.
While the focus groups and interviews did not identify clear negative effects on those left behind of individuals leaving cold spots, the stakeholder roundtables did identify a ‘brain drain’ of people who move away for training or to participate in higher education. One of the main reasons for this ‘brain drain’ was thought to be a lack of high-skilled jobs in the local area. The roundtables linked this issue to local investment strategies. Additional efforts to increase housing quality and affordability and connectivity between places would reduce the factors that drive more highly skilled individuals to leave areas currently considered more deprived. Our qualitative research showed that, in many cases, people wanted to remain in these areas – however, the lack of opportunities and infrastructure had pushed them out.
Building community identity
Having strong connections to the local community either as an employer or as citizens is a very important aspect of quality of life. Our qualitative research showed that people in some cold spots, like Liverpool, had a strong sense of place identity. Building the sense of attachment to a locality is likely to contribute to the retention of people within the area, as it gives them a reason to stay which is not only motivated by pecuniary benefits. One example of this practice is ‘The Deal’ in Wigan,[footnote 48] where partnership working between local people, businesses and the council is promoted. Further research and evaluation of the effectiveness of schemes implemented by local authorities to increase community identity could help inform the evidence base on strategies which increase attachment to the local area.
Our qualitative research showed that, in many deprived areas, children had few opportunities to participate in activities which would be likely to build a strong sense of community identity. The idea of providing a cultural passport to important historical landmarks and museums, as was discussed in the Henley Review,[footnote 49] could be adapted to help build the local identity of young people. For example, the passport could be created in cooperation with local authorities and could include landmarks and activities related to local history. Funding for school trips to local cultural amenities for those from more deprived backgrounds would be necessary to ensure that all pupils were able to benefit from activities designed to build attachment to the local area.
Policy response during the COVID-19 pandemic
In order to minimise the effects of the lockdown on employment, the government has understandably intervened with policies to support employment. This response to the COVID-19 pandemic is likely to have a significant effect on government finances and on the national debt. This may reduce the fiscal headroom for targeted policies aimed at improving social mobility and the geographic distribution of opportunity over the short term. However, the medium-term response should be designed with social mobility in mind so that inequalities are not exacerbated further during this period.
8.3 Conclusion
There are vast geographical inequalities in opportunity and prosperity in Great Britain.
Individuals who move to London and the south-east of England have better employment outcomes compared with people who remain in more disadvantaged areas, especially in terms of pay and occupational class. Moving from a disadvantaged area to a more affluent one is likely to benefit the individual in terms of their career, but it is less clear that it is always as good for their ability to exercise meaningful choice about the shape of their life.
This is because moving can impose some financial and even higher personal costs. Leaving a social network behind to relocate to a new area is challenging. The initial moving costs, together with economic uncertainty, make such relocations more difficult for people from less affluent backgrounds. Individuals from advantaged backgrounds are less likely to be constrained by financial barriers to moving. This means that they are more likely to be able to pursue opportunities to study and work elsewhere, both critical factors for professional success.
Therefore, it is individuals from more advantaged backgrounds, who already have good prospects, who are most likely to be able to take advantage of the opportunities that migration presents.
Despite the benefits of migration once any barriers are overcome, there are many positive reasons for staying in an area that might otherwise be considered financially less advantaged. Quality of life, personal connections and low living costs are only some of the reasons why a person might choose to remain in the area where they grew up. Migration should not be the only way to ‘move on’, regardless of where a person chooses to live.
A better geographical distribution of economic opportunity could lead to overall societal benefits. Providing opportunities for individuals across the country would allow some who would have otherwise migrated to avoid the trade-off that migration entails. At the same time, it would also benefit those who would not consider moving. All places should have the social and economic infrastructure:
-
to attract people who formerly lived in the area to return with the benefit of their knowledge and experience
-
to attract new people to the area to settle, work and study
In addition, equality of opportunity should be enhanced in all areas. This can be achieved by building the educational credentials and skills of people so that they have the social and cultural capital to make confident choices about where they want to live, work, and study.
It can also be achieved by making sure that a financial support system is in place so that they have a genuine choice of where they live, regardless of their background. Overall policy in this area needs to strike a balance between supporting the individual and supporting more deprived areas in order to foster a healthy, diverse society.
9. About the Commission
The Social Mobility Commission is an independent advisory non-departmental public body established under the Life Chances Act 2010 as modified by the Welfare Reform and Work Act 2016. It has a duty to assess progress in improving social mobility in the UK and to promote social mobility in England.
The Commission board comprises:
- Sandra Wallace, Interim Co-Chair, Joint Managing Director Europe at DLA Piper
- Steven Cooper, Interim Co-Chair, Chief Executive Officer, C. Hoare & Co
- Alastair da Costa, Chair of Capital City College Group
- Farrah Storr, Editor-in-chief, Elle
- Harvey Matthewson, Aviation Activity Officer at Aerobility and Volunteer
- Jessica Oghenegweke, Presenter, BBC Earth Kids
- Jody Walker, Senior Vice President at TJX Europe (TK Maxx and Home Sense in the UK)
- Liz Williams, Chief Executive Officer of Futuredotnow
- Pippa Dunn, Founder of Broody, helping entrepreneurs and start-ups
- Saeed Atcha, Chief Executive Officer of Youth Leads UK
- Sam Friedman, Associate Professor in Sociology at London School of Economics
- Sammy Wright, Vice Principal of Southmoor Academy, Sunderland
9.1 About the Institute for Employment Studies
The Institute for Employment Studies (IES) is an independent, apolitical, international centre of research and consultancy in public employment policy and HR management. It works closely with employers in all sectors, government departments, agencies, professional bodies and associations. IES is a focus of knowledge and practical experience in employment and training policy, the operation of labour markets, and HR planning and development. IES is a not-for-profit organisation.
9.2 Authors
Dafni Papoutsaki, Jonathan Buzzeo, Helen Gray, Matthew Williams, James Cockett, Georgie Akehurst, Kate Alexander, Becci Newton, Emma Pollard
9.3 Acknowledgements
The authors are indebted to Ali Jaffer at the Social Mobility Commission for his support and strategic guidance in producing this report. We are sincerely grateful for the feedback on the early draft received from Professor Jackie Wahba, University of Southampton, and for the feedback, support and guidance offered by the members of the Technical Panel at the Social Mobility Commission. We would like to thank Professor Anne Green, University of Birmingham, for chairing one of the stakeholder roundtable discussions. We express our thanks to the other members of the research team, Tony Wilson, Jessica Bell, Clare Huxley, Alex Martin, Rosa Marvell, Rakhee Patel, Julie Vanderleyden and Bertie Wnek. We would also like to thank Joanne Doherty and Jade Talbot, who offered additional support with this study. We are grateful for the contributions of the participants at the stakeholder roundtable discussions in London, Leeds and Birmingham. We would also like to thank all those who participated in the research and gave up their time to be interviewed and participate in the focus group discussions.
This work contains statistical data from the Office for National Statistics (ONS), which is Crown Copyright. The use of the ONS statistical data in this work does not imply the endorsement of the ONS in relation to the interpretation or analysis of the statistical data. This work uses research datasets which may not exactly reproduce National Statistics aggregates. The permission of the ONS to use the Longitudinal Study is gratefully acknowledged, as is the help provided by staff of the Centre for Longitudinal Study Information & User Support (CeLSIUS). CeLSIUS is supported by the ESRC Census of Population Programme (Award Ref: ES/R00823X/1). The authors alone are responsible for the interpretation of the data.
City Gate, 185 Dyke Road, Brighton, BN3 1TL United Kingdom.
Website: www.employment-studies.co.uk
Email: askIES@employment-studies.co.uk
Tel.: +44 (0) 1273 763400
-
Employers are encouraged to consider outreach carefully and to adopt best practice as found in the Commission’s Toolkit for employers – accessible via www.socialmobilityworks.org ↩
-
According to the ONS, working from home is often more possible in occupations which “require higher qualifications and experience”. Less than 30% of the workforce were able to work from home during the pandemic. ONS. Coronavirus and homeworking in the UK Labour Market. ↩
-
These issues are addressed using a mixed-methods approach, comprising: a quantitative analysis of secondary and aggregate data and a qualitative analysis of insights from interviews and focus group discussions with individuals who have migrated out of deprived areas and with those who live in deprived areas. ↩
-
Black, S.E. and Devereux, P.J. (2010). Recent developments in intergenerational mobility, NBER Working Paper No. 15889, Cambridge, MA: National Bureau of Economic Research. ↩
-
Ibid. ↩
-
Blanden, J., Goodman, A., Gregg, P., Machin, S. (2004). Changes in intergenerational mobility in Britain. In M. Corak (ed.), Generational income mobility in North America and Europe (pp. 122–146), Cambridge: Cambridge University Press. ↩
-
Crawford, C., Gregg, P., Macmillan, L., Vignoles, A., Wyness, G. (2016). Higher education, career opportunities, and intergenerational inequality, Oxford Review of Economic Policy, 32(4), 553–575. ↩
-
Stuhler, J. A. (2018). Review of intergenerational mobility and its drivers, Luxembourg: Publications Office of the European Union. ↩
-
Corak, M. (2013). Income inequality, equality of opportunity and intergenerational mobility, IZA Discussion Paper No. 7520, Bonn: Institute for the Study of Labor (IZA). ↩
-
Lochner, L. and Monge-Naranjo, A. (2012). Credit constraints in education, Annual Review of Economics, 4(1), 225–256. ↩
-
Belfield, C., Crawford, C., Greaves, E., Gregg, P., Macmillan, L. (2017). Intergenerational income persistence within families, IFS Working Paper W17/11, London: Institute for Fiscal Studies. ↩
-
Altzinger, W., Cuaresma, J. C., Rumplmaier, B., Sauer, P., Schneebaum, A. (2015). Education and social mobility in Europe: Levelling the playing field for Europe’s children and fuelling its economy, Working Paper No. 80, European Union WWW for Europe project. ↩
-
Fielding, A.J. (1992). Migration and social mobility: South East England as an escalator region, Regional Studies, 26(1), 1–15. ↩
-
Duta, A. and Iannelli, C. (2018). Social class inequalities in graduates’ labour market outcomes: The role of spatial job opportunities, Social Sciences, 7(201), 1-18. ↩
-
Bell, B., Blundell, J., Machin, S. (2018). The changing geography of intergenerational mobility, CEP Discussion Paper No 1591, London: Centre for Economic Performance. ↩
-
Champion, T., Coombes, M., Gordon, I. (2013). Urban escalators and inter-regional elevators: The difference that location, mobility and sectoral specialisation make to occupational progression, SERC Discussion Paper 139, London: Spatial Economics Research Centre, LSE. ↩
-
Chetty, R. and Hendren, N. (2018). The impacts of neighborhoods on intergenerational mobility I: childhood exposure effects, The Quarterly Journal of Economics, 133(3), 1107–1162. ↩
-
O’Leary, N.C. and Sloane, P.J. (2008). Rates of return to degrees across British regions, Regional Studies, 42, 199-213. ↩
-
Social Mobility Commission, State of the Nation 2017, 2017. ↩
-
Bell, B., Blundell, J., Machin, S. (2018). The changing geography of intergenerational mobility, CEP Discussion Paper No 1591, London: Centre for Economic Performance. ↩
-
Friedman, S. and Laurison, D. (2017). Mind the gap: financial London and the regional class pay gap, The British Journal of Sociology, 68(3), 474-511. ↩
-
Fielding, A.J. (1992). Migration and social mobility: South East England as an escalator region, Regional Studies, 26(1), 1–15. ↩
-
Ham, M. v., Findlay, A., Manley, D., Feijten, P. (2012). Migration, occupational mobility and regional escalators in Scotland, Urban Studies Research, Article 827171. ↩
-
Gibbons, S., Overman, H., Pelkonen, P. (2010). Wage disparities in Britain: People or place? SERC Discussion Papers SERCDP0060, London: Spatial Economics Research Centre, LSE. ↩
-
Duta, A. and Iannelli, C. (2018). Social class inequalities in graduates’ labour market outcomes: The role of spatial job opportunities, Social Sciences, 7(201), 1-18. ↩
-
Green, A. (2017). Understanding the drivers of internal migration. In: T. Champion, T. Cooke, & I. Shuttleworth (eds), Internal migration in the developed world, London: Routledge. ↩
-
Champion, T. (2016). Internal migration and the spatial distribution of population. In: T. C. Falkingham (ed), Population change in the United Kingdom, London: Rowman and Littlefield International. ↩
-
Ham, M. v., Findlay, A., Manley, D., Feijten, P. (2012). Migration, occupational mobility and regional escalators in Scotland, Urban Studies Research, Article 827171. ↩
-
Ibid. ↩
-
Ibid. ↩
-
Gregg, P. and Tominey, E. (2005). The wage scar from male youth unemployment, Labour Economics, 12(4), 487–509. ↩
-
Weekly vacancy analysis: Vacancy trends in week-ending 26 April 2020, Institute for Employment Studies (IES) ↩
-
IES Working at Home Wellbeing Survey, Institute for Employment Studies (IES) ↩
-
The term ‘interviewee’ is used throughout this section of the report to describe those who participated in both the individual in-depth interviews and those who took part in the focus group research. Where the findings differ between these groups, this is made explicit in the text. ↩
-
In our analysis we specify 4 models: In model 1 we control only for the area type. In model 2 we also control whether 2 areas share a border and the distance between them. In model 3 we also control for the demographic structure of the sending local authorities. In model 4 we also control for the relative economic conditions of the sending and the receiving local authorities. The technical report has a detailed explanation of the 4 model specifications. ↩
-
We reviewed internal migration destinations separately by quintile of deprivation of the sending area. Those regressions are reported in the technical report (Tables 16-20). ↩
-
This is calculated as (0.043 − 0.037)/0.037. ↩
-
Note that the reference category is hot spots. ↩
-
About the area classifications - Office for National Statistics ↩
-
University of Essex, Institute for Social and Economic Research (2019). Understanding Society: Waves 1-9, 2009-2018 and Harmonised BHPS: Waves 1–18, 1991–2009: Special Licence Access, Local Authority District. [data collection]. 11th Edition. UK Data Service. SN: 6666, http://doi.org/10.5255/UKDA-SN-6666-11. ↩
-
The answers regarding the second most important reason can be found in the technical report (Tables 25, 26). ↩
-
As the questions on attitudes to work and aspirations were only asked in waves 1, 9 and 14 of the BHPS, our sample sizes were reduced further in our analysis. ↩
-
It should be noted there might still be unobservable differences between the 2 groups that are not fully captured by this proxy. ↩
-
For this part of the analysis we use the ONS Longitudinal Study (LS). The LS is a 1% sample of the decennial census of England and Wales. LS participants are selected based on being born on one of 4 (undisclosed) birth dates and are traced to the NHS register, enabling the linkage of events data, such as mortality and cancer registrations, as well as data from 5 consecutive censuses (1971, 1981, 1991, 2001 and 2011). Linkage stops when the participant dies or emigrates from England or Wales, and new members join the LS when they are born on one of the 4 birth dates or after they move to England or Wales from another country. The LS therefore provides representative cross-sectional and longitudinal information about the population of England and Wales for the years 1971 to 2011. ↩
-
More details on the characteristics of the sample can be found in Table 30 in the technical report. ↩
-
https://whatworksgrowth.org/resources/local-procurement-1/ ↩
-
Henley, D. (2012). Cultural education in England: An independent review, London: Department for Culture, Media and Sport and Department for Education. ↩