Work
Updated 3 March 2016

© Crown copyright 2016
This publication is licensed under the terms of the Open Government Licence v3.0 except where otherwise stated. To view this licence, visit nationalarchives.gov.uk/doc/open-government-licence/version/3 or write to the Information Policy Team, The National Archives, Kew, London TW9 4DU, or email: psi@nationalarchives.gov.uk.
Where we have identified any third party copyright information you will need to obtain permission from the copyright holders concerned.
This publication is available at https://www.gov.uk/government/statistics/immigration-statistics-october-to-december-2015/work
Valid: 25 February 2016 to 25 May 2016
Data relate to the calendar year 2015 and all comparisons are with the calendar year 2014, unless indicated otherwise.
Back to ‘Immigration statistics October to December 2015’ content page.
This is not the latest release. View latest release.
1. Key facts
There were 92,062 Tier 2 skilled work visas granted in the calendar year 2015, up 2% (+1,365), and 44,948 Tier 5 Youth mobility and temporary visas granted, also up 2% (+945). These increases were offset by fewer grants in the Tier 1 Investor category, down 76% (-2,287) following changes introduced in November 2014, and fewer grants to dependants in routes now closed to new applicants (Tier 1 General -1,506; Tier 1 Post Study -346). Of the 177,544 decisions in 2015, 6% (10,861) were refused.
In the year ending September 2015, the ONS estimate there were 67,000 non-EU long-term immigrants for work, an increase of 2% (+1,000) compared with the previous 12 months. However, this increase was not statistically significant. Over the same period, long-term (1 year or more) work-related visas granted to main applicants also rose, by 25% to 79,428 in the year ending September 2015. The level and trend from the two series are similar over the longer term. There are nonetheless a number of reasons why the long-term immigration estimates and visas data may show different trends in the shorter term, including sampling variation and coverage; further details are given below.
There was a 3% increase in sponsored visa applications for skilled work to 56,012 in 2015 (main applicants). Most of the increase was accounted for by for the four largest sectors: Information and Communication (23,741; +3%), Professional, Scientific and Technical Activities (10,642; +2%), Financial and Insurance Activities (6,810; +4%) and Human Health and Social Work Activities (3,513; +13%). The Information and Communication sector accounted for 42 percent of applications by skilled work sponsors.
Indian nationals accounted for 57% of total skilled work visas granted (52,360 of 92,062), with nationals of the USA the next largest group of skilled workers granted a visa in 2015 (10,130 or 11%).
Work-related grants of extensions fell by 9% (-8,187) in 2015 to 80,217. This fall was mainly accounted for by 2,977 fewer Tier 1 General grants (closed to new entrants since December 2010) as well as 4,349 fewer Tier 1 Entrepreneur category grants. This latter change reflected tightened eligibility rules for individuals seeking to switch to the Tier 1 Entrepreneur category intended to clamp down on abuse. There were also 2,525 fewer Tier 2 General extensions granted. Of the 86,975 decisions on work-related grants of extension in the same period, 8% (6,758) were refused.
The Migrant Journey Sixth Report indicated that, based on data matching, a quarter (25% or 20,437) of those issued skilled work visas in 2009 had been granted permission to stay permanently (settlement) 5 years later and a further 10% (7,906) still had valid leave to remain.
2. Work immigration: latest trends
| 2014 | 2015 | Change | Percentage change | |
| Work-related visas granted | 167,147 | 165,977 | -1,170 | -1% |
| of which: | ||||
| High value (Tier 1) visas | 9,854 | 5,401 | -4,453 | -45% |
| Skilled (Tier 2) visas | 90,697 | 92,062 | +1,365 | +2% |
| Youth mobility and temporary workers (Tier 5) visas | 44,003 | 44,948 | +945 | +2% |
| Non-PBS/Other work visas | 22,593 | 23,566 | +973 | +4% |
| Year ending September 2014 | Year ending September 2015 | Change | Percentage change | |
| Long-term immigration for work (1),excluding dependants | 66,000 | 67,000 | +1,000 | +2% |
| Long-term (1 year or more) work-related visas granted excluding dependants | 63,541 | 79,428 | +15,887 | +25% |
Table notes
Source: Home Office, Immigration Statistics October to December 2015 Visas table vi 04_q, International Passenger Survey, Office for National Statistics Migration Statistics Quarterly Report. (1) Immigration for work data are estimates of the number of non-EU nationals intending to change their residence to the UK for at least 12 months based on the International Passenger Survey.
3. Long-term trends in work-related immigration
There was a long-term reduction in work-related visas granted, admissions and non-EU immigration from 2006 to 2012. There have been increases more recently (and falls in extensions related to the previous closure of the Tier 1 General and Tier 1 Post Study categories to new applicants – see below).
The chart below shows that work-related visas and admissions have been moving in line with each other. International Passenger Survey (IPS) estimates of non-EU work immigration are substantially lower as these include only those migrants who state they intend to remain in the UK for a year or more. However, the two series show broadly similar trends with falls from 2006 followed by increases from the middle of 2013. Data on just long-term work visas (1 year or more) for main applicants are much closer to the IPS series, and have become even closer more recently (the difference having reduced from 47,000 in 2007 and 2008 to within 1,000 for the year ending December 2014). This may in part reflect changes made as part of the introduction of the Points-Based System in 2008, such as the introduction of the short-term intra-company transfer route.
Long-term trends in work-related immigration
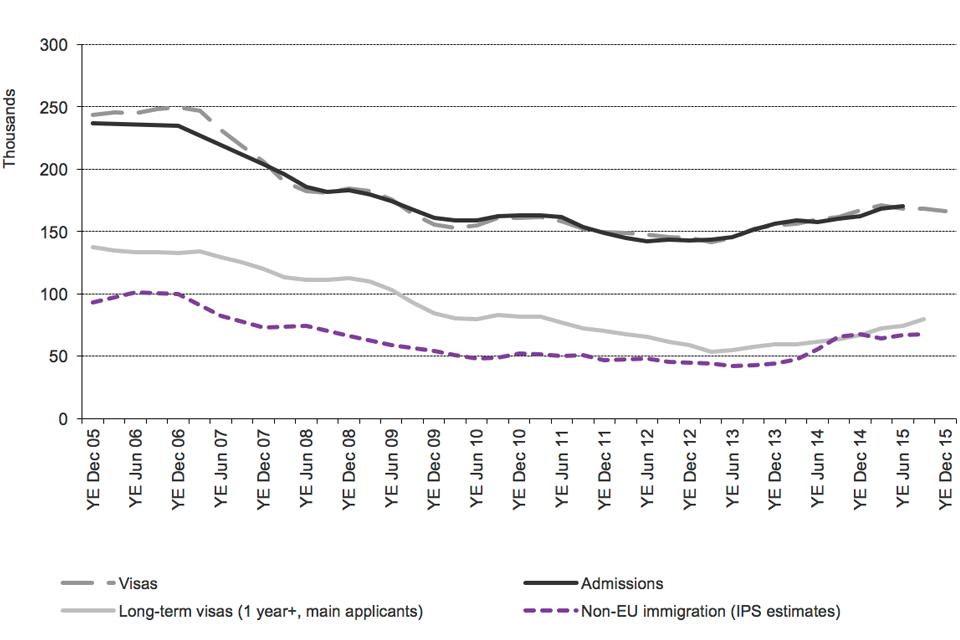
Chart shows the trends for work of visas granted, admissions and International Passenger Survey (IPS) estimates of non-EU immigration, between 2005 and latest data published. The data are sourced from Tables vi 04 q, ad 02 q and corresponding datasets.
Chart notes
Source: Home Office, Immigration Statistics October to December 2015, Visas tables vi 04 q(Visas volume 1), Admissions table ad 02 q and corresponding datasets; Office for National Statistics Migration.
There are a range of potential reasons why IPS figures differ from figures for work visas granted or passenger arrivals, and hence why the trends in the different series do not always correspond, including:
- sampling variation in the IPS, (for example the increase of 1,000 in work-related immigration for the year ending September 2015 has an estimated confidence interval of +/-15,000);
- IPS data for work relate to individuals whose main reason for migration was work related so (unlike visas data) are likely to exclude their dependants. IPS data are more comparable with visa totals for main applicants than with total visas data;
- differences between intentions and visa length;
- individuals may migrate for multiple different reasons;
- timing differences between when visas are granted and when an individual actually travels; and
- visa and admissions data include dependants, and both short term and long-term migrants.
Further comparisons of the data are described in the user guide.
4. Further analysis: skilled work (Tier 2)
4.1Sponsored visa applications, by nationality and industry sector
There was a 3% increase in sponsored visa applications for skilled work (to 56,012 in 2015, main applicants, Certificates of Sponsorship used). Most of the 1,441 increase was accounted for by the four largest sectors: Information and Communication (up 591; +3%), Professional, Scientific and Technical Activities (up 204; +2%), Financial and Insurance Activities (up 281; +4%) and Human Health and Social Work Activities (up 392; +13%). There were 23,741 applications from the Information and Communication sector in 2015, and this sector alone accounted for 42 percent of all skilled work sponsored visa applications. There have also been increases in each of the last four years for Information and Communication (up 41% since 2011) and Professional, Scientific and Technical Activities (up 48% since 2011).
Sponsored visa applications by industry sector, 2015
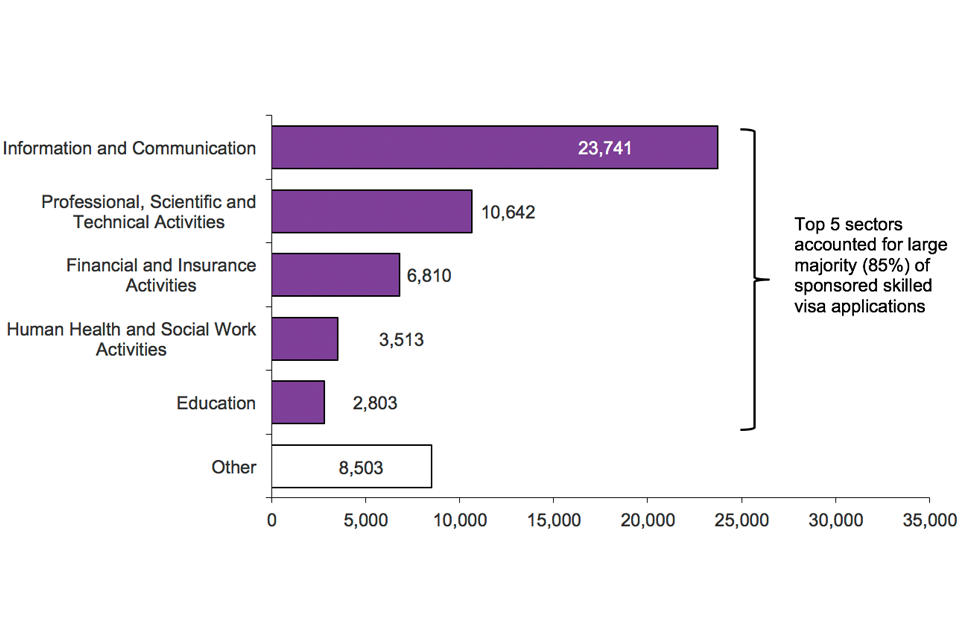
The chart shows the sponsored visa applications by industry sector for 2015. The data are sourced from the sponsorship tables. The top 5 sectors accounted for large majority (85%) of sponsored skilled visa applications.
Chart notes
Source: Home Office, Immigration Statistics October to December 2015 Sponsorship tables.
Indian nationals accounted for over half (55% or 30,900) of the 56,012 applications.
Sponsored visa applications, by nationality, 2015
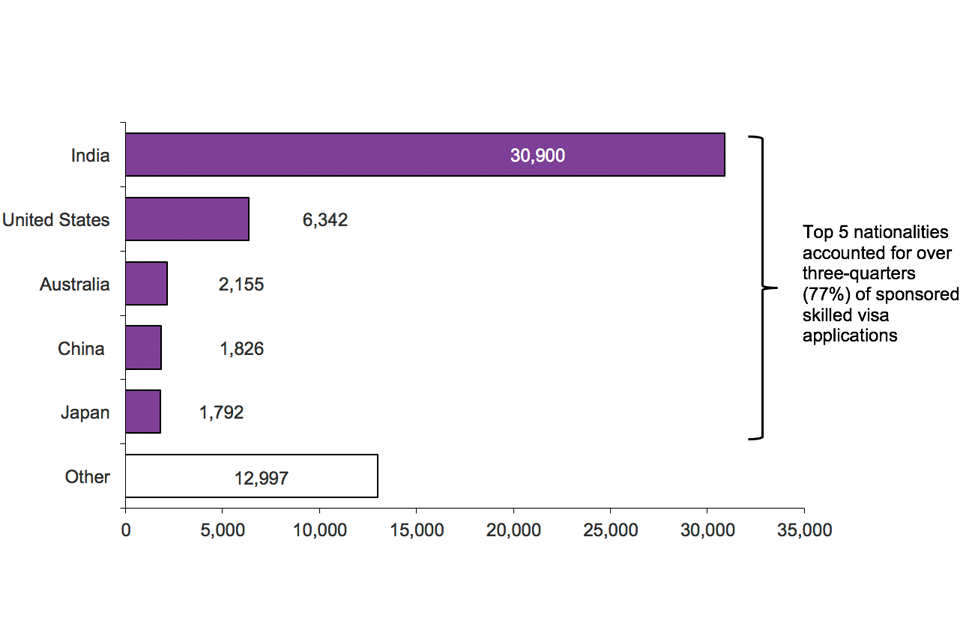
The chart shows the sponsored visa applications by nationality for 2015. The data are sourced from the sponsorship tables. The top 5 nationalities accounted for over three-quarters (77%) of sponsored skilled visa applications.
Chart notes
Source: Home Office, Immigration Statistics October to December 2015 Sponsorship tables.
4.2 Skilled work visas granted
In the calendar year 2015, almost all (97%) of the 94,652 decisions made on entry clearance applications for skilled work were grants (92,062). The increase in skilled (Tier 2) grants was accounted for by Tier 2 General main applicants (up 2,121 or +14%), and Tier 2 Dependants (other than ICT dependents, up 776 or +5%), partly offset by falls in Short term Intra Company worker grants down 378 (-2%) and falls for ICT dependants down 1,323 (-6%).
Skilled work: latest trends in visa grants
| 2014 | 2015 | Change | Percentage change | |
| Skilled (Tier 2) visas granted | 90,697 | 92,062 | +1,365 | +2% |
| of which: | ||||
| Main applicants total | 52,463 | 54,383 | +1,920 | +4% |
| Tier 2 - General | 15,254 | 17,375 | +2,121 | +14% |
| Tier 2 - Intra Company Transfers | 2,169 | 2,183 | +14 | +1% |
| Tier 2 - Intra Company Transfers - Short Term | 21,607 | 21,229 | -378 | -2% |
| Tier 2 - Intra Company Transfers - Long Term | 12,845 | 13,009 | +164 | +1% |
| Tier 2 - Ministers of Religion | 398 | 411 | +13 | +3% |
| Tier 2 - Sportsperson | 137 | 125 | -12 | -9% |
| Work Permit Holders | 53 | 51 | -2 | -4% |
| Dependants total | 38,234 | 37,679 | -555 | -1% |
| Tier 2 - Dependant | 14,372 | 15,148 | +776 | +5% |
| Tier 2 - Intra Company Transfers Short-Term | 8,854 | 8,406 | -448 | -5% |
| Tier 2 - Intra Company Transfers Long-Term | 14,979 | 14,104 | -875 | -6% |
| Work Permit Holders | 29 | 21 | -8 | -28% |
Table notes
Source: Home Office, Immigration Statistics October to December 2015 Visas tables vi 04 q(Visas volume 1)
4.3 Skilled work extensions granted
Similarly, in 2015, almost all (94%) of the 62,809 decisions on extensions of stay for skilled work were grants (59,280). There was a slight (3%; 1,654) fall in extensions granted reflecting 2,237 fewer Tier 2 General main applicant grants, as well as an increase of 793 in extensions granted for Intra Company Transfers dependants.
Skilled work: latest trends in grants of extensions
| 2014 | 2015 | Change | Percentage change | |
| Skilled (Tier 2) granted of extensions | 60,934 | 59,280 | -1,654 | -3% |
| of which: | ||||
| (Main applicants) | 35,266 | 33,213 | -2,053 | -6% |
| of which: | ||||
| Tier 2 - General | 26,700 | 24,463 | -2,237 | -8% |
| Tier 2 - Intra-Company Transfers | 8,045 | 8,249 | +204 | +3% |
| Tier 2 - Ministers of Religion | 427 | 410 | -17 | -4% |
| Tier 2 - Sportsperson | 94 | 90 | -4 | -4% |
| Work Permit Holders | 0 | 1 | +1 | |
| (Dependants) | 25,668 | 26,067 | +399 | +2% |
| of which | ||||
| Tier 2 - General | 16,043 | 15,755 | -288 | -2% |
| Tier 2 - Intra-Company Transfers | 8,999 | 9,792 | +793 | +9% |
| Tier 2 - Ministers of Religion | 523 | 447 | -76 | -15% |
| Tier 2 - Sportsperson | 96 | 65 | -31 | -32% |
| Work Permit Holders | 7 | 8 | +1 | +14% |
Table notes
Source: Home Office, Immigration Statistics October to December 2015 Extensions table ex 01_q, International Passenger Survey, Office for National Statistics, Migration Statistics Quarterly Report
4.4 Extensions granted in Tier 2 by previous category
Looking at individuals’ previous category in the latest available statistics for 2014, there were 35,266 extensions granted for skilled work. Of these, it is estimated that 23,379 were grants to individuals previously in Tier 2 (i.e. skilled work), 5,639 were grants to former students, and 5,374 were grants to individuals previously in the Tier 1 - Post-Study category (now closed to new entrants).
As the chart below indicates, total work-related grants of extensions have fallen from 96,798 in 2011 to 53,055 in 2014 mainly driven by falls in the Tier 1 Post Study and Tier 1 General categories (from 65,897 in 2011 to just 3,612 in 2014, reflecting the closure of these routes to all but dependants of previous applicants in April 2012 and December 2010 respectively). This decrease was partly offset by increases in Tier 2 skilled work extensions granted both for those whose previous category was work (which more than doubled from 16,301 in 2011 to 33,163 in 2013 then fell by 12% to 29,250 in 2014) and for former students (from 1,730 in 2011 to 5,639 in 2014). Trends were partly influenced by the introduction of Tier 2 in November 2008 with visas up to 3 years replacing a previous skilled work route that had visas up to 5 years requiring no extension before any application for settlement.
Work-related extensions, 2011 to 2014 (main applicants)
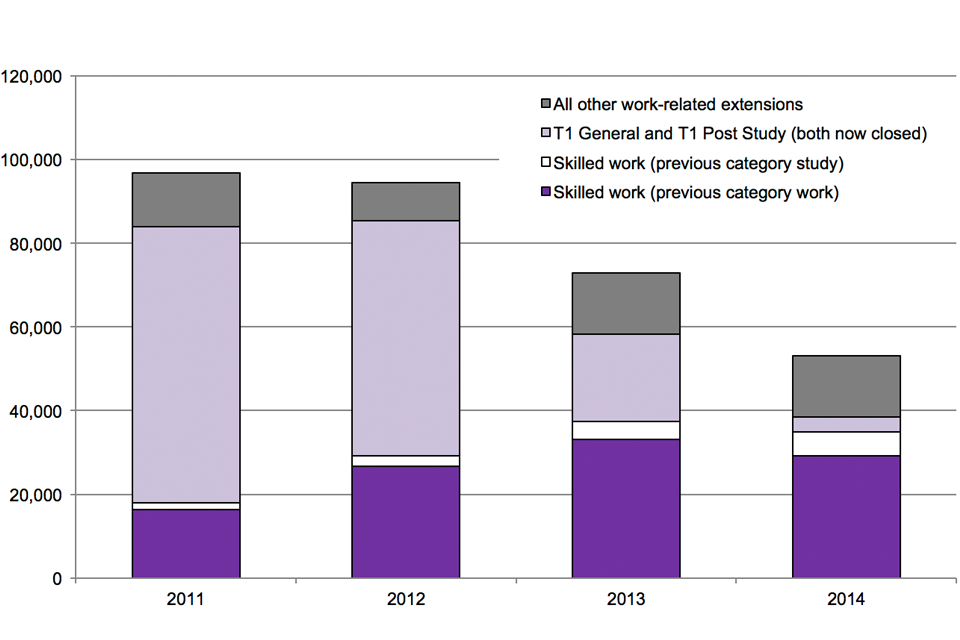
The chart shows the trends in extensions of stay for work, including skilled work by previous category. The chart is based on data in Table expc 01 and expc 01 w.
Chart notes
Source: Home Office, Immigration Statistics October to December 2015, Extensions: tables expc 01 and expc 01 w
5. Staying in the UK
In February 2016 the Home Office published its “Migrant Journey: Sixth report”, which shows how non-EEA migrants change their immigration status or achieve settlement in the UK. Main points include:
-
25% (20,437) of those issued skilled work visas (with a potential path to settlement) in the 2009 cohort had been granted settlement 5 years later and a further 10% (7,906) still had valid leave to remain
-
Indian nationals were issued the largest proportion (41%) of skilled work visas in the 2009 cohort and, of these skilled Indian nationals, 24% had received settlement after 5 years, while a further 8% still had valid leave to remain.
Source: Home Office, Migrant Journey Sixth Report.
6. UK nationals and non-UK nationals: Employment levels
Estimates from the Labour Force Survey, published by the ONS, show that the number of UK nationals in employment in October to December 2015 was 28.3 million, up 278,000 (+1%) compared with the same quarter in 2014. The employment rate for UK nationals in October to December 2015 was 74.6%, up 0.8 percentage points on the previous year, and the highest recorded in this series since it began in 1997.
There were 3.2 million non-UK nationals in employment in October to December 2015, up 254,000 (+8.6%) compared with the same quarter in 2014. The employment rate for non-UK nationals was 72.1%, up 2.3 percentage points on the previous year (slightly down on the record high rate of 72.8% seen in Q3 2015). The increase was almost entirely accounted for by higher employment of EU nationals (up 215,000 to 2.0 million). There were increases in each of the EU14 (up 92,000 to 853,000), EU8 (up 73,000 to 968,000) and EU2 (up 48,000 to 202,000) groups.
The number of non-EU nationals in employment increased to 1.2 million (by 38,000 or 3.4%).
The total growth in employment over the last year was 532,000; over half (+278,000) of this growth can be accounted for by UK nationals. The remaining growth accounted for by non-UK nationals (+254,000) was almost entirely accounted for by the rise in EU nationals in employment (+215,000).
7. Data tables
Data on immigration for work, sourced from Home Office administrative systems, can be found in the following tables:
Visas vol. 1: Tables vi 01 q, vi 04 and vi 04 q
vi 01 q Entry clearance visa applications and resolution by category
vi 04 Entry clearance visas granted by category
vi 04 q Entry clearance visas granted by category
Visas vol. 2: Table vi 06 q w
vi 06 q w Entry clearance visas granted by category and country of nationality: Work
Sponsorship: Tables cs 01 q to cs 06 q
Admissions: Tables ad 02 to ad 03 and ad 03 w
Extensions: Tables ex 01 to ex 02, ex 02 w and expc 01 w
Settlement: Tables se 01 to se 03
European Economic Area: Tables ee 01, ee 01 q and ee 02
8. Background information
This section includes figures on work-related visas granted, passenger arrivals and extensions granted for non-EEA nationals. It also includes figures on long-term immigration to work (i.e. those intending to stay for at least 12 months for work) for non-EU nationals.
Data include dependants as well as main applicants unless stated otherwise. Provisional estimates of long term immigration for work from the ONS International Passenger Survey (IPS) relate to those whose main reason for migration is to work and so are likely to exclude dependants (who would be more likely to say their main reason was to ‘accompany or join’ rather than to work).
8.1Reason for migration and the labour market
IPS statistics and visa statistics represent flows of people, only a proportion of whom will remain for longer periods. A recent Home Office research report, ‘The reason for migration and labour market characteristics of UK residents born abroad’ (September 2014), uses ONS data from the Labour Force Survey to provide estimates of the number of residents born abroad by the reason for original migration.
A key finding of this was that the distribution of original purposes given for migrating by people resident in the UK who were born abroad is different from that produced when looking at the migration flows reported in the IPS. For example, the proportion of people who come for family purposes or as a dependant takes greater significance, because of the higher likelihood of people who come for relationship reasons to stay longer. Similarly, although many foreign students are temporary the analysis confirmed findings in other studies that a number of foreign students do stay on as residents.
8.2Tier 2 General limit, MAC reviews of Tier 2
There is a limit on the number of CoS, called Restricted CoS (RCoS), that will be issued each year of 20,700 for most Tier 2 (General) main applicants applying from outside of the UK. There are 2,550 RCoS available in April and 1,650 in each of the following months. Until recent months, the route has been undersubscribed and therefore the limit not reached. The monthly allocation was oversubscribed for the first time in June 2015. Table 2.2 of the MAC’s recent Review of tier 2: analysis of salary thresholds outlines how applications are prioritised when the monthly limit is reached.
Employers must apply for a restricted Certificate of Sponsorship if they want to recruit a migrant under the Tier 2 (General) limit. The limit applies to all those who will be applying from overseas and will be paid less than £155,300 a year, and those currently in the UK as a Tier 4 dependant. Places in the limit are allocated using a points based process. Points are awarded for shortage occupations, PhD-level occupations, and salary.
If the Home Office allocates a restricted CoS to a sponsor, this does not mean that the Home Office has approved the application to bring that worker to the UK. All Tier 2 migrants must still apply for entry clearance, which will be granted if they can show they hold a valid CoS, will earn an appropriate salary, maintenance and appropriate level of English, and do not fall under the general grounds for refusal.
Data relating to the monthly allocation of Restricted CoS is published at:‘Allocations-of restricted certificates of sponsorship’.
Results from the Migration Advisory Committee’s review of salary thresholds were published at Review of Tier 2: analysis of salary thresholds.
On 15 October 2015, the Home Secretary wrote to the Chair of the MAC to commission them to examine if there is a national shortage of nurses or specific nursing job titles. The MAC’s call for evidence has closed and it is due to report to Government by 15 February 2016. Details are at ‘Call for evidence review: shortage occupation list - nurses’.
MAC’s report on its review of Tier 2: “Balancing migrant selectivity, investment in skills and impacts on UK productivity and competitiveness” was published in January 2016.
8.3Tier 1 (Graduate Entrepreneur) and Tier 1 (Exceptional Talent) limits
In recent years, Tier 1 of the Points Based System (PBS) has introduced categories of Tier 1 Exceptional talent - and Tier 1 Graduate Entrepreneur.
Tier 1 Exceptional Talent, introduced in August 2011, is for applicants already internationally recognised at the highest level in their particular field or who have demonstrated exceptional promise and are likely to become future leaders in their field. Applicants must hold an endorsement from one of five recognised bodies: Royal Society, British Academy, Royal Academy of Engineering, Arts Council England, and, since April 2014, Tech City UK. The annual limit for the Exceptional Talent category is 1,000 visas per year, with 500 places released in April and another 500 in October. There were 127 decisions and 122 grants of Tier 1 Exceptional Talent entry clearance visas (main applicants) in the calendar year 2015, representing 12% of the annual limit.
Tier 1 Graduate Entrepreneur, introduced in April 2012, is for graduates identified as having developed genuine and credible business ideas and entrepreneurial skills to go on to establish one or more businesses in the UK. Applicants must hold an endorsement from either a UK Higher Education Institution (HEI) or, since 2013, UK Trade and Investment (UKTI). The annual limit of 2,000 visas per year is shared between UKTI (100 places) and HEIs (1,900 places), and is released in two stages: April and September. There were 135 decisions and 129 grants of Tier 1 Graduate Entrepreneur entry clearance visas (main applicants) in the calendar year 2015, representing 6% of the annual limit.
8.4 Review of Tier 1 Entrepreneur
Results from the Migration Advisory Committee’s review of whether the Tier 1 (Entrepreneur) route is appropriate to deliver significant economic benefits for the UK were published in October 2015 at ‘Migration Advisory Committee (MAC) review: Tier 1 Entrepreneur and Graduate Entrepreneur routes’.
Some additional information on Tier 1 is available at Immigration statistics July to September 2015: Work.