Removals and voluntary departures
Updated 3 March 2016

© Crown copyright 2016
This publication is licensed under the terms of the Open Government Licence v3.0 except where otherwise stated. To view this licence, visit nationalarchives.gov.uk/doc/open-government-licence/version/3 or write to the Information Policy Team, The National Archives, Kew, London TW9 4DU, or email: psi@nationalarchives.gov.uk.
Where we have identified any third party copyright information you will need to obtain permission from the copyright holders concerned.
This publication is available at https://www.gov.uk/government/statistics/immigration-statistics-october-to-december-2015/removals-and-voluntary-departures
Valid: 25 February 2016 to 25 May 2016
Data below relate to 2015 and all comparisons are with 2014, unless indicated otherwise.
Back to ‘Immigration statistics October to December 2015’ content page.
This is not the latest release. View latest release.
1.Key facts
Enforced removals from the UK decreased by 5% to 12,056 in 2015 compared with the previous year (12,627). This is the lowest level since the series began in 2004.
The number of passengers refused entry at port and who subsequently departed has increased by 8% in 2015, to 17,279 from 15,993 for the previous year. While the figure is considerably lower than that in 2004 (36,167), the number refused entry at port and subsequently departing has been increasing slowly since 2012.
In 2015, provisional data show that 5,602 foreign national offenders (FNOs) were removed from the UK, using enforcement powers or via deportation. This was a 6% increase on the previous year (5,286) and the highest number since the series began in 2009.
2.Removals and voluntary departures by type
| Year | Total enforced removals | Total refused entry at port and subsequently departed | Total voluntary departures (1) | Assisted Voluntary Returns (2) | Notified voluntary departures (3) | Other confirmed voluntary departures (4) | Other confirmed voluntary departures as a % of voluntary departures |
| 2011 | 15,063 | 15,700 | 26,419 | 3,120 | 7,587 | 15,712 | 59% |
| 2012 | 14,647 | 13,789 | 29,663 | 3,706 | 6,749 | 19,208 | 65% |
| 2013 | 13,311 | 14,396 | 32,178 | 4,297 | 8,150 | 19,731 | 61% |
| 2014 | 12,627 | 15,993 | 27,552 | 2,408 | 10,832 | 14,312 | 52% |
| 2015 | 12,056 | 17,279 | 26,900 | 1,635 | 13,869 | 11,396 | 42% |
| Change: latest year | -571 | +1,286 | |||||
| Percentage change | -5% | +8% |
Table notes
Source: Home Office, Immigration Statistics October to December 2015, Removals table rv 01
(1) The figures for total voluntary departures and confirmed voluntary departures for the latest periods are particularly subject to upward revision as matching checks are made on travellers after departure (see the section ‘About the figures’), so care should be taken when interpreting these figures. Comparisons with the previous 12 months for voluntary departures have not been included here due to the retrospective nature of data-matching exercises. These figures will be subject to upward revision in future releases.
(2) Assisted Voluntary Return – where financial assistance is provided.
(3) Notified voluntary departures – where a person notifies the Home Office that they have departed. This includes those removed from detention facilities.
(4) Other confirmed voluntary departures – where a person has been identified as leaving when they no longer had the right to remain in the UK, either as a result of embarkation controls or by subsequent data-matching on Home Office systems. Embarkation controls (where immigration officers interview departing foreign nationals to establish their immigration status and confirm the person’s embarkation) ceased from June 2014.
The number of people refused entry at port and subsequently departed is considerably lower in recent years than at the beginning of the data series in 2004. There was a sharp decrease from 31,859 in the year ending June 2009 to 13,871 in the year ending September 2012. There is no single cause identified for this fall, although a fifth (21%) of the decrease was due to a fall in the number of nationals of Afghanistan being refused entry and subsequently removed (-3,720). The overall falls are likely to be due to a combination of factors, including tighter screening of passengers prior to travel and changes in visa processes and regimes; for example, South African nationals have been required to have a visa for any length or type of visit to the UK since July 2009.
In 2015, there were 26,900 voluntary departures. This category has represented the largest proportion of those departing from the UK since the end of 2009.
The number of voluntary departures had been growing for most of the past decade until the year ending March 2014. This coincides with the Home Office improving its contact management with migrants and its ability to track those that are leaving the UK. The figures include individuals who have been identified by administrative exercises as those who have overstayed their leave, and then subsequently left the UK without informing the Home Office. This identification process allows the Home Office to focus better its resources on those who remain in the UK. The figures since the year ending June 2014 have shown a steep decline. However, due to the retrospective nature of data-matching exercises, the data on voluntary departures are particularly subject to upward revision as additional checks are made on travellers after departure.
Of the 26,900 voluntary departures in 2015, 52% of those departing were categorised as notified voluntary departures, 42% as other confirmed voluntary departures and 6% as Assisted Voluntary Returns (AVRs).
Of the 33,189 people who left detention in 2015, 15,086 people were removed or voluntarily departed from the UK. A more detailed table can be found in the Detention topic.
3.Long-term trends in removals and voluntary departures by type, by rolling year
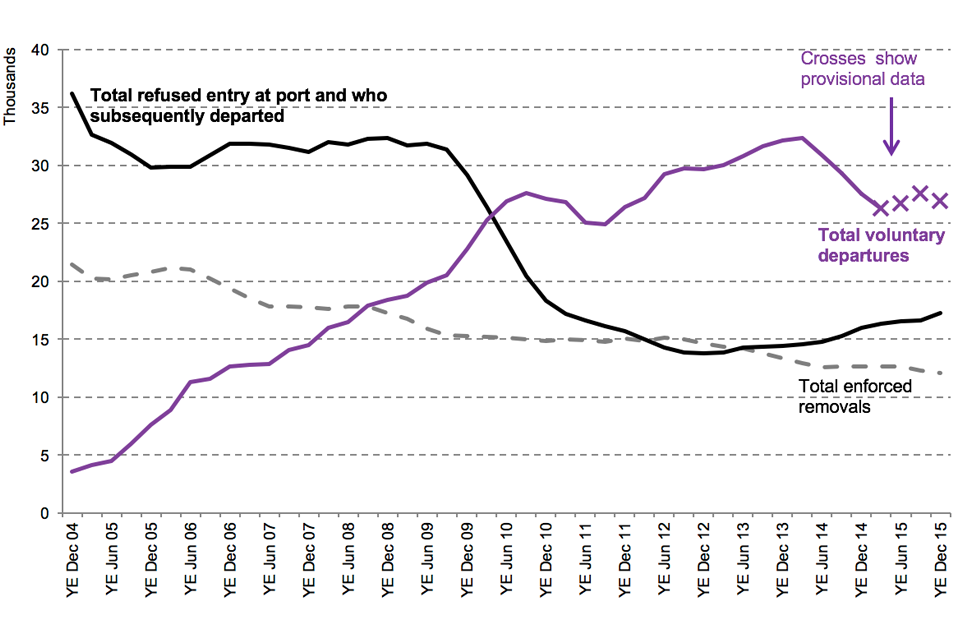
The
Chart notes
Source: Home Office, Immigration Statistics October to December 2015, Removals table rv 01 q.
4.Asylum and non-asylum enforced removals
In 2015, there were 3,264 enforced removals of people who had previously sought asylum, down 25% from the previous year (4,372). This figure is 72% lower than the peak in 2004 (11,743) when this data series began. This long-term decrease in the enforced removal of those who had sought asylum reflects the lower number of asylum applications since 2002.
In 2015, 73% of total enforced removals were non-asylum cases (8,792), up from the previous year (8,255) but down from the peak of 10,070 in 2008.
5.Removals and voluntary departures by nationality
The highest number of enforced removals in 2015 was for Albanian nationals (1,260; 10% of the total) who have also shown the largest increase (+318; +34%) compared to 2014. The second highest was for Pakistani nationals (1,170; 10% of the total) who have also shown the largest decrease (-653; -36%).
The highest number of passengers refused entry at port and subsequently departed was for United States nationals (1,813; 10% of the total), who have also shown the largest decrease compared with the previous year (-227; -11%). The second and third highest numbers were for Albanian (1,169; 7% of the total) and Brazilian nationals (874; 5% of the total). United States and Brazilian nationals who are not coming to the UK for work or for 6 months or more do not need to apply for, and be issued with, a visa prior to arrival. The first time that they can be refused entry will therefore be on arrival in the UK.
The largest increase compared with the previous year was for Iraqi nationals (+702; +949%) followed by Syrian nationals (+455; +183%). The large increase of Iraqi nationals refused entry at the border and subsequently removed may be related to higher than average levels of refusals for asylum and visa applications associated with this nationality. In addition, Border Force have been working closely with the French authorities to reinforce security and support traffic flow at the juxtaposed ports since June 2015, which may increase the number of those refused at the border.
The highest number of voluntary departures in 2015 was for Indian nationals (6,548; 24% of the total) and the second highest number was for Pakistani nationals (3,644; 14% of the total). Chinese nationals showed the largest decrease compared with the previous year (-452; -20%) followed by Pakistani nationals (-217;-6%). Nepalese nationals showed the highest increase (+313; +49%) followed by Bangladeshi nationals (+275; +21%).
For nationals of the European Union there were 20% more enforced removals (3,765) in 2015 compared with the previous 12 months (3,128); 26% more passengers refused entry at port and subsequently departed (1,779 compared to 1,409); and 54% more voluntary departures (714 compared to 463). Increases in the removals of EU nationals comprise the removal of more criminals and those not exercising Treaty Rights.
6.Departures by ‘harm’ assessment
The harm matrix was introduced in 2007 for monitoring the Public Service Agreement (PSA) that then was applied to measure performance in removing the most harmful people first. However, interest in this topic remains despite PSAs being abolished; ‘higher harm’ assessments include people who have committed serious criminal and immigration offences.
In 2015, 12,056 enforced removals and 26,900 voluntary departures were subject to an assessment for a harm rating, of which 19% (2,333) and 1% (203) respectively were assessed as ‘highest harm’. This is compared to the previous year, with 15% (1,860) of enforced removals and 1% (212) of total voluntary departures being assessed as ‘highest harm’.
7.Foreign national offenders
The Home Office removes foreign national offenders (FNOs) using enforcement powers or via deportation. In 2015, provisional data show that 5,602 FNOs were removed, a 6% increase on the previous year (5,286). This number has been steadily increasing since the year ending March 2013 (4,720) and is now the highest number since the series began in 2009.
8.Data tables:
Data referred to here can be found in the following tables:
Removals and voluntary departures vol. 1: Tables rv 01 to rv 03 q.
The following tables are included in this volume:
rv 01 Removals and voluntary departures by type and asylum / non-asylum
rv 01q Removals and voluntary departures by type and asylum / non-asylum
rv 02 Removals and voluntary departures by type, asylum / non-asylum, age at departure date and sex
rv 03 Removals and voluntary departures by country of nationality and type
rv 03q Removals and voluntary departures by country of nationality and type
Removals and voluntary departures vol. 2: Tables rv 04 to rv 04 q.
The following tables are included in this volume:
rv 04 Removals and voluntary departures by country of nationality, age and sex
rv 04 q Removals and voluntary departures by country of nationality, age and sex
Removals and voluntary departures vol. 3: Tables rv 05 to rv 08 q.
The following tables are included in this volume:
rv 05 Removals and voluntary departures by country of nationality and destination
rv 05 q Removals and voluntary departures by country of nationality and destination
rv 06 Removals and voluntary departures by country of destination and type
rv 06 q Removals and voluntary departures by country of destination and type
rv 07 Removals of foreign national offenders
rv 08 Enforced removals and voluntary departures by harm assessment category
rv 08 q Enforced removals and voluntary departures by harm assessment category
9.Background information
The figures in this section relate to numbers of people, including dependants, leaving the UK either voluntarily when they no longer had a right to stay in the UK or where the Home Office has sought to remove them. While individuals removed at a port of entry have not necessarily entered the country, their removal requires action by the UK Border Force and Home Office, such as being placed on a return flight, and is therefore detailed above.
The numbers of people leaving the UK by the various types of departure (enforced removals; refused entry at port and subsequent departures; and voluntary departures) are given above. The voluntary departures figures for the latest period are provisional and rely upon retrospective data-matching exercises that result in future upward revisions.
9.1Migration Transparency Data webpage
A range of key input and impact indicators are currently published by the Home Office on the Migration Transparency Data webpage.