Settlement
Updated 26 May 2016

© Crown copyright 2016
This publication is licensed under the terms of the Open Government Licence v3.0 except where otherwise stated. To view this licence, visit nationalarchives.gov.uk/doc/open-government-licence/version/3 or write to the Information Policy Team, The National Archives, Kew, London TW9 4DU, or email: psi@nationalarchives.gov.uk.
Where we have identified any third party copyright information you will need to obtain permission from the copyright holders concerned.
This publication is available at https://www.gov.uk/government/statistics/immigration-statistics-january-to-march-2016/settlement
Valid: 26 May 2016 to 24 August 2016
Data relate to the year ending March 2016 and all comparisons are with the year ending March 2015, unless indicated otherwise.
Back to ‘Immigration statistics January to March 2016’ content page.
This is not the latest release. View latest release.
1. Key facts
There were 78,334 people granted permission to stay permanently in the year ending March 2016, 26% (-28,203) fewer than the previous year. The decrease was largely accounted for by a fall in family-related grants (-21,217). The number of grants is low relative to the peak number of grants in the year ending September 2010 (241,586).
Work-related grants to stay permanently fell by 9% (-3,628) to 36,590 in the year ending March 2016. Grants to Tier 1 High Value individuals fell by 3,925 to 17,384. Grants in the Tier 2 Skilled Work category rose by 1,678 to 15,022, while settlement granted after 5 years with a work permit decreased by 1,143 to 299 reflecting the replacement of the Work Permit Scheme by the Points-Based System.
Family-related grants to stay permanently fell by two-thirds (-21,217) to 10,841 in the year ending March 2016. There were notable decreases in grants to wives (by 12,217 to 6,130), husbands (by 6,914 to 2,749) and children (by 1,857 to 1,786). This may partly reflect changes to the rules in July 2012 on how quickly partners qualify for settlement and the number of visas and extensions granted in previous years. Details of the July 2012 rule changes are included in the Family section of the user guide.
Asylum-related grants to stay permanently fell by 5% to 18,081 in the year ending March 2016, significantly lower than the peak in 2005 of 67,810.
These year-on-year comparisons of decisions numbers can be affected by changes in case-work resource allocation. Such fluctuations can be examined in more detail in the quarterly data that are also available in the published tables.
2. Grants to stay permanently by reason, and refusals
| Year | Total decisions | Total grants | Work | Asylum | Family | Other | Refusals |
|---|---|---|---|---|---|---|---|
| Year ending March 2012 | 158,538 | 152,108 | 70,905 | 13,263 | 52,125 | 15,815 | 6,430 |
| Year ending March 2013 | 143,963 | 139,739 | 61,331 | 14,968 | 54,694 | 8,746 | 4,224 |
| Year ending March 2014 | 140,651 | 133,279 | 51,974 | 16,728 | 47,769 | 16,808 | 7,372 |
| Year ending March 2015 | 111,088 | 106,537 | 40,218 | 18,950 | 32,058 | 15,311 | 4,551 |
| Year ending March 2016 | 83,993 | 78,334 | 36,590 | 18,081 | 10,841 | 12,822 | 5,659 |
| Change: latest 12 months | -27,095 | -28,203 | -3,628 | -869 | -21,217 | -2,489 | +1,108 |
| Percentage change | -24% | -26% | -9% | -5% | -66% | -16% | +24% |
Table notes
Source: Home Office, Immigration Statistics January to March 2016, Settlement table se 02 q.
3. Long-term trends in grants to stay permanently
The chart below illustrates longer-term trends in grants to stay permanently for the calendar years back to 2004.
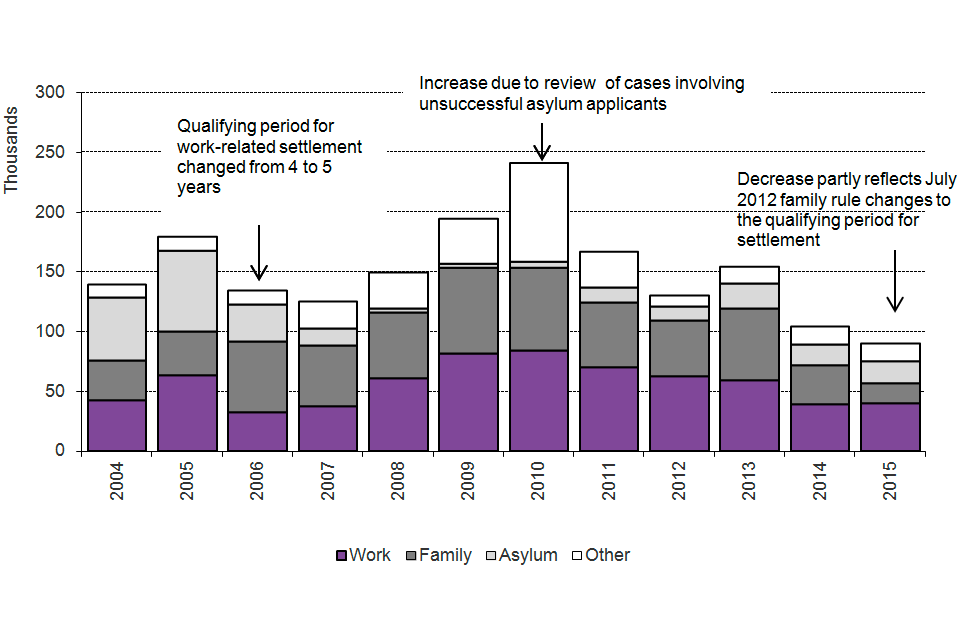
The chart shows the number of people granted settlement by calendar year from 2004. Qualifying period for work-related settlement changed from 4 to 5 years. The data are available in Table se 02.
Chart notes
Source: Home Office, Immigration Statistics January to March 2016, Settlement table se 02.
4. Nationalities granted permission to stay permanently
Data for grants by nationality in 2015 are planned to be published in Immigration Statistics April to June 2016, due to be released on 25 August 2016.
Of the total 104,057 grants of permission to stay permanently in 2014, over a third (37% or 38,820) were to nationals of South Asia and over a quarter (27% or 28,240) were to nationals of Sub-Saharan Africa.
Top 5 nationalities granted permission to stay permanently, 2014
(Total number of grants: 104,057, includes dependants)
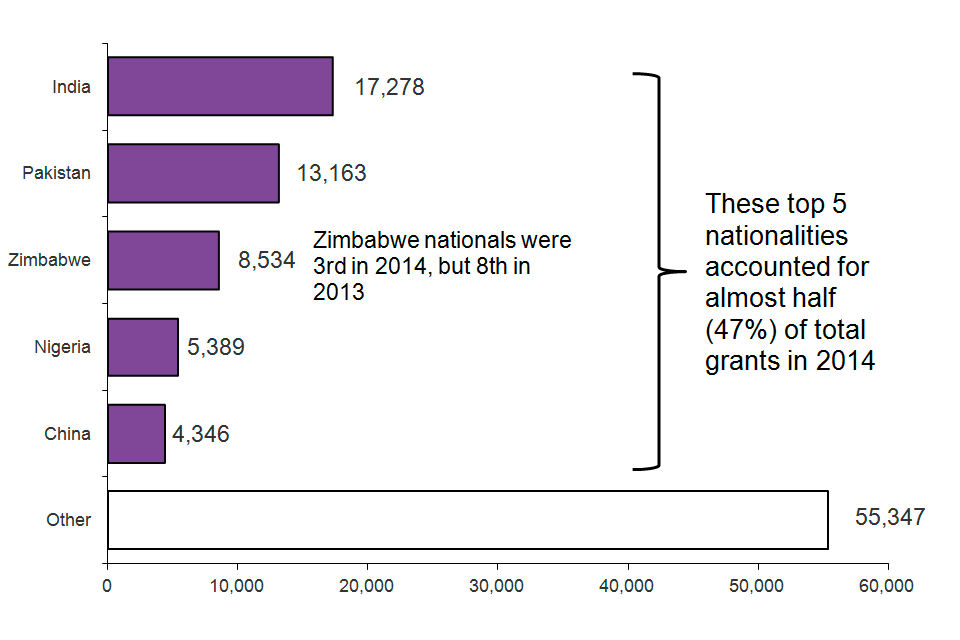
The chart shows grants of settlement by nationality in 2014. Zimbabwe nationals were 3rd in 2014, but 8th in 2013. These top 5 nationalities accounted for almost half (47%) of total grants in 2014. The chart is based on data in Table se 03.
Chart notes
Source: Home Office, Immigration Statistics January to March 2016, Settlement table se 03.
5. Data tables
Further data on settlement are available in Settlement tables se 01 to se 06.
6. Background information
The figures in this section relate to the number of people, subject to immigration control, who are granted or refused permission to stay permanently in the UK, known as settlement.
The numbers of applications and decisions about permission to stay permanently reflect changes over time in levels of those entering the country, as well as policy and legislative changes. These may affect the number of people potentially eligible to stay permanently. The availability and allocation of resources within the Home Office can also affect the number of decisions.
6.1 Migration Transparency Data webpage
A range of key input and impact indicators are currently published by the Home Office on the Migration transparency data webpage.
6.2 Staying in the UK
In February 2016, the Home Office published its ‘Migrant journey: sixth report’, which shows how non-European Economic Area (EEA) migrants change their immigration status or achieve settlement in the UK.