HMRC monthly performance update: February 2018
Published 5 April 2018

© Crown copyright 2018
This publication is licensed under the terms of the Open Government Licence v3.0 except where otherwise stated. To view this licence, visit nationalarchives.gov.uk/doc/open-government-licence/version/3 or write to the Information Policy Team, The National Archives, Kew, London TW9 4DU, or email: psi@nationalarchives.gov.uk.
Where we have identified any third party copyright information you will need to obtain permission from the copyright holders concerned.
This publication is available at https://www.gov.uk/government/publications/hmrc-monthly-performance-report-february-2018/hmrc-monthly-performance-update-february-2018
These figures show how we’re performing against our main customer service objectives.
These objectives are all about:
- how we’re helping customers to do things online
- how quickly we answer your phone calls
- how quickly we handle your letters
- how we handle complaints
Our objectives are set by the Chancellor of the Exchequer and are published in our single departmental plan.
1. At a glance
Below is the full set of figures for our customer service contact volumes, and performance against our customer service objectives.
1.1 Contact volumes
Note: demand for our customer services may vary significantly between months due to the seasonal nature of revenue and customs administration.
| February 2018 | Change from January 2018 | Year-to-date (since April 2017) | |
|---|---|---|---|
| Personal tax account new users | 0.3m | - 0.2m | 14.7m[1] |
| Calls received | 3,118,048 | - 1,644,679 | 43,159,972 |
| Post received [2] | 1,318,702 | + 52,875 | 16,614,455 |
| i-forms received | 107,835 | - 2,203 | 1,147,895 |
| New complaints received [3] | 6,162 | -1,076 | 71,210 |
Notes
- Total users measured from the launch of the personal tax account in December 2015.
- Post may not always get categorised on our live system in-month and the numbers can therefore change in subsequent months. The current month will be subject to greatest revision.
- Complaints may not always get logged on our live system in-month and the numbers can therefore increase in subsequent months. The current month will be subject to greatest revision.
- Numbers may appear not to sum due to rounding.
1.2 Performance
| February 2018 | Change from January 2018 | Year-to-date (since April 2017) | Target | |
|---|---|---|---|---|
| Average speed of answering a customer call | 03.47 | - 00:33 | 04:27 | 05:00 mins |
| Call wait outliers | 12.3% | - 1.7% | 14.6% | No more than 15% wait more than 10 mins |
| % of post handled within 15 days [1] | 89.3% | + 0.8% | 80.4% | 80% |
| % of post handled within 40 days [2] | 97.7% | - 0.3% | 96.8% | 95% |
| Customer satisfaction with digital services | 78.9% | - 2.3% | 80.0% | 80% |
| i-forms responded to within 7 days | 96.5% | + 0.2% | 93.2% | 95% |
Notes
- Post turnaround is based on post where customers are expecting a response.
- To enable 40 days to pass, this data is lagged by one month.
The in-year figures reported are initial management information to provide an indication of our performance. They are subject to revision and audit. Final full-year performance figures will be made available in our annual report and accounts.
2. Customer satisfaction with digital services
2.1 Customer satisfaction
We want to achieve an average of 80% customer satisfaction with our digital services across the year.
During February 2018, the percentage of customers that were either ‘satisfied’ or ‘very satisfied’ with our digital services was:
78.9%
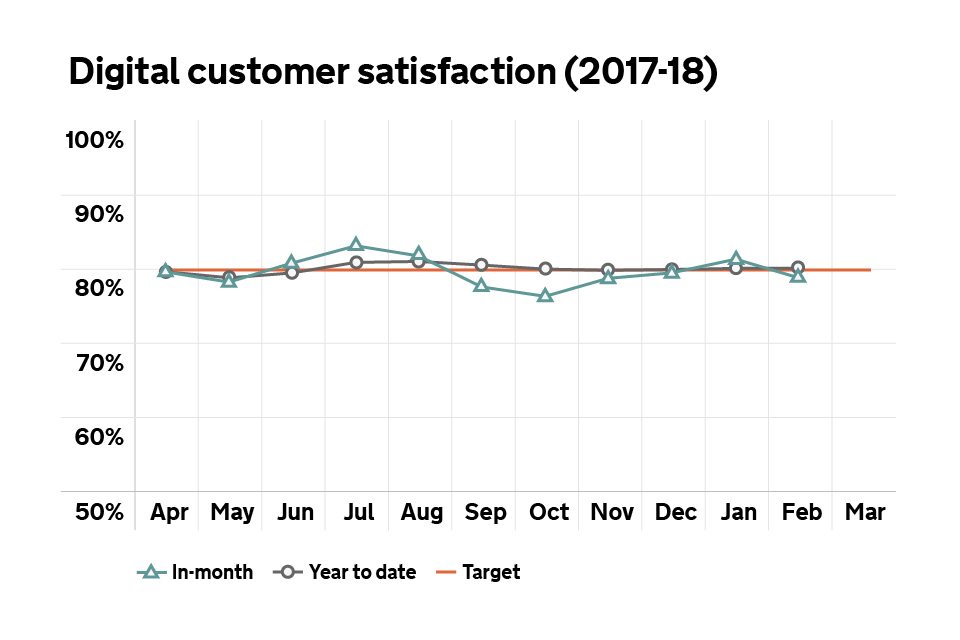
Graph showing customer satisfaction with digital services
3. Phones
We aim to achieve a consistent level of service across our phone helplines.
We aim to:
- answer customer calls to our helplines within an average speed of answer of 5 minutes across the year
- achieve no more than 15% of customer calls waiting more than 10 minutes
We received 3.1 million calls in February 2018.
3.1 Average speed of answering a call
During February 2018 we answered our phones in an average of:
03 mins 47 seconds
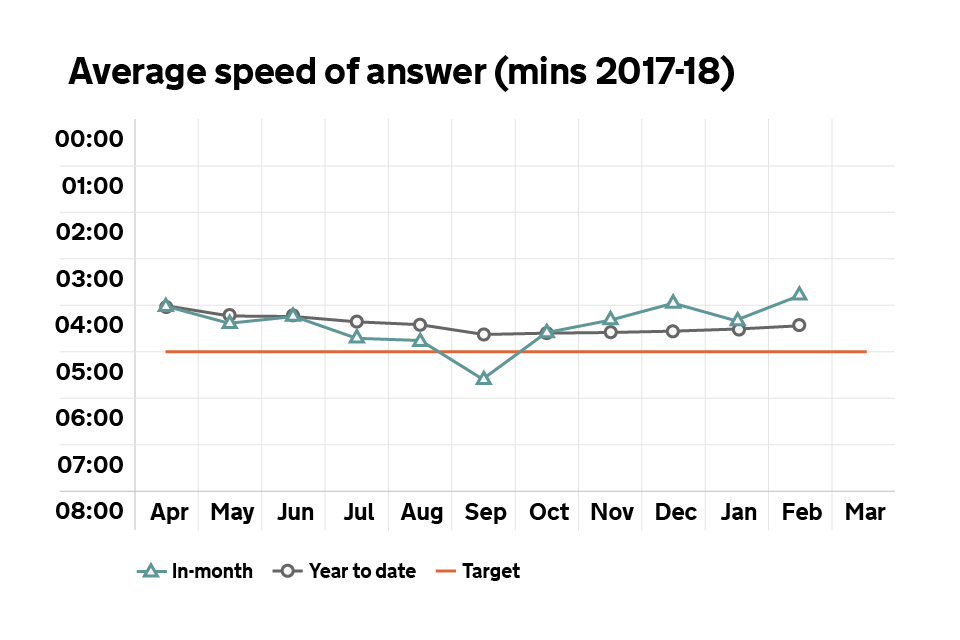
Graph showing the average speed of answer for our phone lines
3.2 Call waiting outliers
During February 2018 the percentage of customer calls that waited more than 10 minutes before the call was answered was:
12.3%
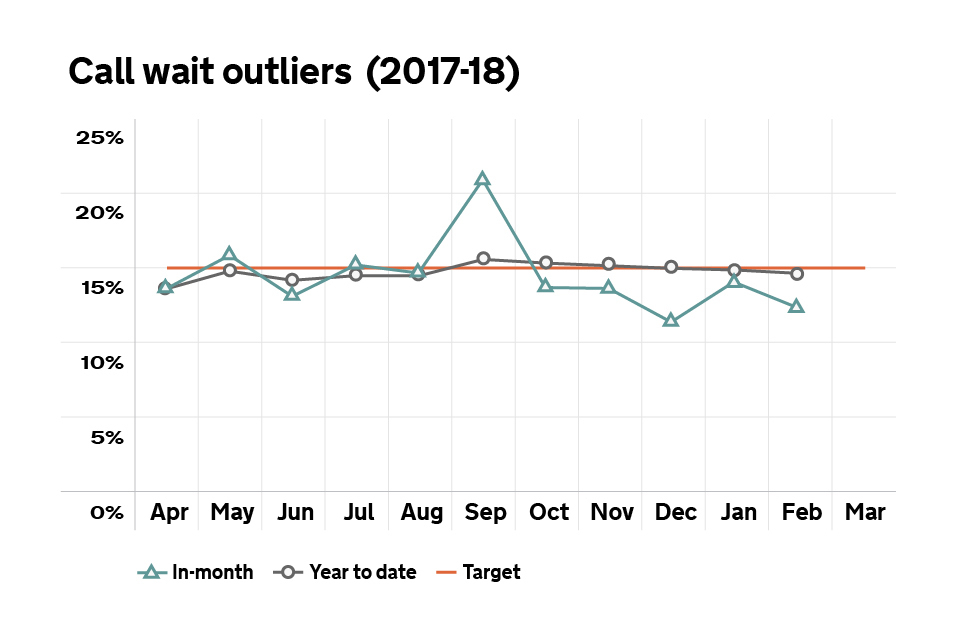
Graph showing the percentage of customer calls that waited more than 10 minutes before the call was answered
3.3 Phone calls handled
During February 2018 we handled on average:
89.5% of our calls
4. Post
We received almost one million targeted post items in February 2018.
We aim to turn around at least 80% of post and complaints within 15 working days across the year.
During February 2018 we turned around:
89.3% of customer post within 15 days
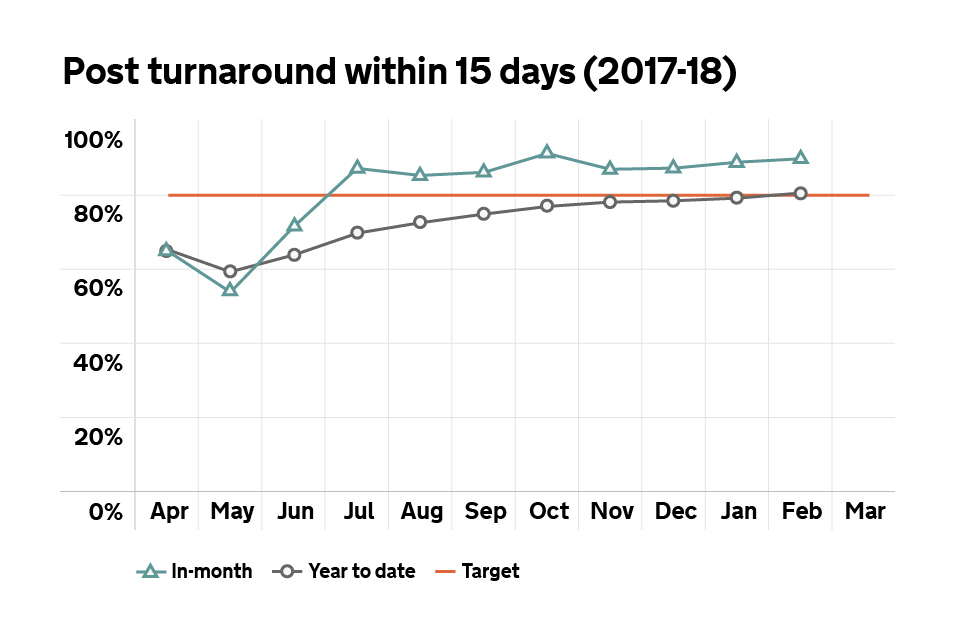
Graph showing percentage of post handled within 15 working days
During February 2018 we turned around:
90.2% of post and i-form correspondence within 15 days
5. Complaints
We want to get all our interactions with customers right first time. We deal with 45 million individuals and more than 5.4 million businesses. Each year we receive more than 50 million phone calls and 12 million letters.
If a customer is unhappy with our service, we aim to resolve a customer’s complaint quickly and fairly.
You can read more detailed guidance on how we handle and resolve complaints.
Definitions:
- A ‘Tier 1 complaint’ is when a customer complains and we aim to resolve their case at this stage
- A ‘Tier 2 complaint’ is when the customer is dissatisfied with our decision on their initial complaint (Tier 1) and they have asked us to look at their concerns again
- ‘Fully upheld’ means we agree with the key part of the customer’s complaint
- ‘Partially upheld’ means we agree with some, but not all, of the customer’s complaint
- ‘Not upheld’ means we don’t agree with the customer’s complaint
5.1 Tier 1 complaints
We received 6,162 Tier 1 complaints in February 2018.
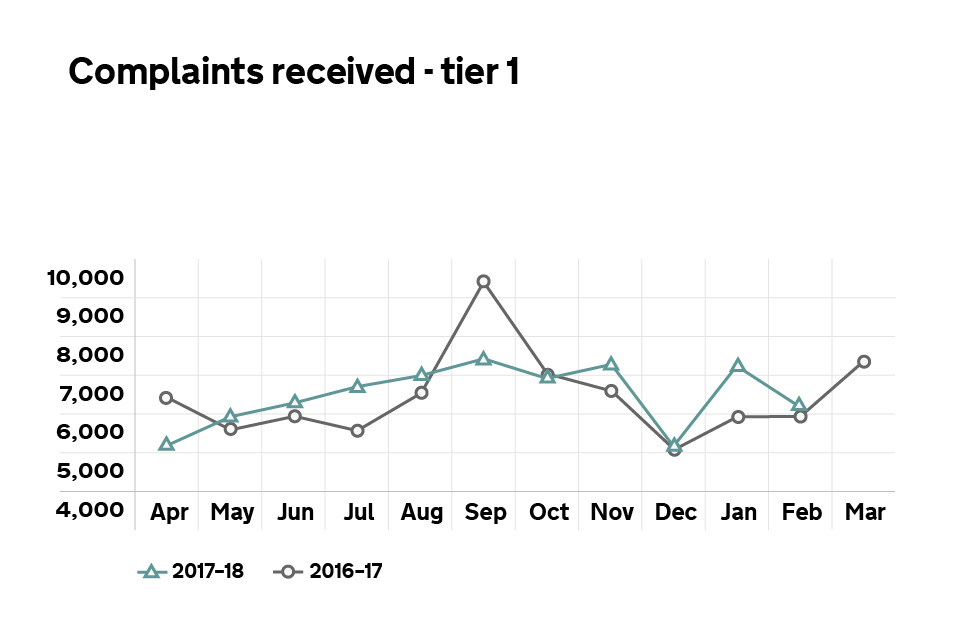
Graph showing the number of Tier 1 complaints received
Note: complaints may not always get logged on our live system in-month and the numbers can therefore increase in subsequent months. The current month will be subject to greatest revision.
Tier 1 complaints cleared
| Apr 2017 | May 2017 | Jun 2017 | Jul 2017 | Aug 2017 | Sep 2017 | Oct 2017 | Nov 2017 | Dec 2017 | Jan 2018 | Feb 2018 | Mar 2018 | |
|---|---|---|---|---|---|---|---|---|---|---|---|---|
| Tier 1 complaints not upheld | 47% | 46% | 46% | 47% | 48% | 48% | 47% | 48% | 48% | 45% | 47% | |
| Tier 1 complaints partially upheld | 14% | 14% | 17% | 15% | 14% | 13% | 13% | 14% | 13% | 13% | 15% | |
| Tier 1 complaints fully upheld | 39% | 39% | 37% | 38% | 39% | 38% | 40% | 38% | 39% | 41% | 38% |
Note: due to rounding, these figures may not add up to 100%.
5.2 Tier 2 complaints
We received 396 Tier 2 complaints in February 2018.
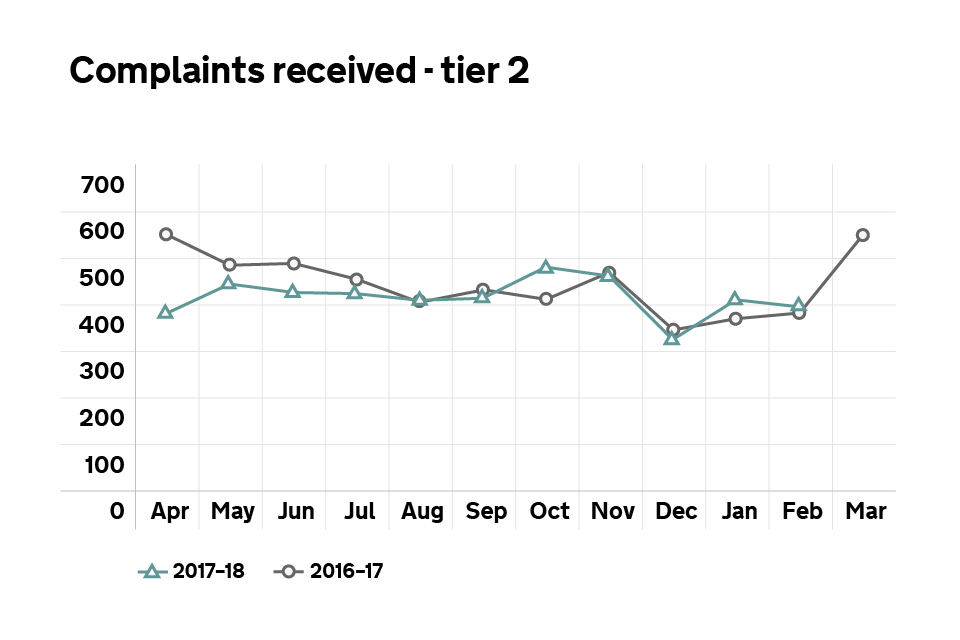
Graph showing the number of Tier 2 complaints received
Note: complaints may not always get logged on our live system in-month and the numbers can therefore increase in subsequent months. The current month will be subject to greatest revision.
Tier 2 complaints cleared
| Apr 2017 | May 2017 | Jun 2017 | Jul 2017 | Aug 2017 | Sep 2017 | Oct 2017 | Nov 2017 | Dec 2017 | Jan 2018 | Feb 2018 | Mar 2018 | |
|---|---|---|---|---|---|---|---|---|---|---|---|---|
| Tier 2 complaints not upheld | 48% | 60% | 55% | 57% | 56% | 59% | 65% | 60% | 65% | 60% | 57% | |
| Tier 2 complaints partially upheld | 29% | 21% | 23% | 23% | 26% | 19% | 20% | 22% | 19% | 18% | 27% | |
| Tier 2 complaints fully upheld | 23% | 19% | 22% | 20% | 18% | 22% | 15% | 18% | 16% | 22% | 16% |
Note: due to rounding, these figures may not add up to 100%.