HMRC issue briefing: Calculating the 2012 to 2013 tax gap
Updated 16 October 2014

© Crown copyright 2014
This publication is licensed under the terms of the Open Government Licence v3.0 except where otherwise stated. To view this licence, visit nationalarchives.gov.uk/doc/open-government-licence/version/3 or write to the Information Policy Team, The National Archives, Kew, London TW9 4DU, or email: psi@nationalarchives.gov.uk.
Where we have identified any third party copyright information you will need to obtain permission from the copyright holders concerned.
This publication is available at https://www.gov.uk/government/publications/hmrc-issue-briefing-calculating-the-2012-to-2013-tax-gap/hmrc-issue-briefing-calculating-the-2012-to-2013-tax-gap
The tax gap gives HMRC a broad picture of the tax that should in theory be collected, against what is actually collected. This briefing explains why we calculate the tax gap each year and how it influences the way we work to collect taxes.
1. What is the tax gap?
The tax gap is the difference between the amount of tax due and the amount collected. It is impossible to collect every penny theoretically owed in tax, so a ‘tax gap’ will always exist. For example, we cannot legally collect taxes from companies that owe tax and are insolvent.
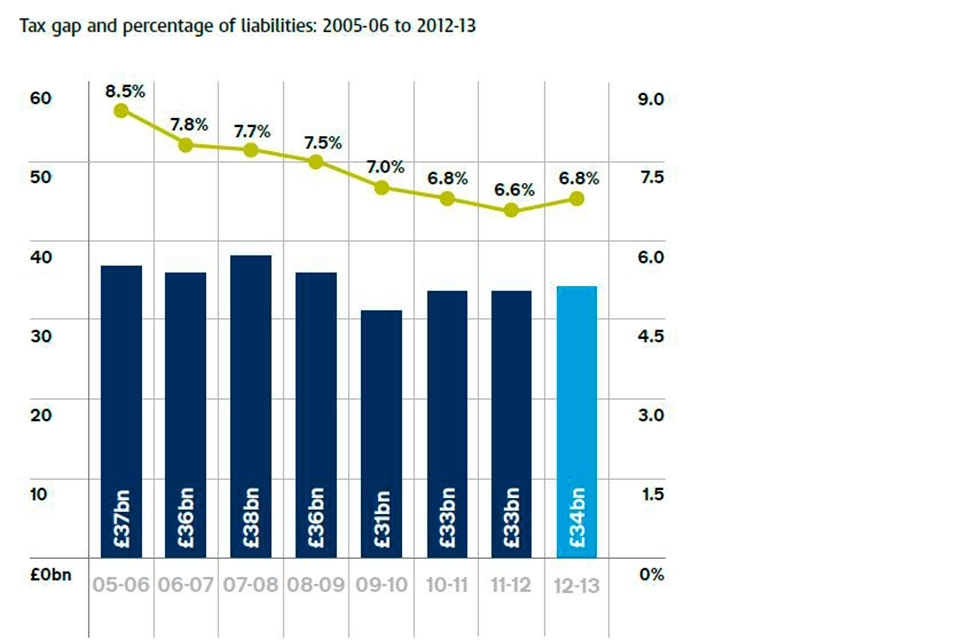
Graph showing the tax gap amounts, and the percentage of total tax liabilities, from 2005 to 2013.
2. Why we measure it
The tax gap is an official statistic. We estimate the tax gap because it provides a useful tool for understanding the relative size and nature of non-compliance.
Tax gap calculations cannot be used for precise performance management for a variety of reasons. For example, some components take a long time to calculate, the estimates are not accurate enough and figures can change when new data becomes available.
We publish tax gap figures every year to show broad trends in compliance and because we want to be transparent in our thinking on this important issue of public interest.
3. Latest calculations
We estimate the 2012 to 2013 tax gap was 6.8% of total tax and duties due, which equates to £34 billion, after we deduct the money we bring in through our compliance activities. The tax gap showed a long-term downward trend between 2005 to 2006 and 2011 to 2012, rising marginally in 2012 to 2013.
Changes in tax rates and other external factors, such as economic growth, also affect the tax gap, so it is most appropriate to present it as a share of total tax liabilities. The percentage tax gap trended downwards overall from 8.5% in 2005 to 2006 (the first year it was compiled) to reach 6.6% in 2011 to 2012 (revised down from 7% in last year’s publication) and then 6.8% in 2012 to 2013.
Since 2005 to 2006 the fall in the tax gap translates into an additional £43 billion in cumulative tax collected.
The slight increase in the overall tax gap in 2012 to 2013 is mostly due to an increase in the VAT gap from 10.4% to 10.9%, and an increase in the tobacco tax gap from 12% to 14.2%.
The reason that the VAT gap grew is that VAT receipts in 2012 to 2013 didn’t increase as fast as economic data on spending suggested they should have. We have looked very closely at the data and cannot see any significant new pattern of non-compliance to cause us specific concern. Provisional data for 2013 to 2014 tells us that the VAT gap fell the following year.
We expected price and duty increases to affect the tobacco tax gap. High prices and duty rates create an incentive to smuggle, but the level of tobacco taxation alone does not explain smuggling levels, as some countries with relatively low rates of duty experience widespread smuggling. Lowering duty rates would not significantly help prevent smuggling of counterfeit products.
4. Accuracy of the calculations
Tax gap calculations are a complex series of measurements; this is partly why many other countries do not produce a tax gap estimate. Because we have data that covers virtually all tax sources, and have had our calculations reviewed and endorsed by the International Monetary Fund, we are confident that our calculations are as accurate as they can be, and that the estimates are made on a like-for-like basis each year.
To put the £34 billion tax gap in context, we collected £475.6 billion in tax during 2012 to 2013. The figures, combined with our own customer research, show the vast majority, 93%, of UK taxpayers are compliant in paying their taxes, with only a small minority choosing to bend or break the rules.
5. Our approach to tackling the tax gap
Calculating the tax gap helps us to develop strategies which are tailored to the behaviours of our different customer groups. As a result of this tailored approach, we collected and then recorded compliance revenues of £20.7 billion in 2012 to 2013, exceeded in 2013 to 2014 by a further record-breaking £23.9 billion. This improvement in performance means that more money is available to the Exchequer, because we have collected tax that would otherwise not have been paid.
Just under half the £23.9 billion figure relates to protecting revenue from non-compliance. This means we stop the amount of tax we collect from falling, but it doesn’t reduce the tax gap; there isn’t a simple link between additional revenues and a reduction in the tax gap.
Our approach to organised criminal attacks – for example, on the VAT or excise systems – combines the best of a modern business in developing fraud-resistant systems with the capabilities of a modern law enforcement agency.
Our anti-avoidance strategy underpins our approach to tackling tax avoidance across all customer groups. By preventing avoidance at the outset where possible, detecting it early and countering it effectively through legal challenge or legislative change, our strategy is delivering significant successes against tax avoiders and those who promote tax avoidance schemes. The government has made 42 separate changes to tax law, closing down loopholes and introducing major reforms to the UK tax system since April 2010. We can see that the market for tax avoidance schemes is shrinking; the number of schemes subject to Disclosure of Tax Avoidance Schemes (DOTAS) rules fell by more than 75% from 116 in 2009 to 2010 to just 28 in 2013 to 2014.
Large business customers pay the majority of corporation tax, and a large percentage of VAT and PAYE taxes. Our approach to large business is to improve compliance through close monitoring, identifying high-risk areas of non-compliance, and assembling dedicated task forces to tackle the most serious cases. A relatively small number of tax risks produce most of the additional revenue raised.
We know most small and medium-sized enterprises (SMEs) want to pay the right amount of tax, but we estimate that this customer group is responsible for nearly half the value of the tax gap. Making errors and failing to take reasonable care in dealing with us are the main reasons why the gap for this customer group persists. We already provide a wide range of tailored and targeted support to help customers get things right at key points in their business lifecycle.
We are investing heavily in digital tools and services that will provide all businesses with better targeted and more personalised services. This includes the development of a digital account called Your Tax Account which provides a single homepage from which businesses and individuals can access everything they need to manage their tax affairs online. We are also developing digital help and support, such as webinars and YouTube videos, as well as working with software providers on record keeping apps that help businesses keep the records they need to get their tax right.
All our customers can make errors, which is a significant part of the tax gap, so we’re already providing a wide range of tailored and targeted support to help them get it right.
Our campaigns target specific customer groups so they have the opportunity voluntarily to put their tax affairs in order. But we are also determined to crack down on evasion; tax gap analysis suggests that this is a significant risk among a small minority of SMEs. We have invested heavily in our strategic data matching system Connect and in additional compliance staff to address this. We also use specialist taskforces to tackle evasion in specific, high-risk regions and sectors. We have collected more than £213 million using 83 taskforces since 2011 to 2012.
Most taxes paid by individual customers are collected by their employers, so one priority is to support employers and make it easier for individuals to contact us about adjustments to their tax affairs. The introduction of Real Time Information for PAYE has paved the way for significant improvements in accuracy, and will reduce the need for customers to contact us to sort out their tax affairs.
Find out more about measuring the tax gap.